Revenus déclarés à l’impôt sur le revenu par catégorie, 2019-2024

Données - DGFIP

Code
source(here::here("_rinit.R"))
invisible(Sys.setlocale("LC_TIME", "fr_FR.UTF-8"))
# cd ~/iCloud/website/data/dgfip; /usr/local/bin/R -e 'quarto::quarto_render("ir-revenus-categoriels.qmd")'
# cd ~/iCloud/website/data; sh _status/run_all_silent.sh --only dgfip

knitr::opts_chunk$set(echo = TRUE, message = FALSE, warning = FALSE,
                       fig.width = 9, fig.height = 5.5, dpi = 150)
source(here::here("data", "dgfip", "_cartes.R"))

ds_path <- here::here("data", "dgfip", "ir-revenus-categoriels.parquet")
irk <- arrow::read_parquet(ds_path)
fr <- scales::label_number(big.mark = " ", decimal.mark = ",")

theme_dgfip <- theme_minimal(base_size = 12) +
  theme(plot.title = element_text(face = "bold"),
        plot.subtitle = element_text(colour = "grey35"),
        panel.grid.minor = element_blank())

Source : DGFIP, statistiques sur l’impôt sur le revenu. Nombre de foyers (milliers) et montant des revenus déclarés (millions d’euros) par catégorie de revenu, pour l’ensemble des foyers, les foyers non imposés et les foyers imposés.

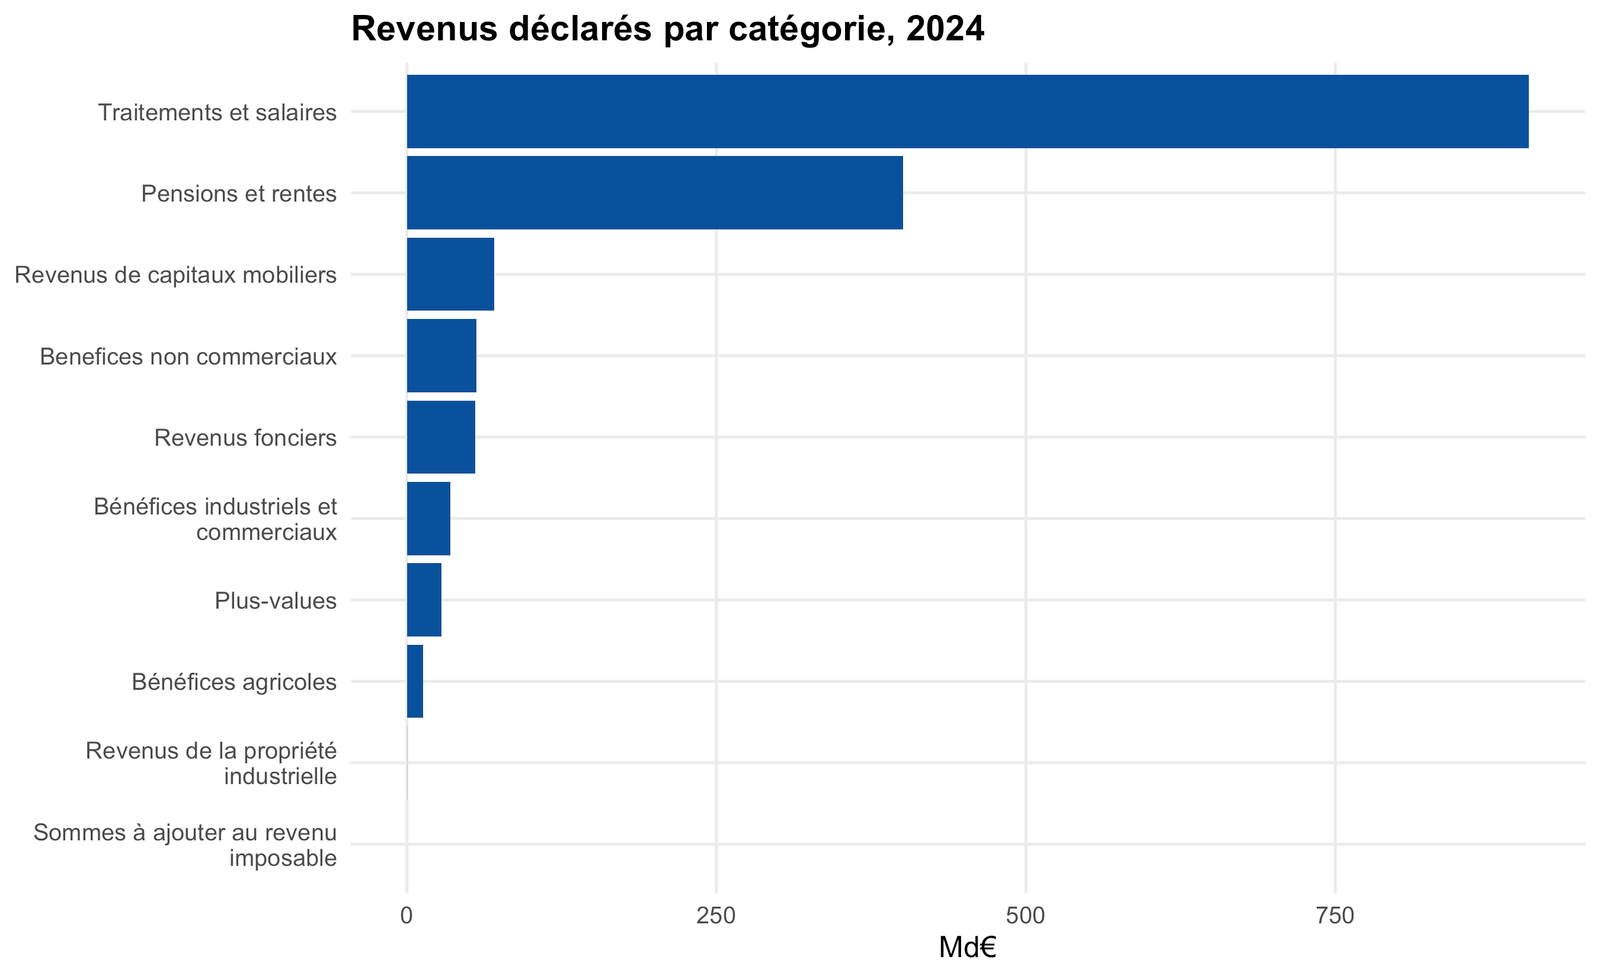
Montant déclaré par catégorie, dernière année

Code
dernier <- max(irk$annee)
irk |>
  dplyr::filter(annee == dernier, population == "Ensemble des foyers") |>
  dplyr::group_by(categorie) |>
  dplyr::summarise(montant = sum(montant, na.rm = TRUE), .groups = "drop") |>
  dplyr::filter(montant > 0) |>
  dplyr::mutate(categorie = forcats::fct_reorder(stringr::str_wrap(categorie, 30), montant)) |>
  ggplot(aes(categorie, montant / 1000)) + geom_col(fill = "#08519c") + coord_flip() +
  scale_y_continuous(labels = fr) +
  labs(title = paste0("Revenus déclarés par catégorie, ", dernier), x = NULL, y = "Md€") + theme_dgfip

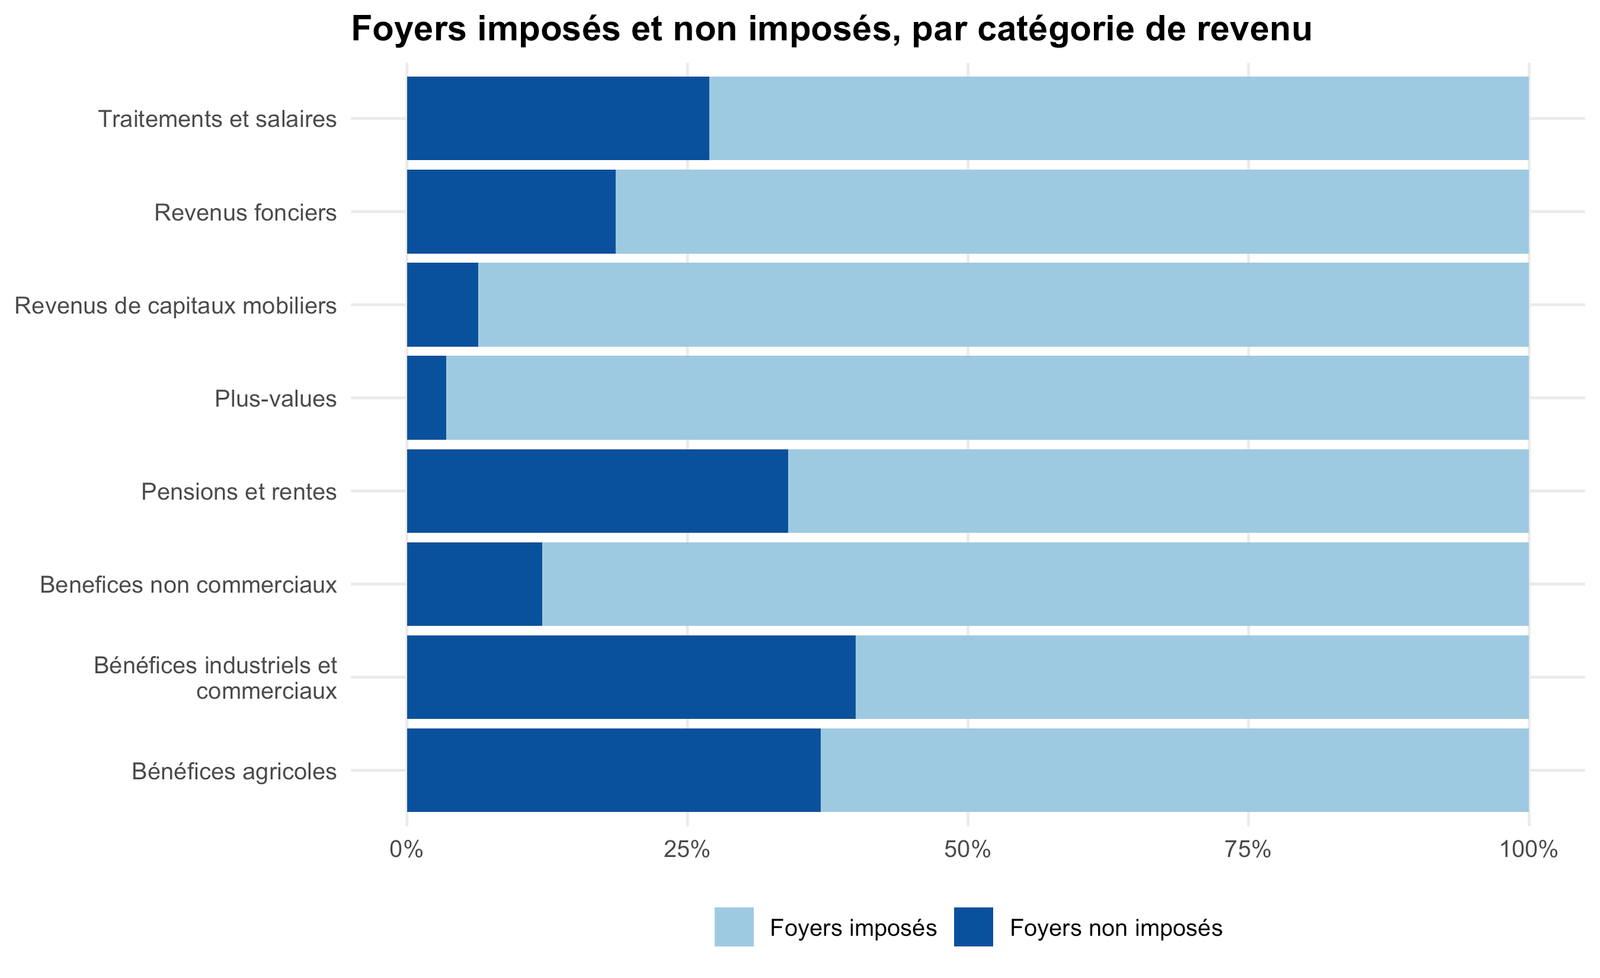
Part des revenus déclarés par les foyers imposés

Code
irk |>
  dplyr::filter(annee == dernier, population != "Ensemble des foyers") |>
  dplyr::group_by(categorie, population) |>
  dplyr::summarise(montant = sum(montant, na.rm = TRUE), .groups = "drop") |>
  dplyr::group_by(categorie) |> dplyr::filter(sum(montant) > 5000) |>
  dplyr::mutate(part = montant / sum(montant), categorie = stringr::str_wrap(categorie, 30)) |>
  ggplot(aes(categorie, part, fill = population)) + geom_col() + coord_flip() +
  scale_y_continuous(labels = scales::label_percent(accuracy = 1)) +
  scale_fill_manual(values = c("#9ecae1", "#08519c"), name = NULL) +
  labs(title = "Foyers imposés et non imposés, par catégorie de revenu", x = NULL, y = NULL) +
  theme_dgfip + theme(legend.position = "bottom")

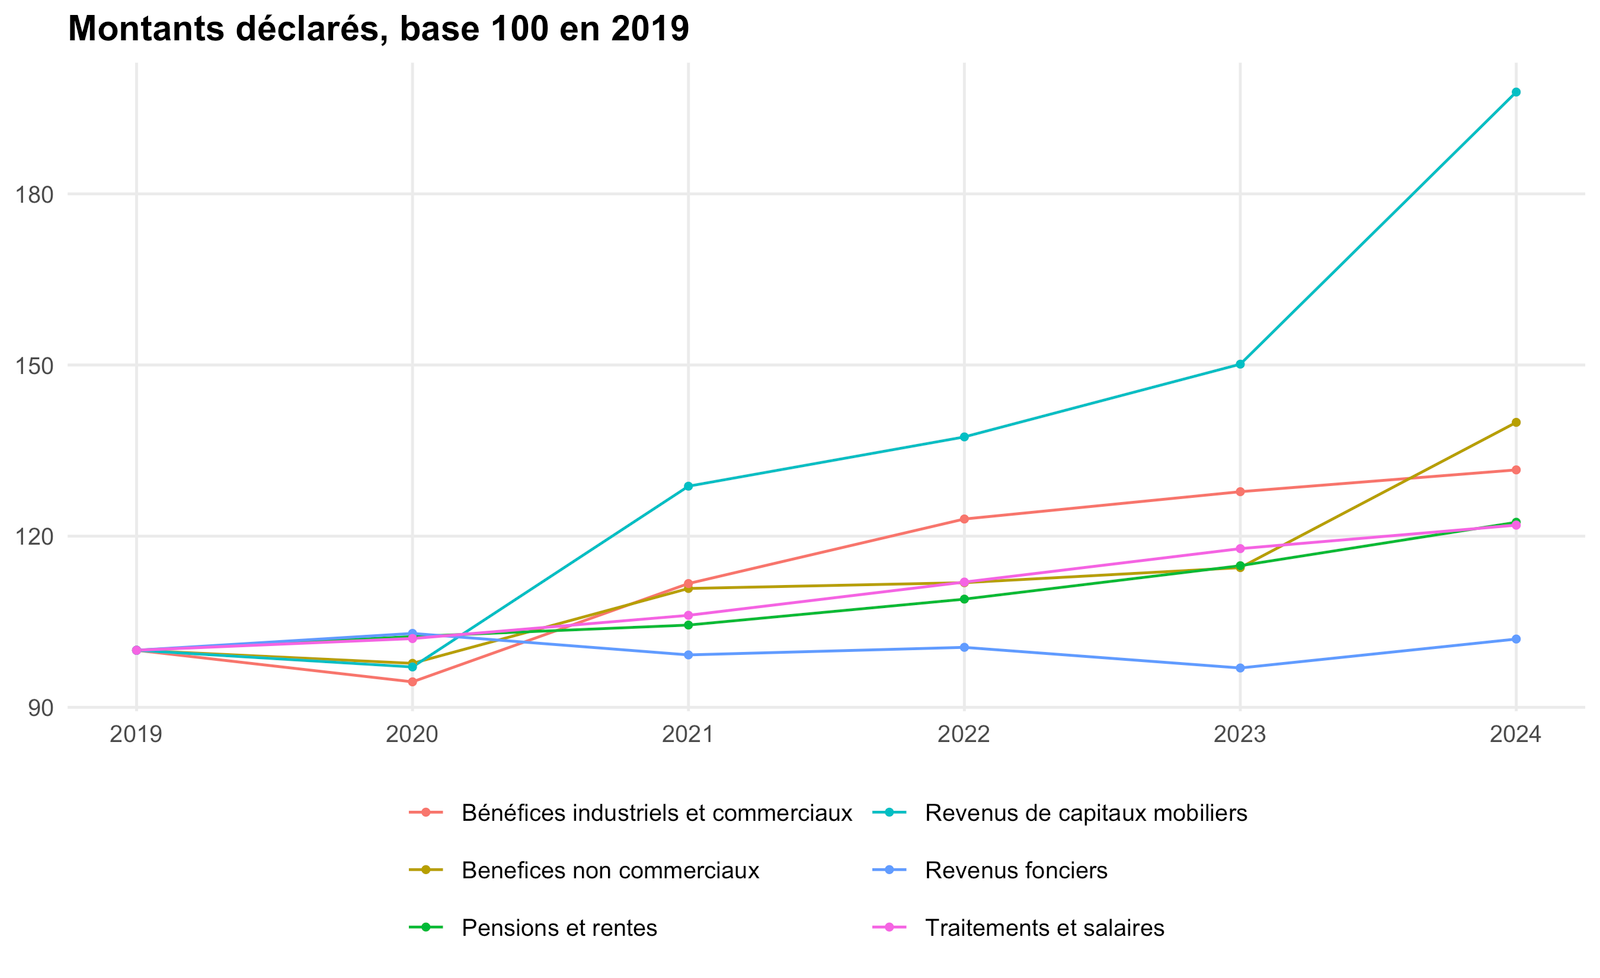
Évolution des principales catégories (2019 = 100)

Code
irk |>
  dplyr::filter(population == "Ensemble des foyers") |>
  dplyr::group_by(annee, categorie) |>
  dplyr::summarise(montant = sum(montant, na.rm = TRUE), .groups = "drop") |>
  dplyr::group_by(categorie) |>
  dplyr::filter(montant[annee == min(annee)] > 20000) |>
  dplyr::mutate(indice = 100 * montant / montant[annee == min(annee)]) |>
  ggplot(aes(annee, indice, colour = categorie)) + geom_line() + geom_point(size = 1) +
  scale_x_continuous(breaks = scales::breaks_pretty(6)) +
  labs(title = "Montants déclarés, base 100 en 2019", x = NULL, y = NULL, colour = NULL) +
  theme_dgfip + theme(legend.position = "bottom") + guides(colour = guide_legend(ncol = 2))