Last observation: 2019 (N = 13)
First observation: 1996 (N = 10)
Last data update: 18 oct. 2026, 23:12
Last compile: 18 oct. 2026, 23:12
Table source des effectifs par versant de la fonction publique (FPE, FPT, FPH), de l’emploi total et de la part du public dans l’emploi total : mêmes séries que FT12_FPE_FPH_FPT, sous une forme légèrement différente (détail employeurs ministères/EPA, collectivités/EPA, hôpitaux/EHPA/autres).
calculs_coins_table |>
  filter(variable %in% c("FPE", "FPT", "FPH")) |>
  ggplot(aes(x = date, y = value / 1e6, color = variable)) +
  geom_line(linewidth = 1) +
  scale_color_brewer(palette = "Set1", name = NULL) +
  theme_minimal(base_size = 12) +
  labs(x = NULL, y = "Millions d'agents",
       title = "Effectifs par versant de la fonction publique",
       subtitle = "1996-") +
  theme(legend.position = "bottom", panel.grid.minor = element_blank())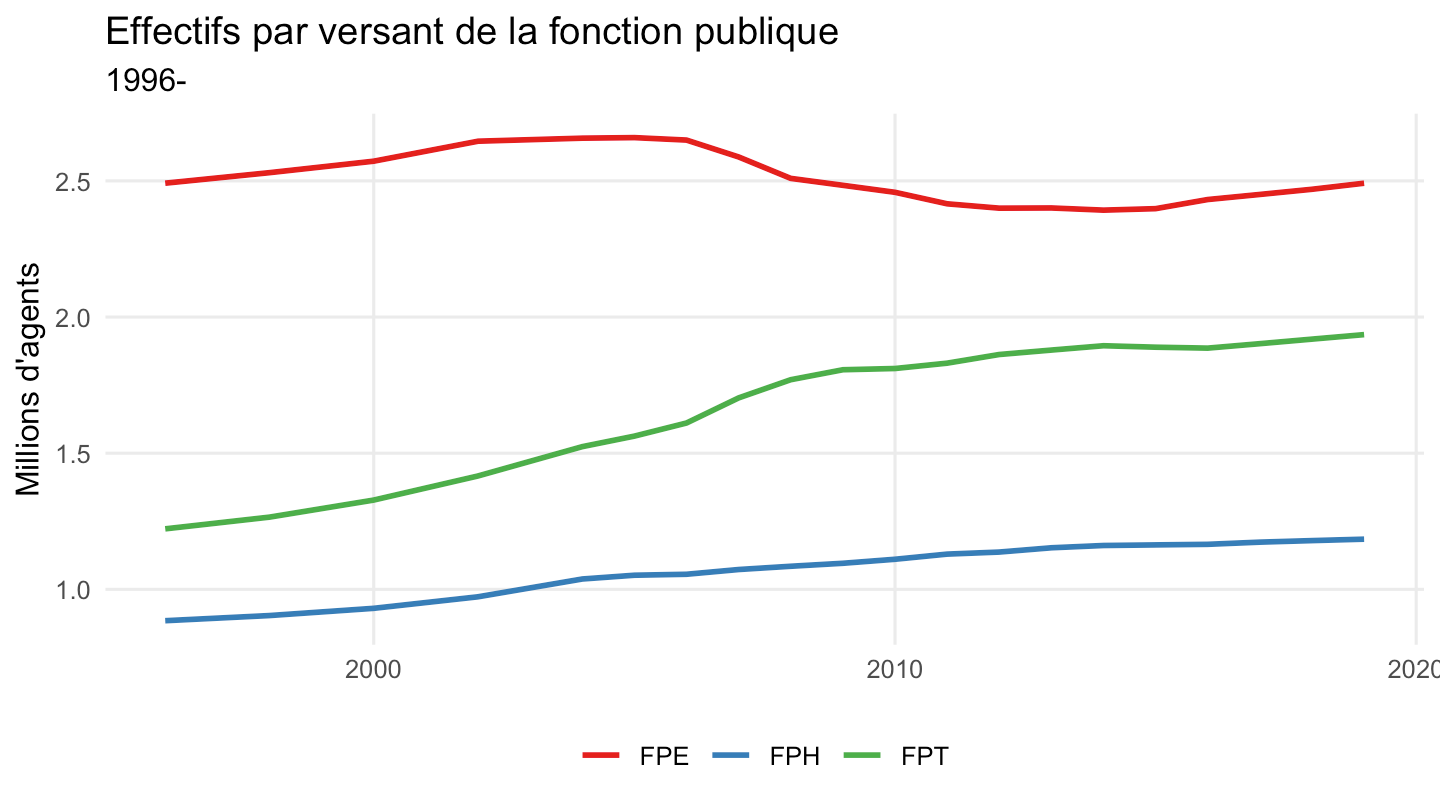
calculs_coins_table |>
  filter(variable %in% c("FPE_ministeres", "FPE_EPA", "FPT_collectivites", "FPT_EPA",
                          "FPH_hopitaux", "FPH_EHPA", "FPH_autres")) |>
  mutate(versant = case_when(str_starts(variable, "FPE") ~ "FPE", str_starts(variable, "FPT") ~ "FPT",
                              str_starts(variable, "FPH") ~ "FPH")) |>
  ggplot(aes(x = date, y = value / 1e6, color = variable)) +
  geom_line(linewidth = 1) +
  facet_wrap(~ versant, scales = "free_y") +
  scale_color_brewer(palette = "Set2", name = NULL) +
  theme_minimal(base_size = 9) +
  labs(x = NULL, y = "Millions d'agents",
       title = "Effectifs par type d'employeur",
       subtitle = "1996-") +
  theme(legend.position = "bottom", panel.grid.minor = element_blank())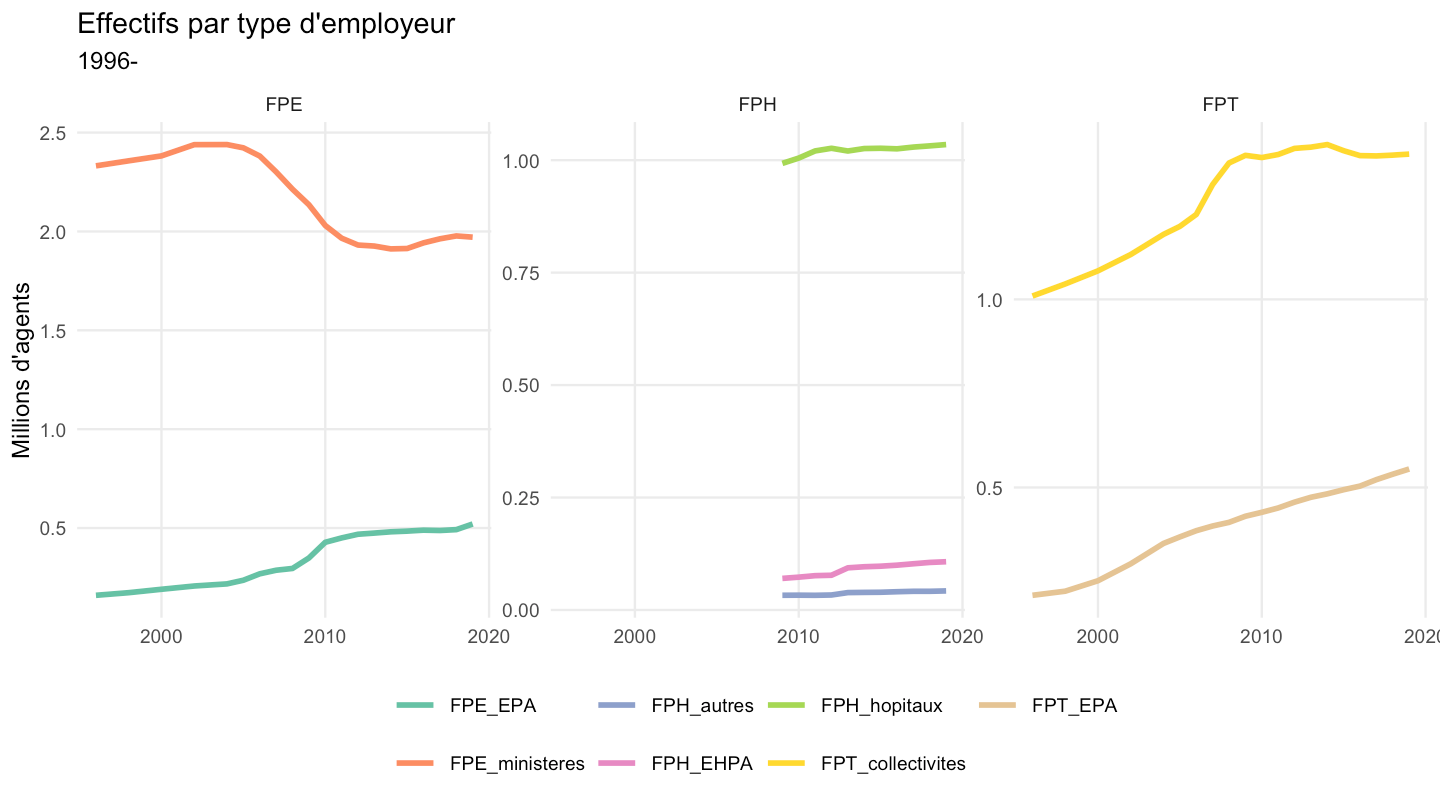
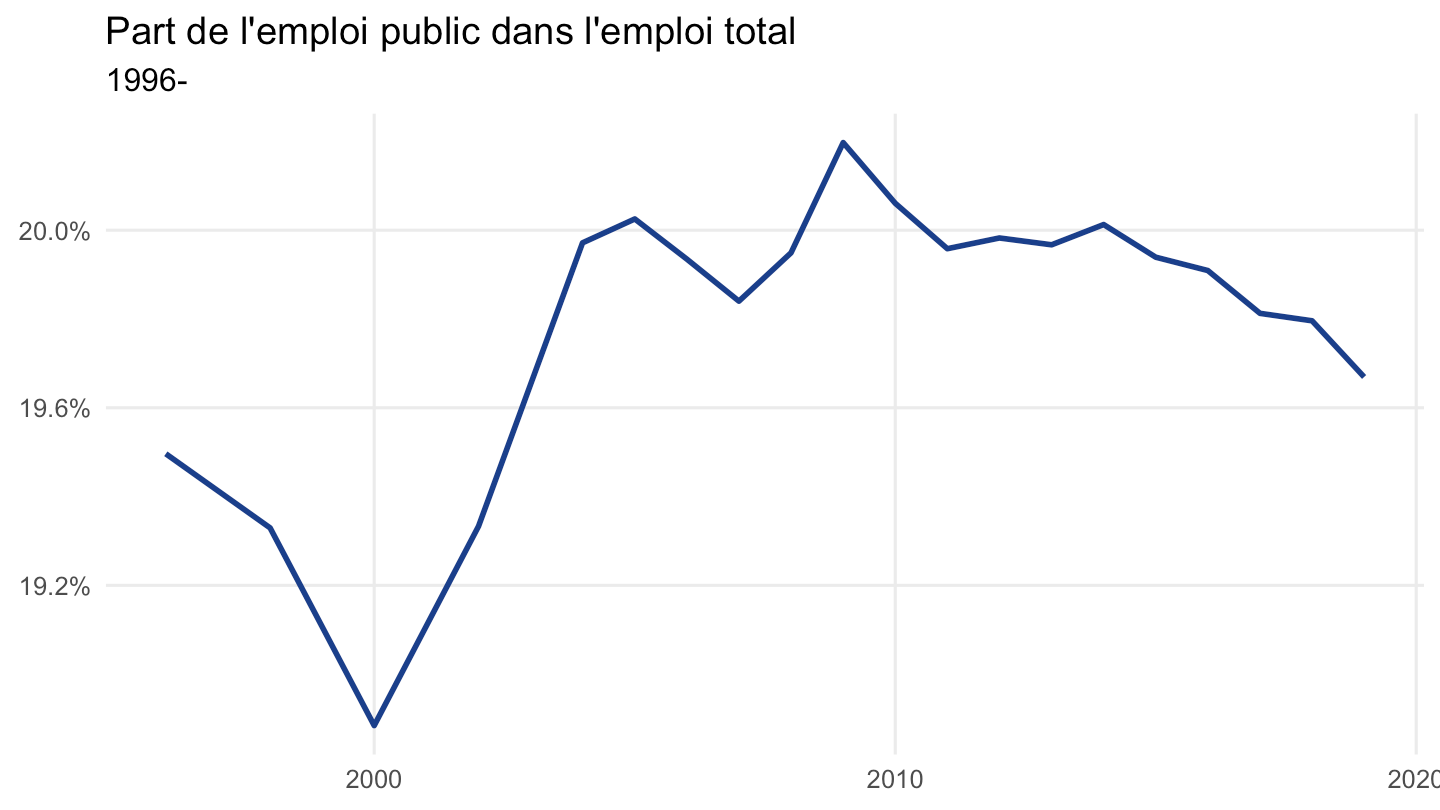
calculs_coins_table |>
  filter(variable == "part_public") |>
  ggplot(aes(x = date, y = value / 100)) +
  geom_line(linewidth = 1, color = "#1B3F8B") +
  scale_y_continuous(labels = scales::percent_format(accuracy = 0.1)) +
  theme_minimal(base_size = 12) +
  labs(x = NULL, y = NULL,
       title = "Part de l'emploi public dans l'emploi total",
       subtitle = "1996-") +
  theme(panel.grid.minor = element_blank())