
Last observation: 2019 (N = 13)
First observation: 1996 (N = 10)
Last data update: 18 oct. 2026, 23:12
Last compile: 18 oct. 2026, 23:13
FT12_FPE_FPH_FPT |>
  #filter(variable %in% c("FPT", "FPH", "FPE", "FP", "Emploi total")) %>%
  group_by(variable) |>
  mutate(date = date) |>
  mutate(value = 100*value/value[1]) |>
  ggplot() + geom_line(aes(x = date, y = value, color = variable)) +
  theme_minimal() + xlab("") + ylab("") +
  scale_x_date(breaks = seq(1997, 2100, 2) |> paste0("-01-01") |> as.Date(),
               labels = date_format("%Y")) +
  scale_y_continuous(breaks = seq(0, 500, 10)) +
  #scale_color_manual(values = viridis(6)[1:5]) +
  theme(legend.position = c(0.15, 0.6),
        legend.title = element_blank())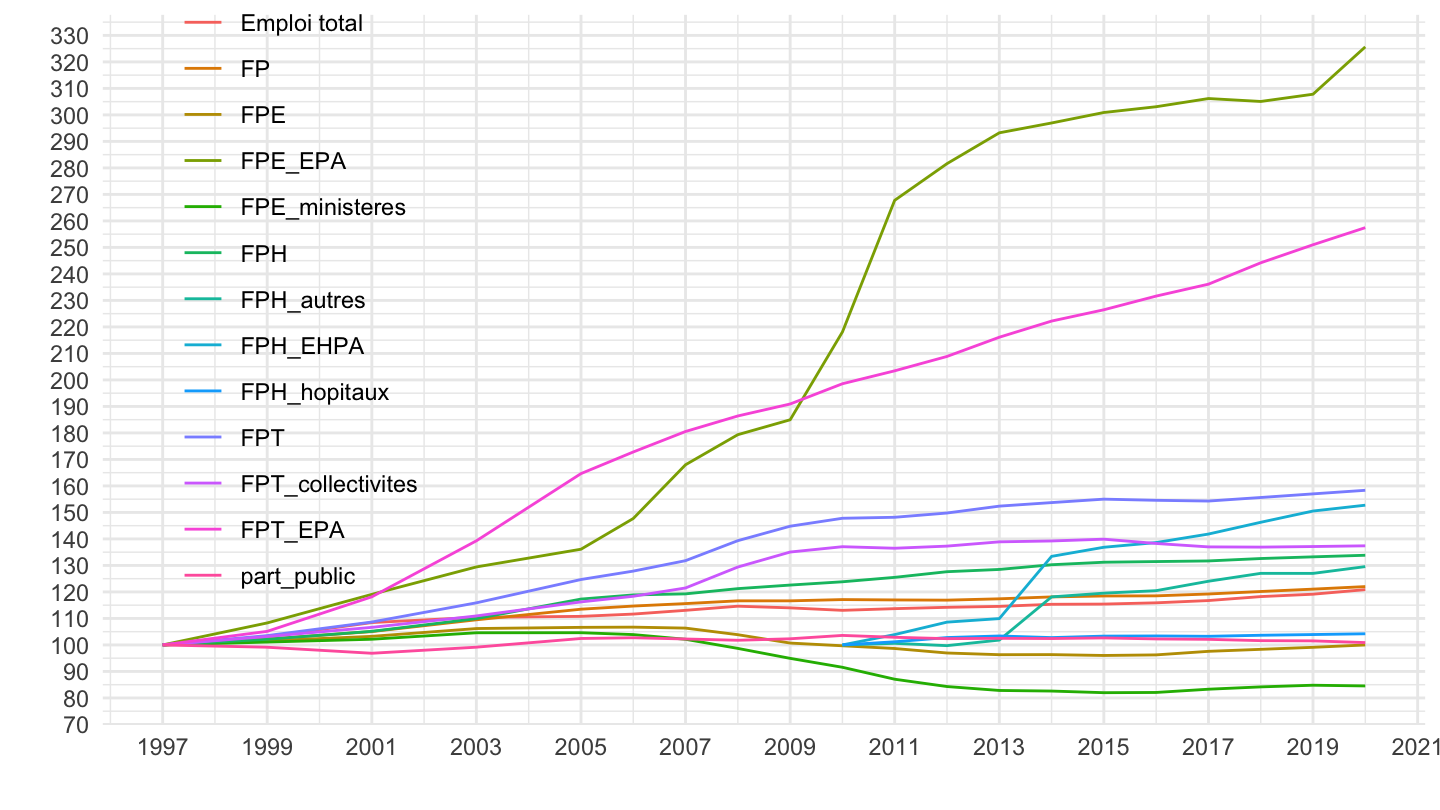
FT12_FPE_FPH_FPT |>
  filter(grepl("part_public", variable)) |>
  group_by(variable) |>
  mutate(date = date) |>
  ggplot() + geom_line(aes(x = date, y = value/100, color = variable)) +
  theme_minimal() + xlab("") + ylab("") +
  scale_x_date(breaks = seq(1997, 2100, 2) |> paste0("-01-01") |> as.Date(),
               labels = date_format("%Y")) +
  scale_y_continuous(breaks = 0.01*seq(0, 500, .1),
                     labels = percent_format(acc = .1)) +
  #scale_color_manual(values = viridis(6)[1:5]) +
  theme(legend.position = c(0.15, 0.7),
        legend.title = element_blank())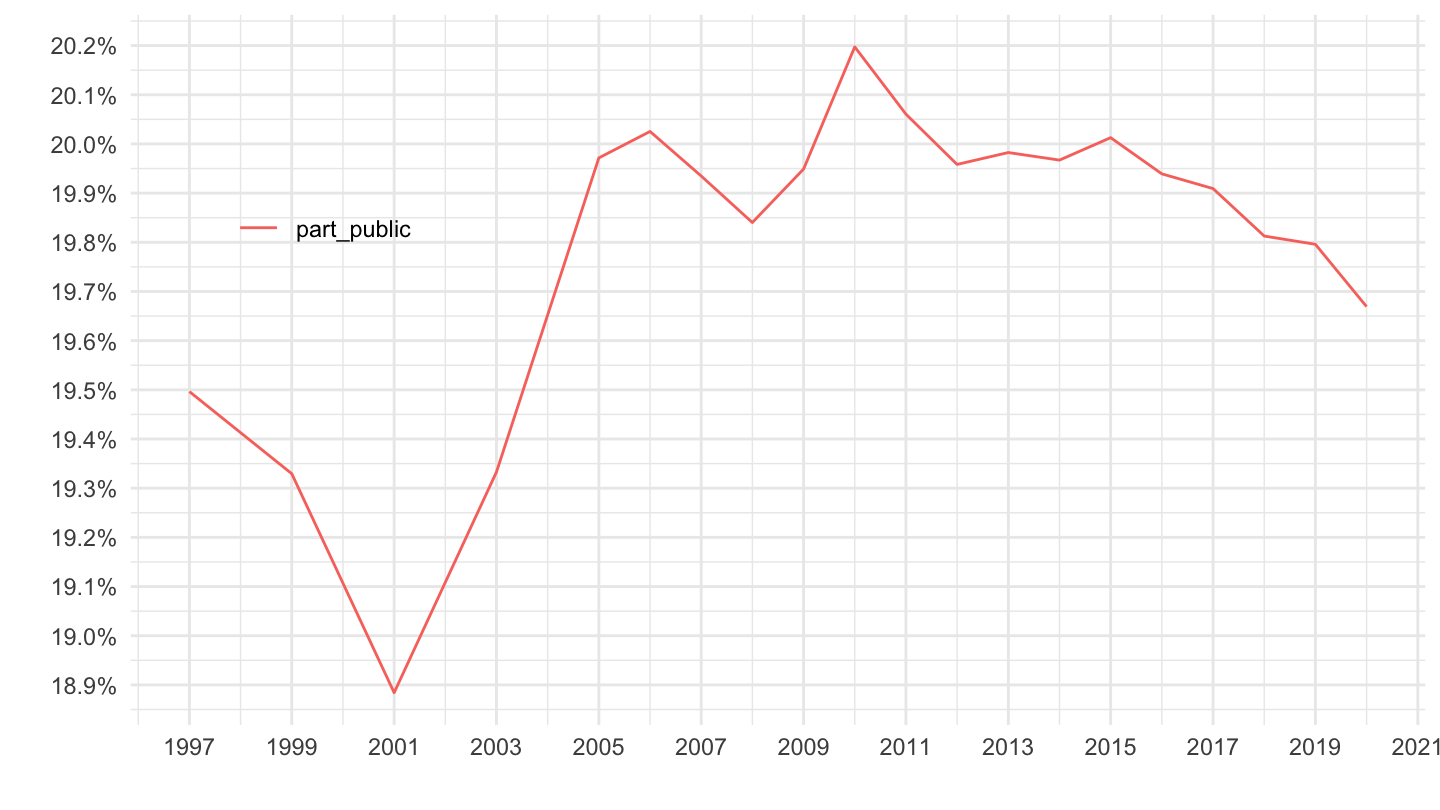
FT12_FPE_FPH_FPT |>
  filter(grepl("part_public", variable)) |>
  group_by(variable) |>
  mutate(date = date) |>
  filter(date >= as.Date("2009-01-01")) |>
  ggplot() + geom_line(aes(x = date, y = value/100, color = variable)) +
  theme_minimal() + xlab("") + ylab("") +
  scale_x_date(breaks = seq(1997, 2100, 1) |> paste0("-01-01") |> as.Date(),
               labels = date_format("%Y")) +
  scale_y_continuous(breaks = 0.01*seq(0, 500, .1),
                     labels = percent_format(acc = .1)) +
  #scale_color_manual(values = viridis(6)[1:5]) +
  theme(legend.position = c(0.15, 0.7),
        legend.title = element_blank())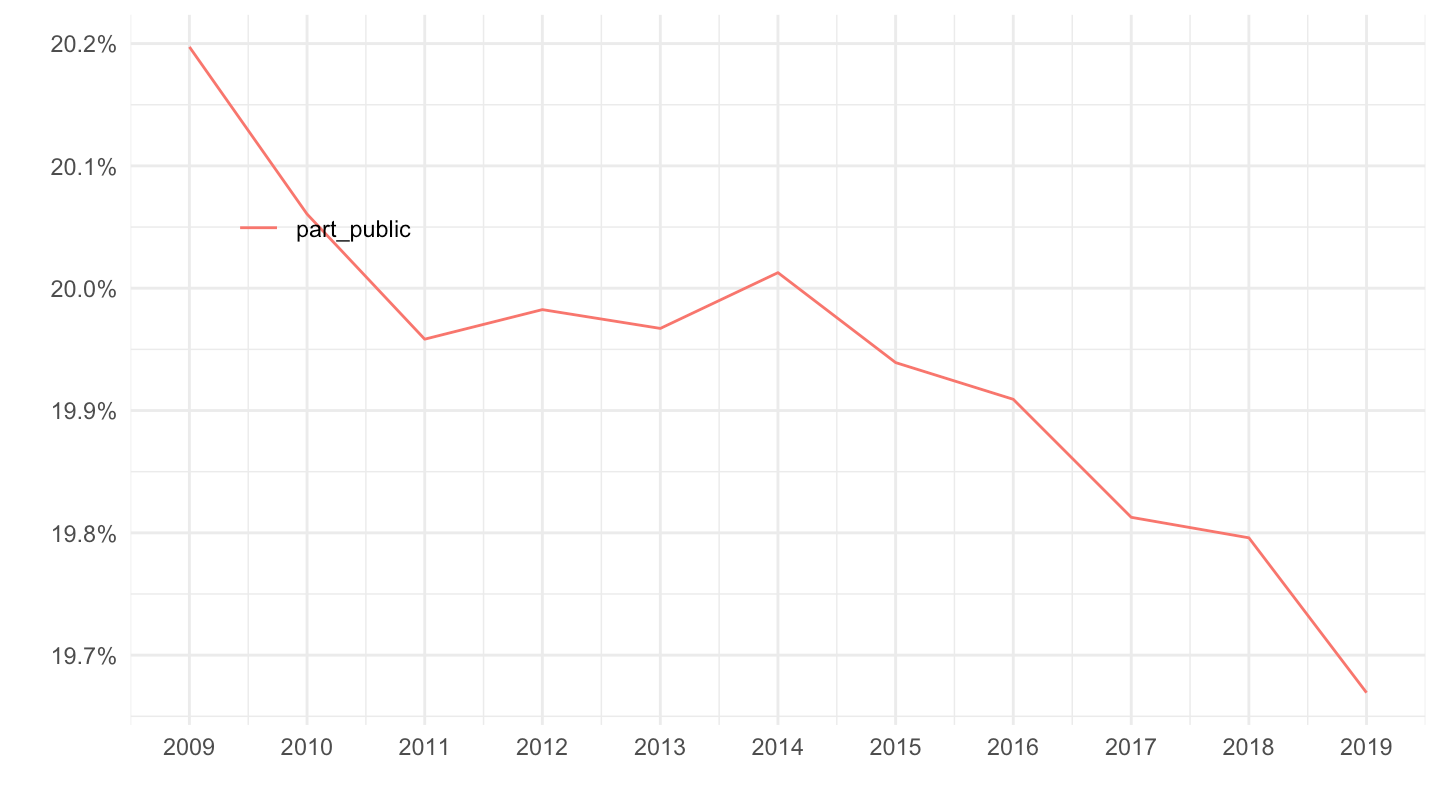
FT12_FPE_FPH_FPT |>
  filter(variable %in% c("FPH_hopitaux", "Emploi total", "FPH", "FPH_autres", "FPH_EHPA")) |>
  group_by(variable) |>
  mutate(date = date) |>
  filter(date >= as.Date("2010-01-01")) |>
  mutate(value = 100*value/value[1]) |>
  ggplot() + geom_line(aes(x = date, y = value, color = variable)) +
  theme_minimal() + xlab("") + ylab("") +
  scale_x_date(breaks = seq(1997, 2100, 1) |> paste0("-01-01") |> as.Date(),
               labels = date_format("%Y")) +
  scale_y_continuous(breaks = seq(0, 500, 5)) +
  #scale_color_manual(values = viridis(6)[1:5]) +
  theme(legend.position = c(0.15, 0.7),
        legend.title = element_blank()) +
  geom_label_repel(data = . %>% filter(date == max(date)),
             aes(x = date, y = value, label = variable, color = variable),
             size = 2)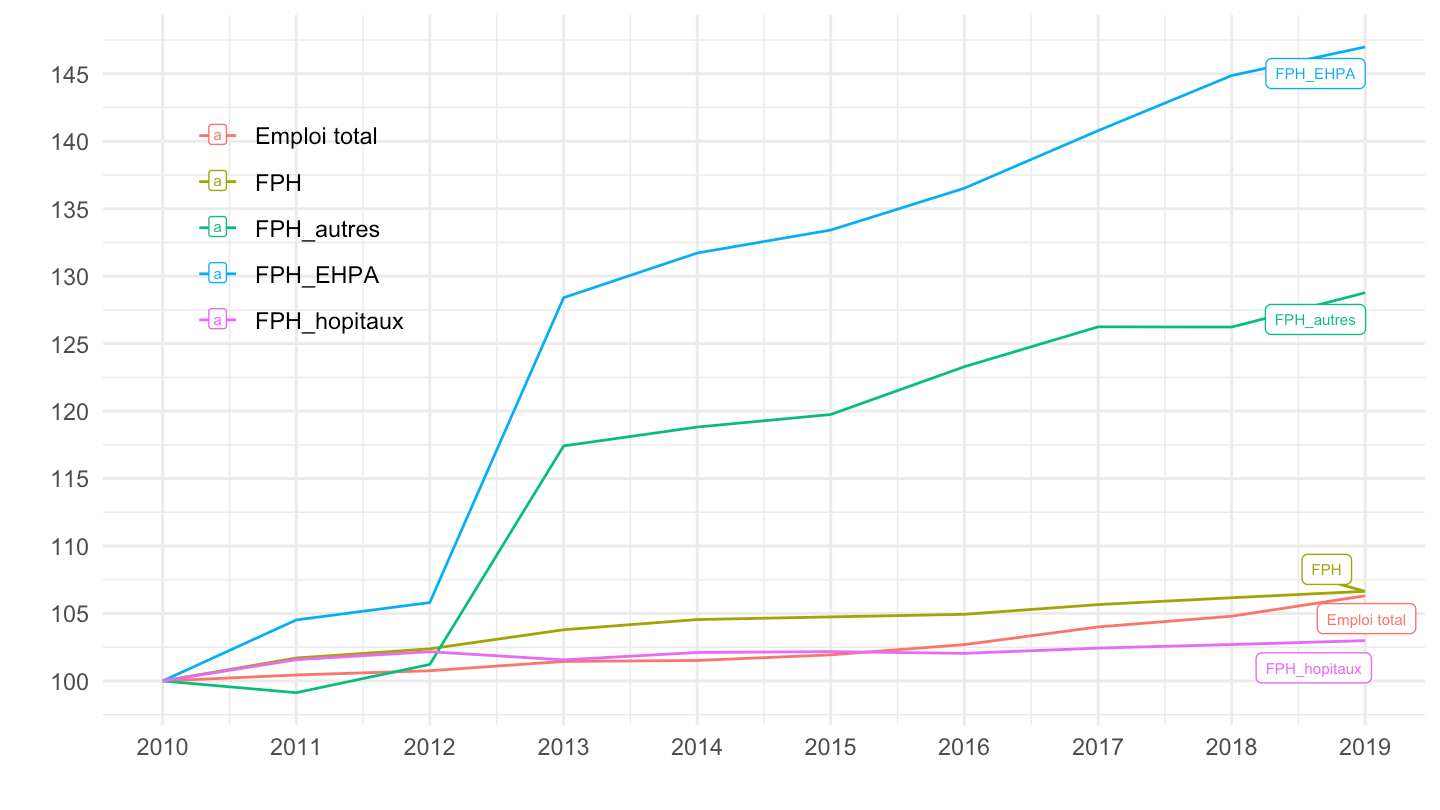
FT12_FPE_FPH_FPT |>
  group_by(variable) |>
  filter(!(grepl("EPA", variable))) |>
  mutate(date = date) |>
  mutate(value = 100*value/value[1]) |>
  ggplot() + geom_line(aes(x = date, y = value, color = variable)) +
  theme_minimal() + xlab("") + ylab("") +
  scale_x_date(breaks = seq(1997, 2100, 2) |> paste0("-01-01") |> as.Date(),
               labels = date_format("%Y")) +
  scale_y_continuous(breaks = seq(0, 500, 10)) +
  #scale_color_manual(values = viridis(6)[1:5]) +
  theme(legend.position = c(0.15, 0.7),
        legend.title = element_blank()) +
  geom_label_repel(data = . %>% filter(date == max(date)),
             aes(x = date, y = value, label = variable, color = variable),
             size = 2)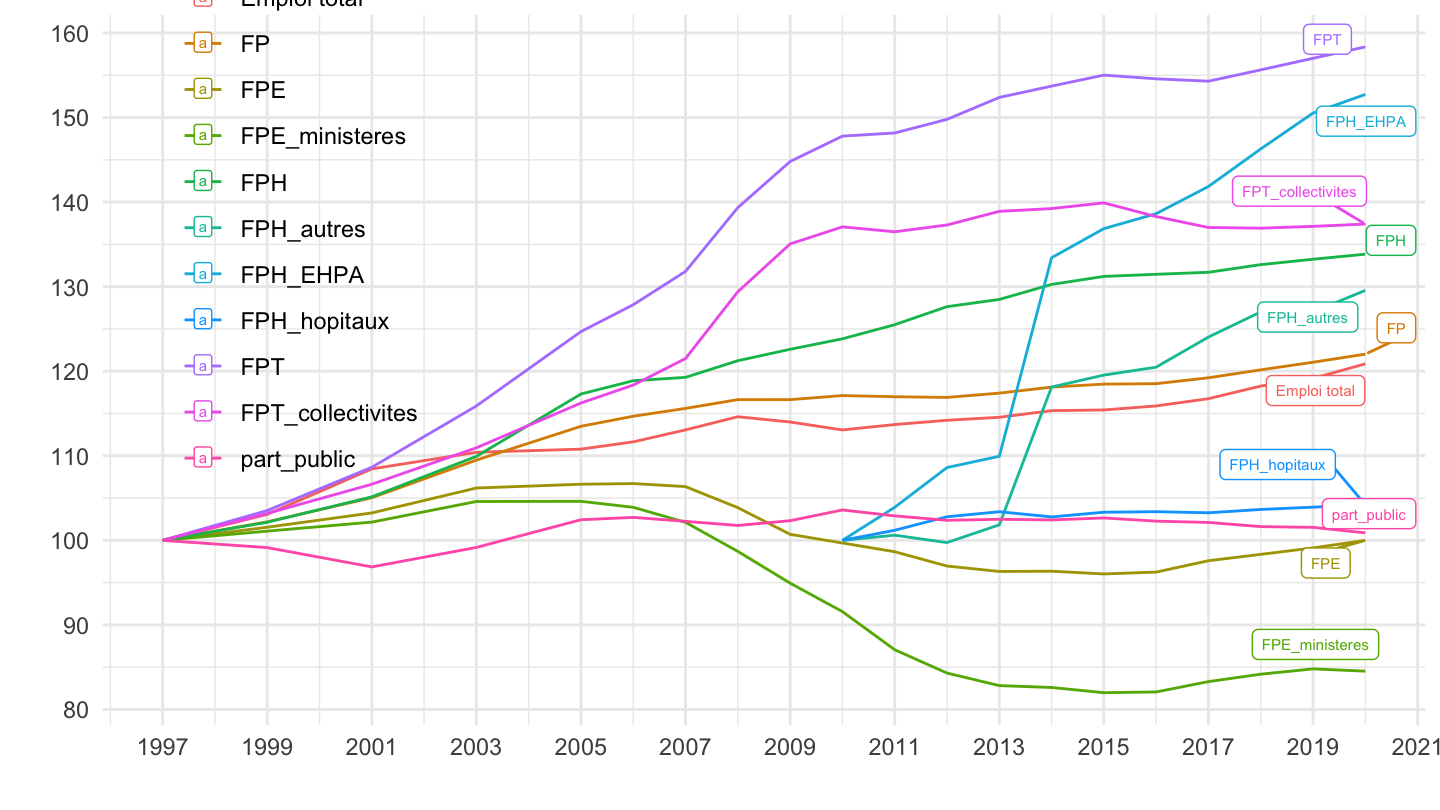
FT12_FPE_FPH_FPT |>
  filter(!(grepl("EPA", variable))) |>
  group_by(variable) |>
  mutate(date = date) |>
  filter(date >= as.Date("2010-01-01")) |>
  mutate(value = 100*value/value[1]) |>
  ggplot() + geom_line(aes(x = date, y = value, color = variable)) +
  theme_minimal() + xlab("") + ylab("") +
  scale_x_date(breaks = seq(1997, 2100, 1) |> paste0("-01-01") |> as.Date(),
               labels = date_format("%Y")) +
  scale_y_continuous(breaks = seq(0, 500, 10)) +
  #scale_color_manual(values = viridis(6)[1:5]) +
  theme(legend.position = c(0.15, 0.6),
        legend.title = element_blank()) +
  geom_label_repel(data = . %>% filter(date == max(date)),
             aes(x = date, y = value, label = variable, color = variable),
             size = 2)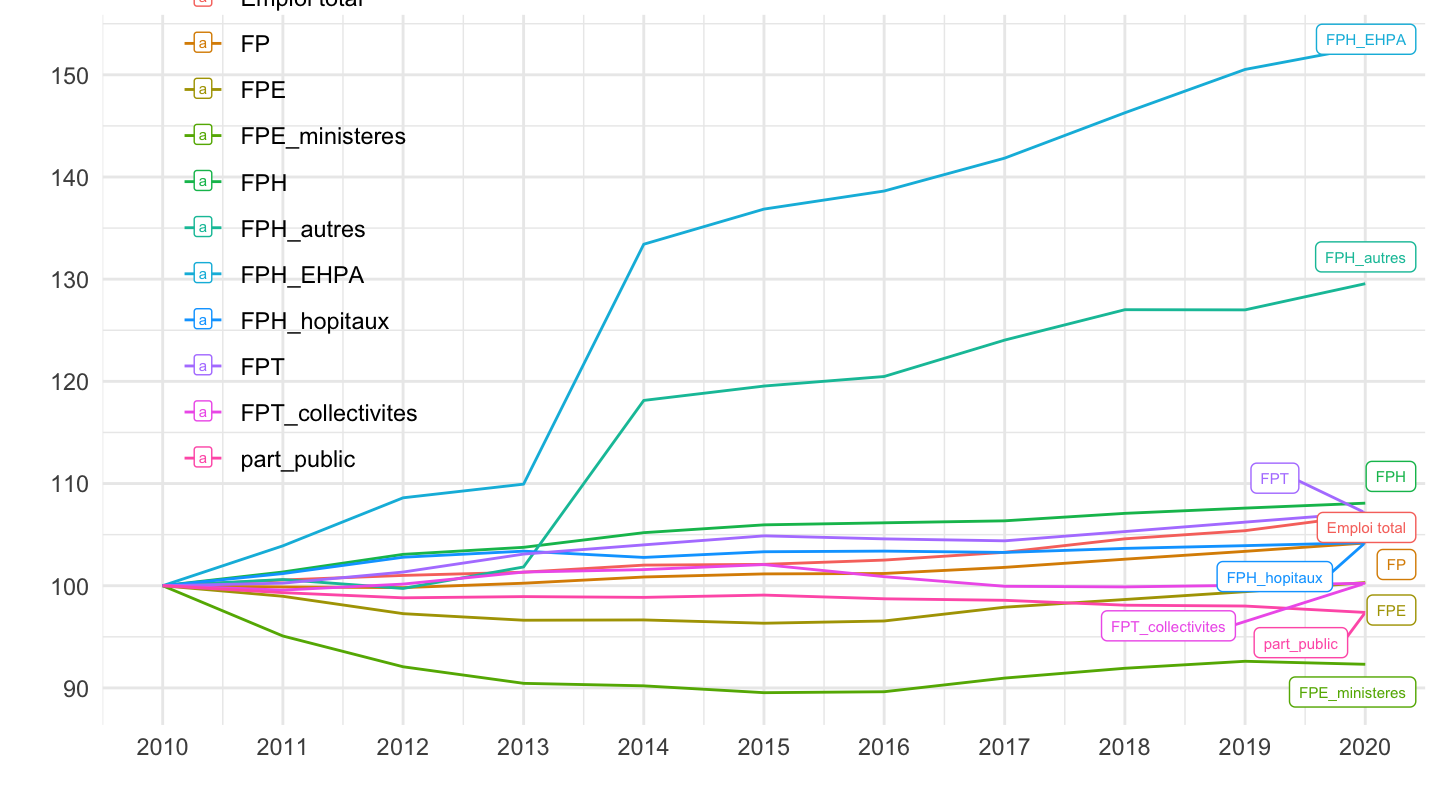
FT12_FPE_FPH_FPT |>
  filter(variable %in% c( "FP", "Emploi total")) |>
  spread(variable, value) |>
  mutate(`Emploi privé` = `Emploi total`*1000 - FP) |>
  gather(variable, value, -date, -year) |>
  group_by(variable) |>
  mutate(date = date) |>
  mutate(value = 100*value/value[1]) |>
  ggplot() + geom_line(aes(x = date, y = value, color = variable)) +
  theme_minimal() + xlab("") + ylab("") +
  scale_x_date(breaks = seq(1997, 2100, 2) |> paste0("-01-01") |> as.Date(),
               labels = date_format("%Y")) +
  scale_y_continuous(breaks = seq(0, 500, 2)) +
  #scale_color_manual(values = viridis(6)[1:5]) +
  theme(legend.position = c(0.3, 0.8),
        legend.title = element_blank())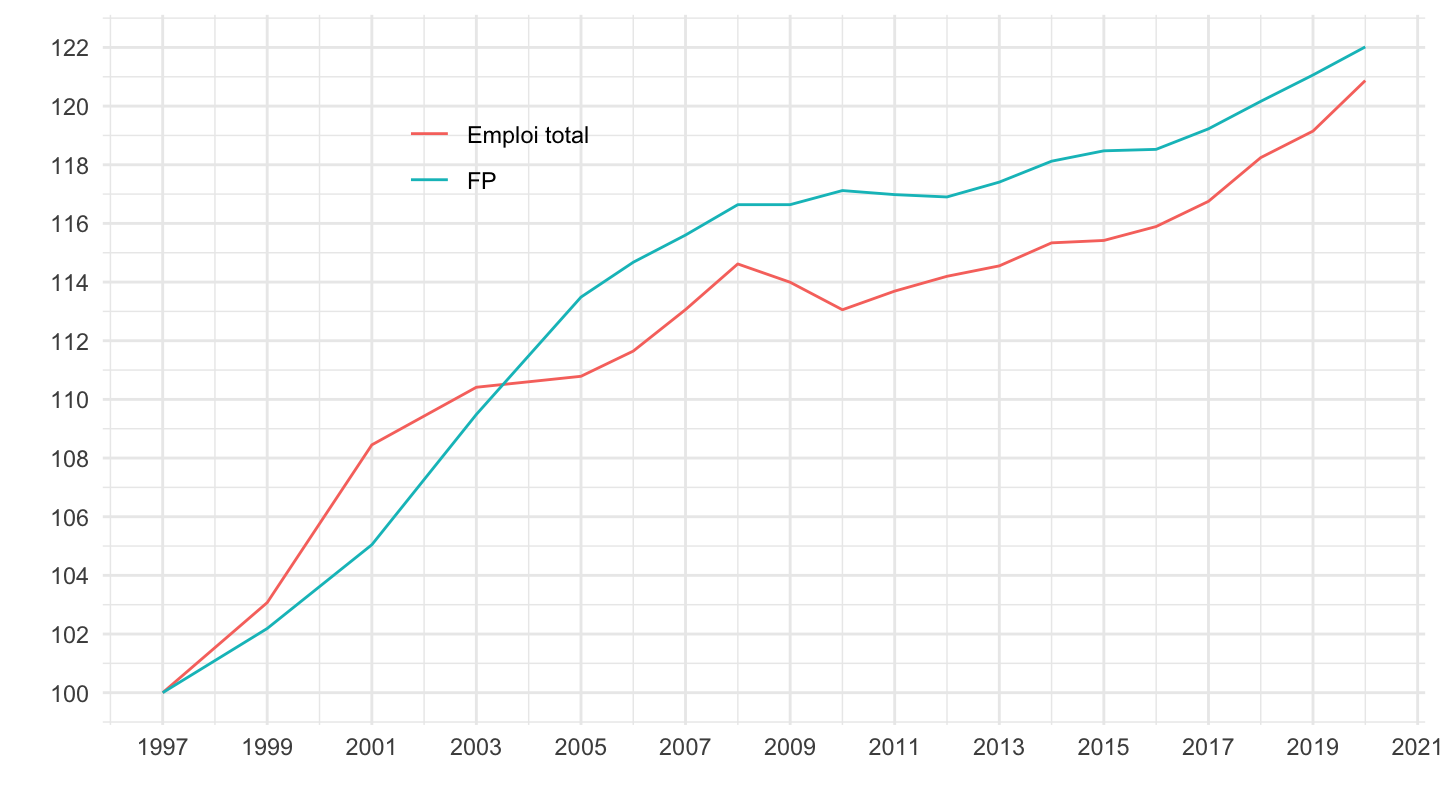
FT12_FPE_FPH_FPT |>
  filter(variable %in% c( "FP", "Emploi total")) |>
  spread(variable, value) |>
  mutate(`Emploi privé` = `Emploi total`*1000 - FP) |>
  gather(variable, value, -date, -year) |>
  group_by(variable) |>
  mutate(date = date) |>
  filter(date >= as.Date("1998-01-01")) |>
  mutate(value = 100*value/value[1]) |>
  ggplot() + geom_line(aes(x = date, y = value, color = variable)) +
  theme_minimal() + xlab("") + ylab("") +
  scale_x_date(breaks = seq(1997, 2100, 2) |> paste0("-01-01") |> as.Date(),
               labels = date_format("%Y")) +
  scale_y_continuous(breaks = seq(0, 500, 2)) +
  #scale_color_manual(values = viridis(6)[1:5]) +
  theme(legend.position = c(0.3, 0.8),
        legend.title = element_blank())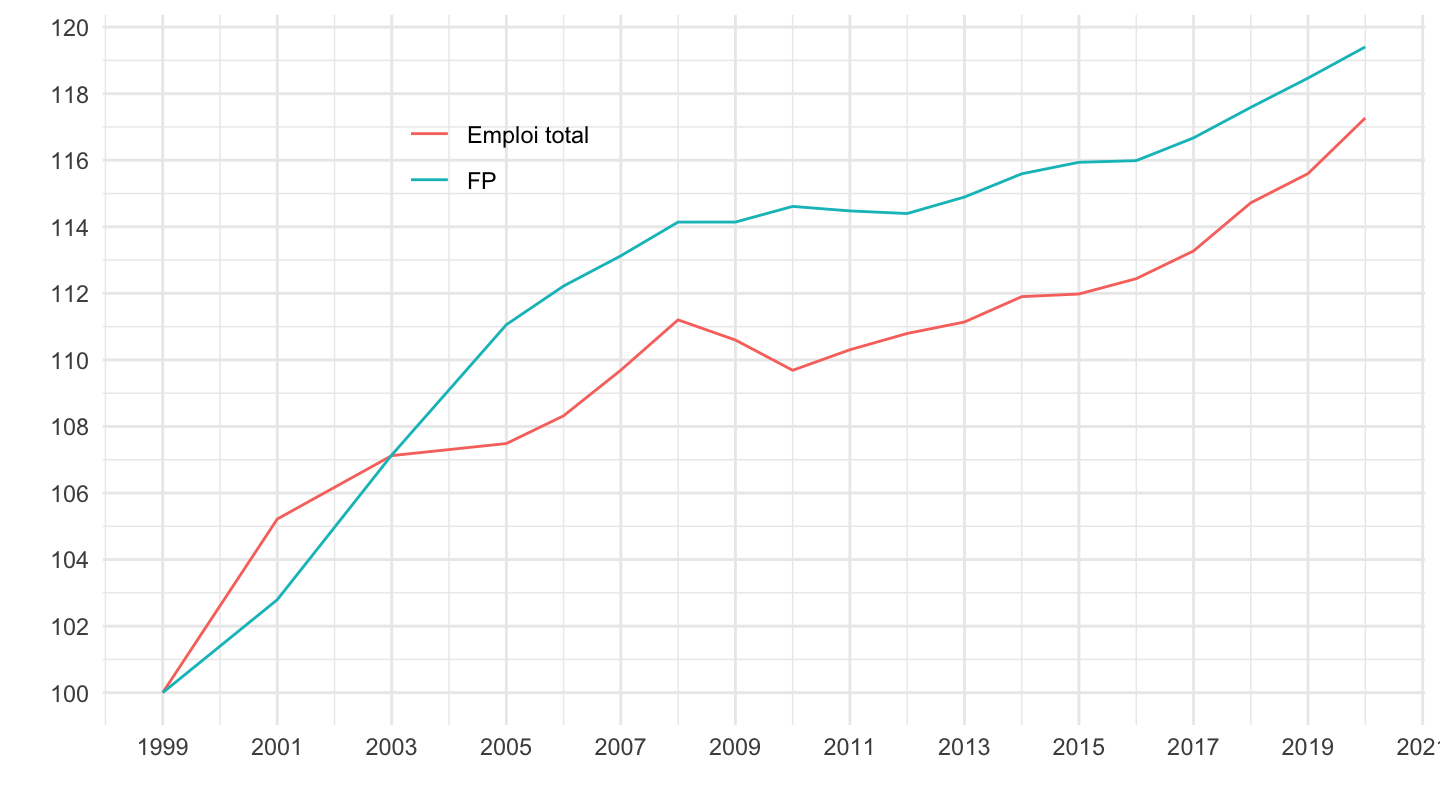
FT12_FPE_FPH_FPT |>
  filter(variable %in% c("FPT", "FPH", "FPE", "FP", "Emploi total")) |>
  group_by(variable) |>
  mutate(date = date) |>
  mutate(value = 100*value/value[1]) |>
  ggplot() + geom_line(aes(x = date, y = value, color = variable)) +
  theme_minimal() + xlab("") + ylab("") +
  scale_x_date(breaks = seq(1997, 2100, 2) |> paste0("-01-01") |> as.Date(),
               labels = date_format("%Y")) +
  scale_y_continuous(breaks = seq(0, 500, 10)) +
  #scale_color_manual(values = viridis(6)[1:5]) +
  theme(legend.position = c(0.3, 0.8),
        legend.title = element_blank())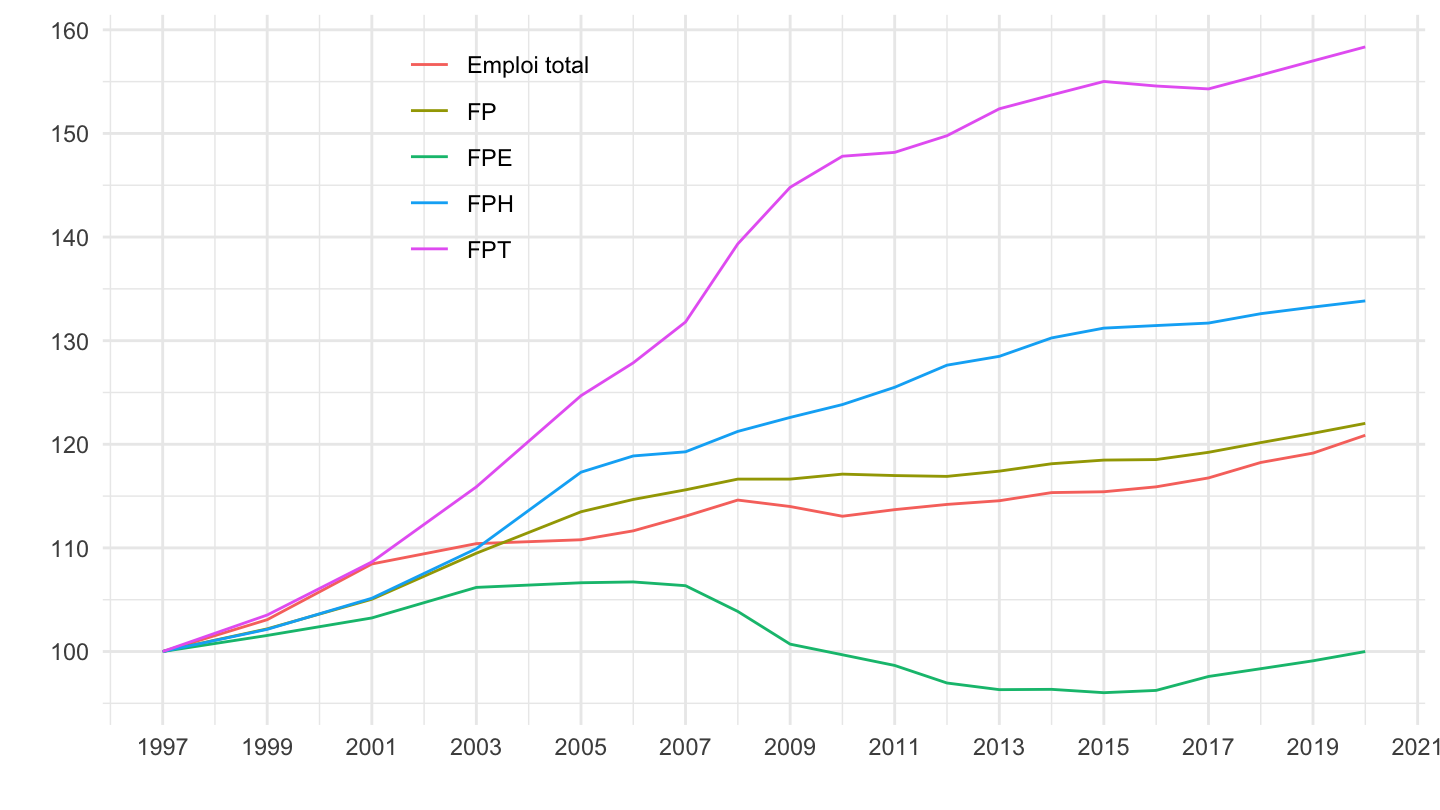
| source | dataset | Title | Updated |
|---|---|---|---|
