Last data update: 18 oct. 2026, 23:12
Last compile: 18 oct. 2026, 23:13
fig3 |>
  filter(collectivite %in% c("Communes", "Départements", "Régions", "Établissements communaux",
                              "Établissements intercommunaux"),
         statut != "Total") |>
  ggplot(aes(x = annee, y = valeur / 1000, fill = statut)) +
  geom_col() +
  facet_wrap(~ collectivite, scales = "free_y") +
  scale_fill_brewer(palette = "Set2", name = NULL) +
  theme_minimal(base_size = 9) +
  labs(x = NULL, y = "Milliers d'agents",
       title = "Effectifs territoriaux par statut et type de collectivité",
       subtitle = "au 31 décembre, 2004-2019") +
  theme(legend.position = "bottom", panel.grid.minor = element_blank())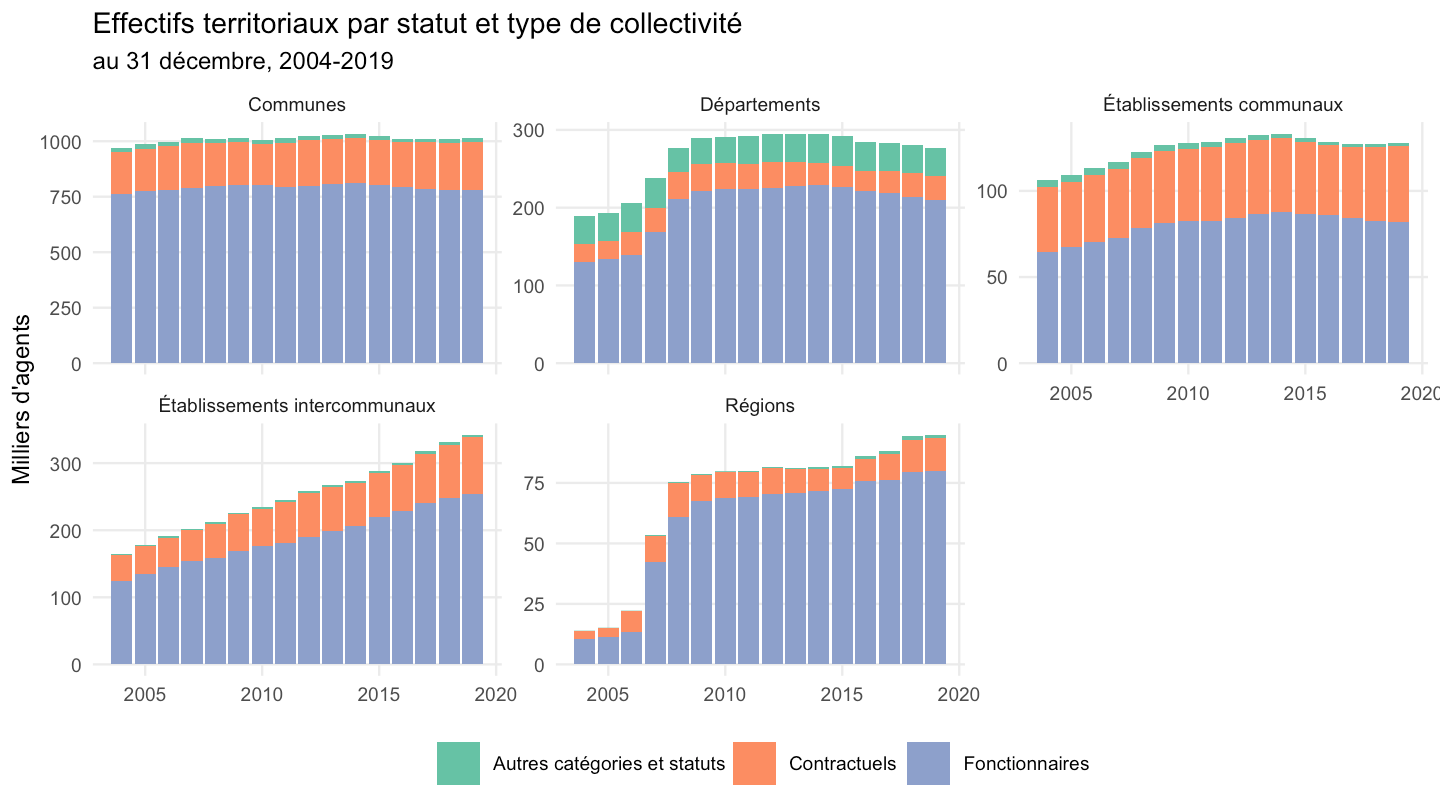
fig3 |>
  filter(collectivite == "Total FPT (collectivités locales + EPA locaux)", statut == "Total") |>
  ggplot(aes(x = annee, y = valeur / 1000)) +
  geom_line(linewidth = 1, color = "#1B3F8B") +
  theme_minimal(base_size = 12) +
  labs(x = NULL, y = "Millions d'agents",
       title = "Effectifs totaux de la fonction publique territoriale",
       subtitle = "collectivités locales et EPA locaux, 2004-2019") +
  theme(panel.grid.minor = element_blank())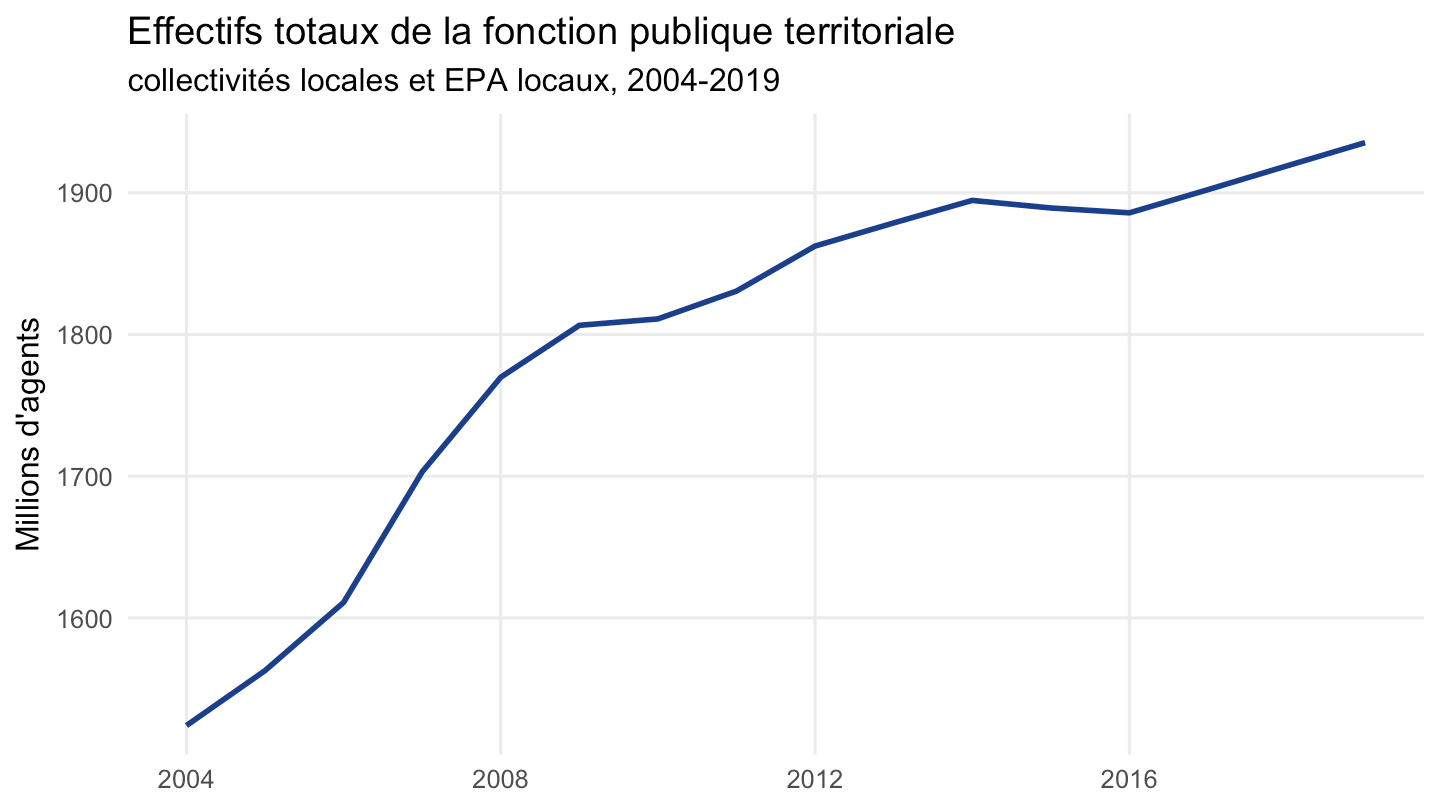
fig5 |>
  filter(indicateur %in% c("Communes", "EPCI à fiscalité propre", "Départements", "Régions")) |>
  ggplot(aes(x = annee, y = valeur / 1000, color = indicateur)) +
  geom_line(linewidth = 1) +
  scale_color_brewer(palette = "Set1", name = NULL) +
  theme_minimal(base_size = 11) +
  labs(x = NULL, y = "Milliers d'agents",
       title = "Effectifs de la fonction publique territoriale",
       subtitle = "par catégorie d'employeur, au 31 décembre, 2011-2019") +
  theme(legend.position = "bottom", panel.grid.minor = element_blank())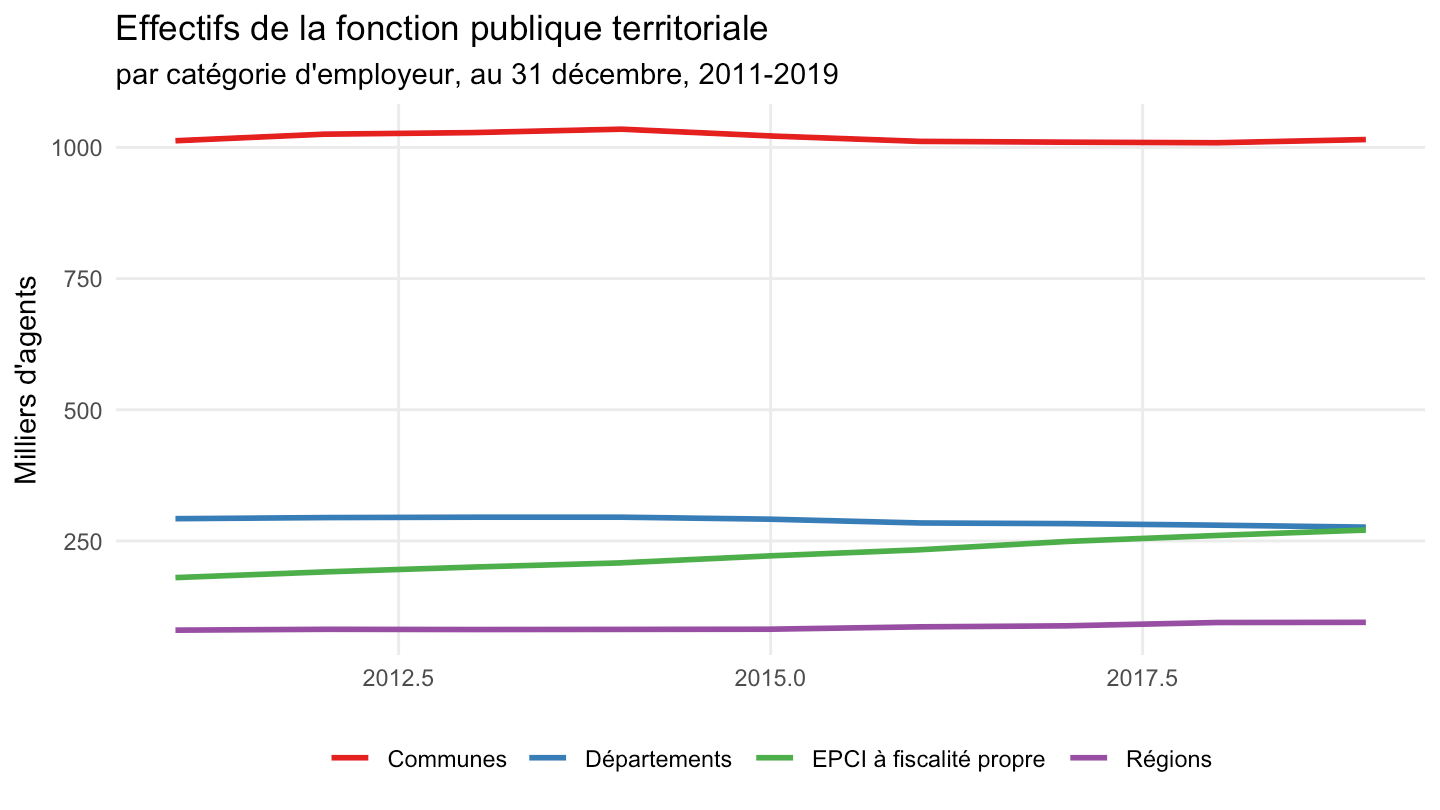
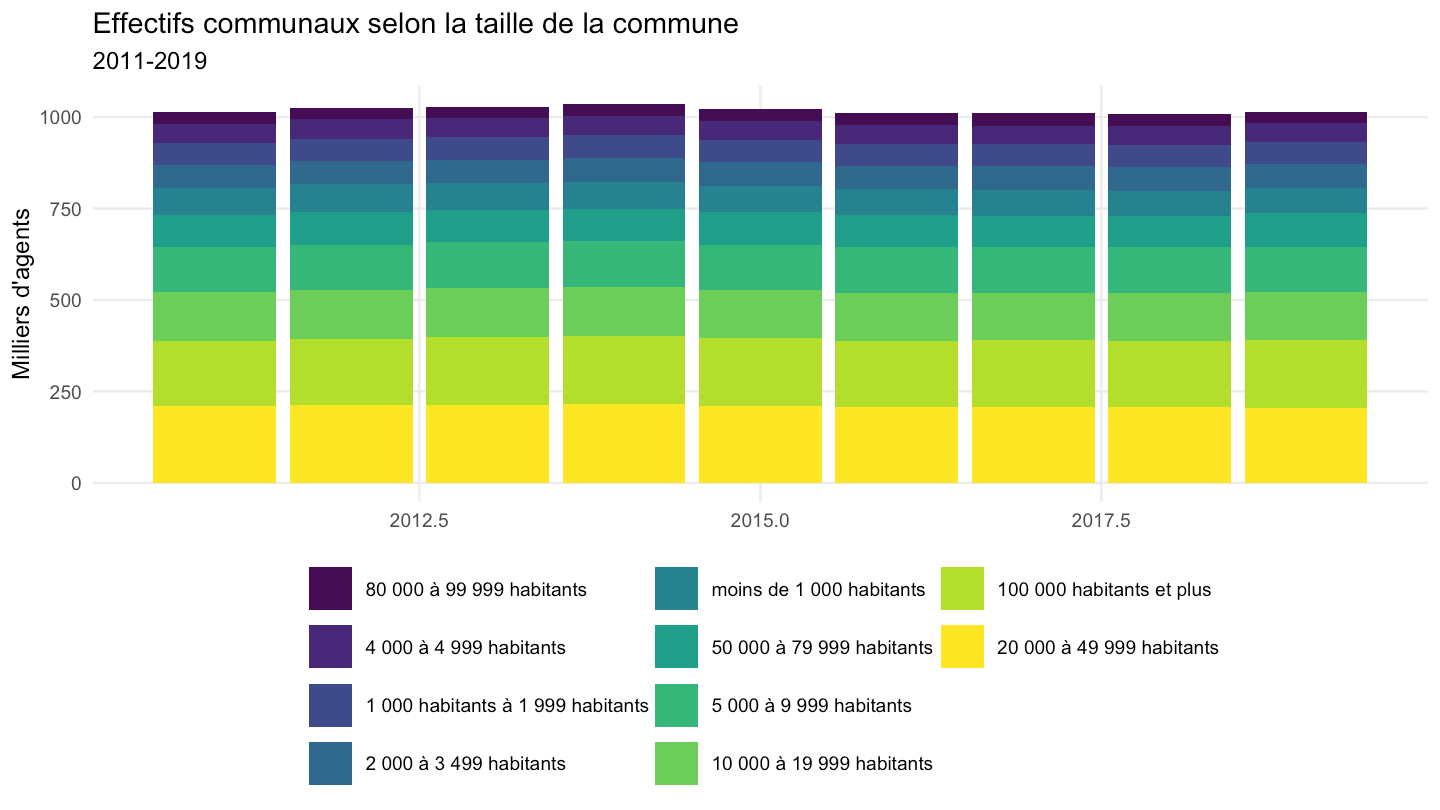
fig5 |>
  filter(str_starts(indicateur, "Communes de")) |>
  mutate(indicateur = str_remove(indicateur, "Communes de |habitants"),
         indicateur = fct_reorder(indicateur, valeur, .fun = max)) |>
  ggplot(aes(x = annee, y = valeur / 1000, fill = indicateur)) +
  geom_col() +
  scale_fill_viridis_d(name = NULL) +
  theme_minimal(base_size = 9) +
  labs(x = NULL, y = "Milliers d'agents",
       title = "Effectifs communaux selon la taille de la commune",
       subtitle = "2011-2019") +
  theme(legend.position = "bottom", panel.grid.minor = element_blank()) +
  guides(fill = guide_legend(ncol = 3))