Last data update: 19 oct. 2026, 23:28
Last compile: 19 oct. 2026, 23:28
Source : DGAC, data.gouv.fr. Trafic réalisé en France par transporteur depuis 2010. Les transporteurs de moins de 10 000 passagers par mois sont agrégés (français / étrangers). CIE_PKT : milliards de passagers-kilomètres.
`trafic-aerien-compagnies` |>
  filter(year(date) == 2025) |>
  group_by(CIE_NOM, CIE_NAT) |>
  summarise(pax = sum(CIE_PAX, na.rm = TRUE) / 1e6, .groups = "drop") |>
  slice_max(pax, n = 15) |>
  mutate(CIE_NOM = fct_reorder(str_to_title(CIE_NOM), pax),
         Pavillon = ifelse(CIE_NAT == "F", "Français", "Étranger")) |>
  ggplot(aes(x = CIE_NOM, y = pax, fill = Pavillon)) +
  geom_col() + coord_flip() + theme_minimal() +
  xlab("") + ylab("Millions de passagers (France)") +
  scale_fill_manual(values = c("#2166ac", "#e08214")) +
  theme(legend.position = "bottom", legend.title = element_blank())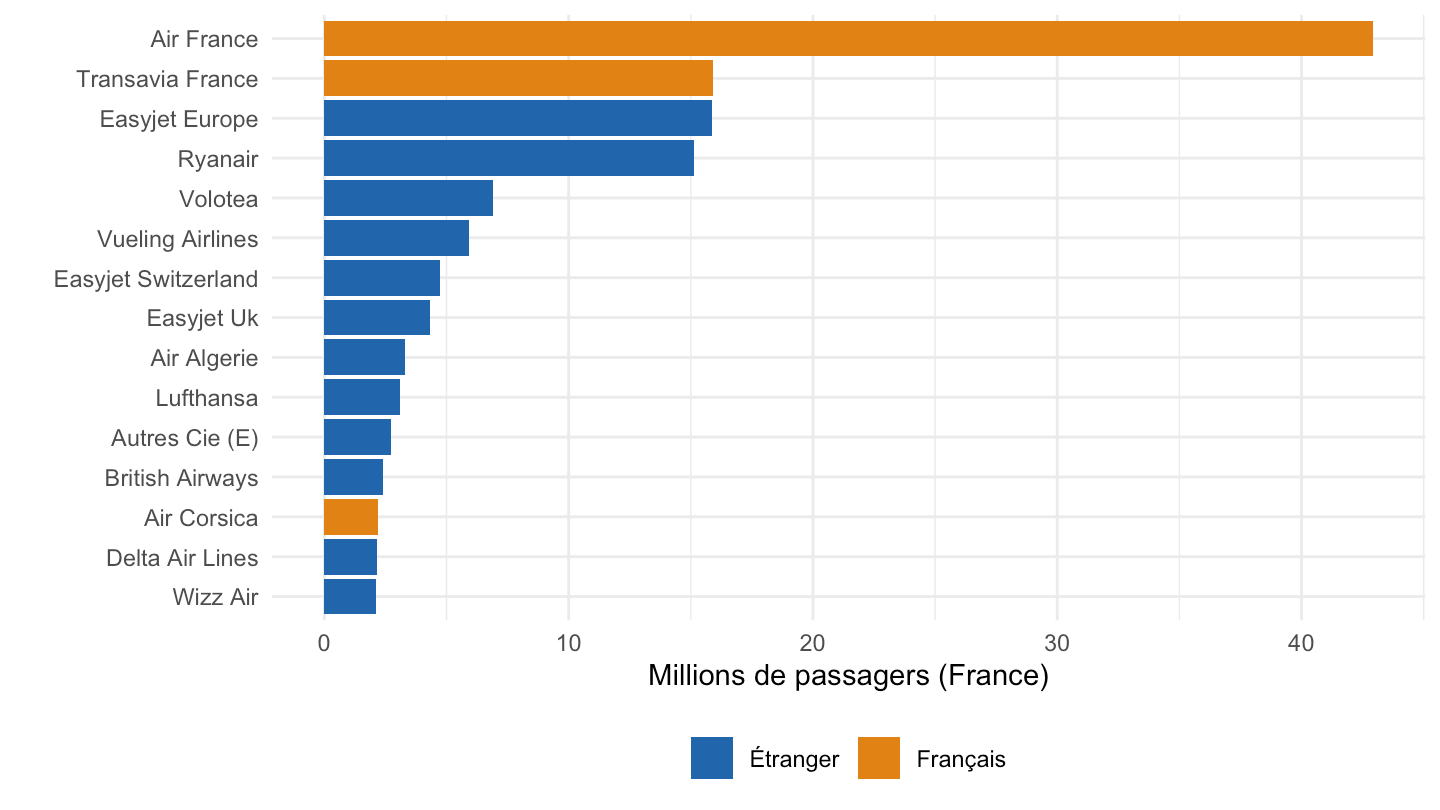
principales <- c("AIR FRANCE", "TRANSAVIA FRANCE", "EASYJET EUROPE", "RYANAIR", "VOLOTEA", "VUELING AIRLINES")
`trafic-aerien-compagnies` |>
  filter(CIE_NOM %in% principales) |>
  mutate(annee = year(date)) |>
  group_by(annee, CIE_NOM) |>
  summarise(pax = sum(CIE_PAX, na.rm = TRUE) / 1e6, .groups = "drop") |>
  mutate(date = as.Date(paste0(annee, "-01-01")), CIE_NOM = str_to_title(CIE_NOM)) |>
  ggplot(aes(x = date, y = pax, color = CIE_NOM)) +
  geom_line() + geom_point(size = 0.8) + theme_minimal() +
  xlab("") + ylab("Millions de passagers (France)") +
  scale_x_date(date_breaks = "2 years", labels = date_format("%Y")) +
  theme(legend.position = "bottom", legend.title = element_blank())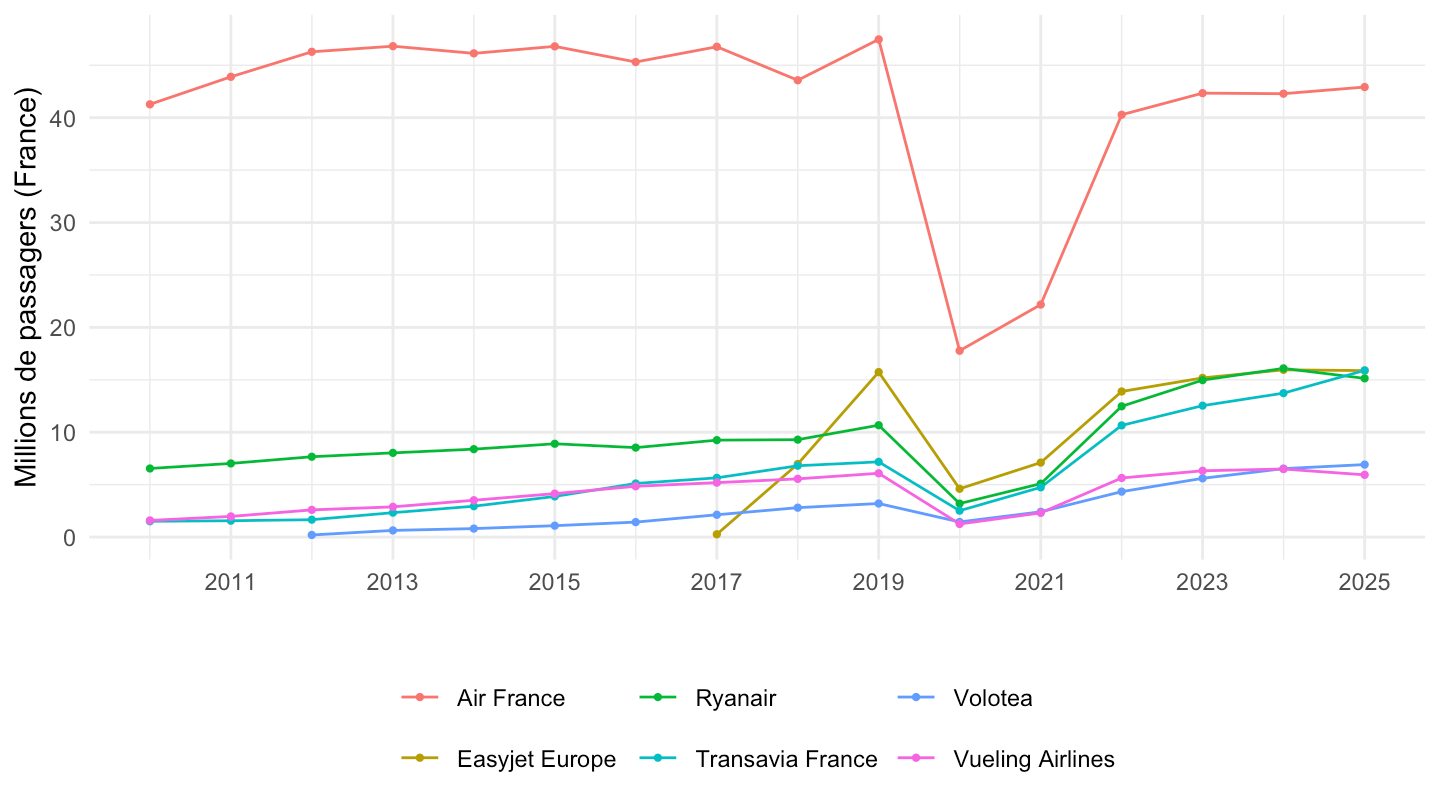
`trafic-aerien-compagnies` |>
  mutate(annee = year(date)) |>
  group_by(annee) |>
  summarise(part = sum(CIE_PAX[CIE_NAT == "F"], na.rm = TRUE) / sum(CIE_PAX, na.rm = TRUE)) |>
  mutate(date = as.Date(paste0(annee, "-01-01"))) |>
  ggplot(aes(x = date, y = part)) +
  geom_line() + geom_point() + theme_minimal() + xlab("") +
  ylab("Part des passagers transportés par des compagnies françaises") +
  scale_x_date(date_breaks = "2 years", labels = date_format("%Y")) +
  scale_y_continuous(labels = percent_format(accuracy = 1), limits = c(0, NA))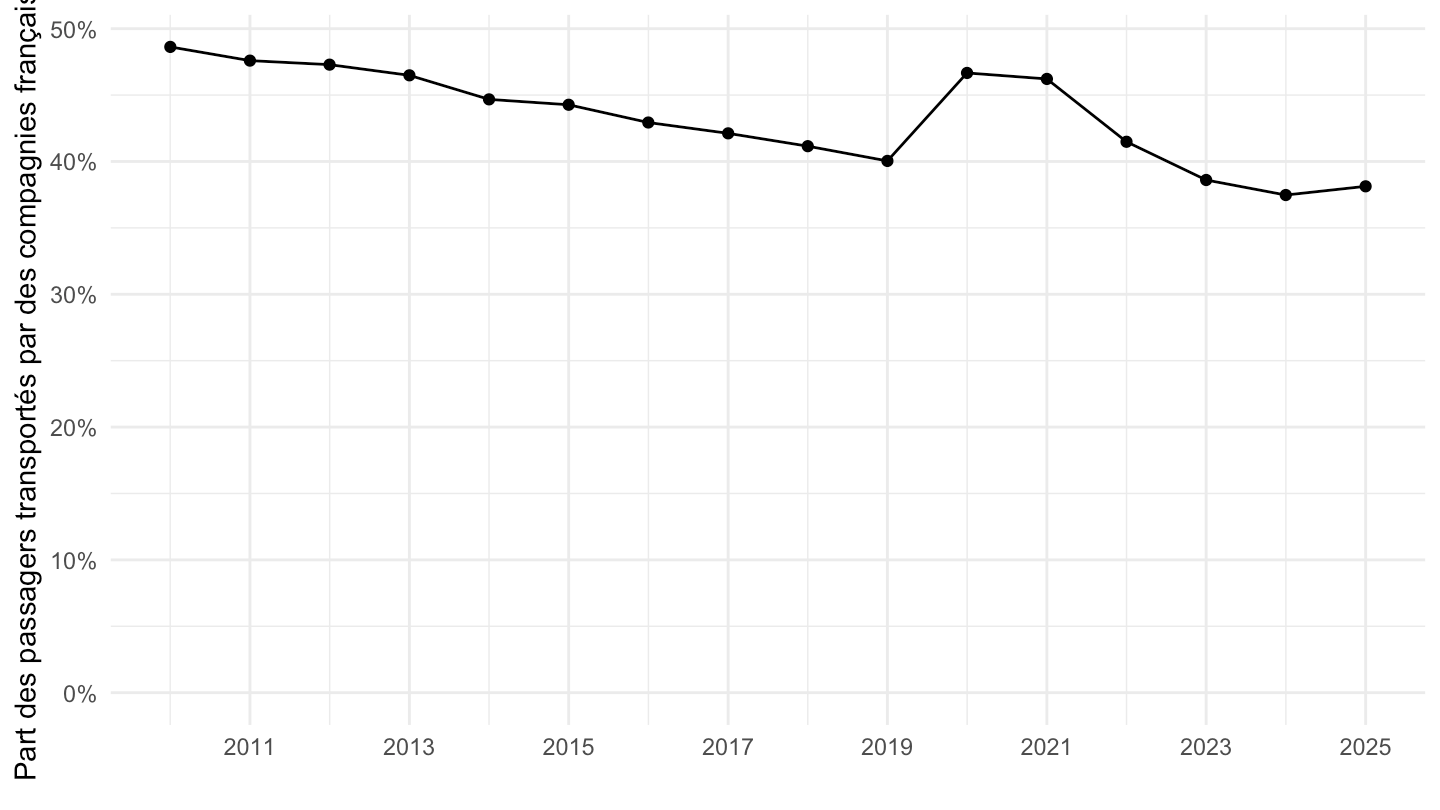
`trafic-aerien-compagnies` |>
  filter(year(date) == 2025, CIE_NAT == "E") |>
  group_by(CIE_PAYS) |>
  summarise(pax = sum(CIE_PAX, na.rm = TRUE) / 1e6) |>
  slice_max(pax, n = 15) |>
  mutate(CIE_PAYS = fct_reorder(str_to_title(CIE_PAYS), pax)) |>
  ggplot(aes(x = CIE_PAYS, y = pax)) +
  geom_col(fill = "#e08214") + coord_flip() + theme_minimal() +
  xlab("") + ylab("Millions de passagers (France)")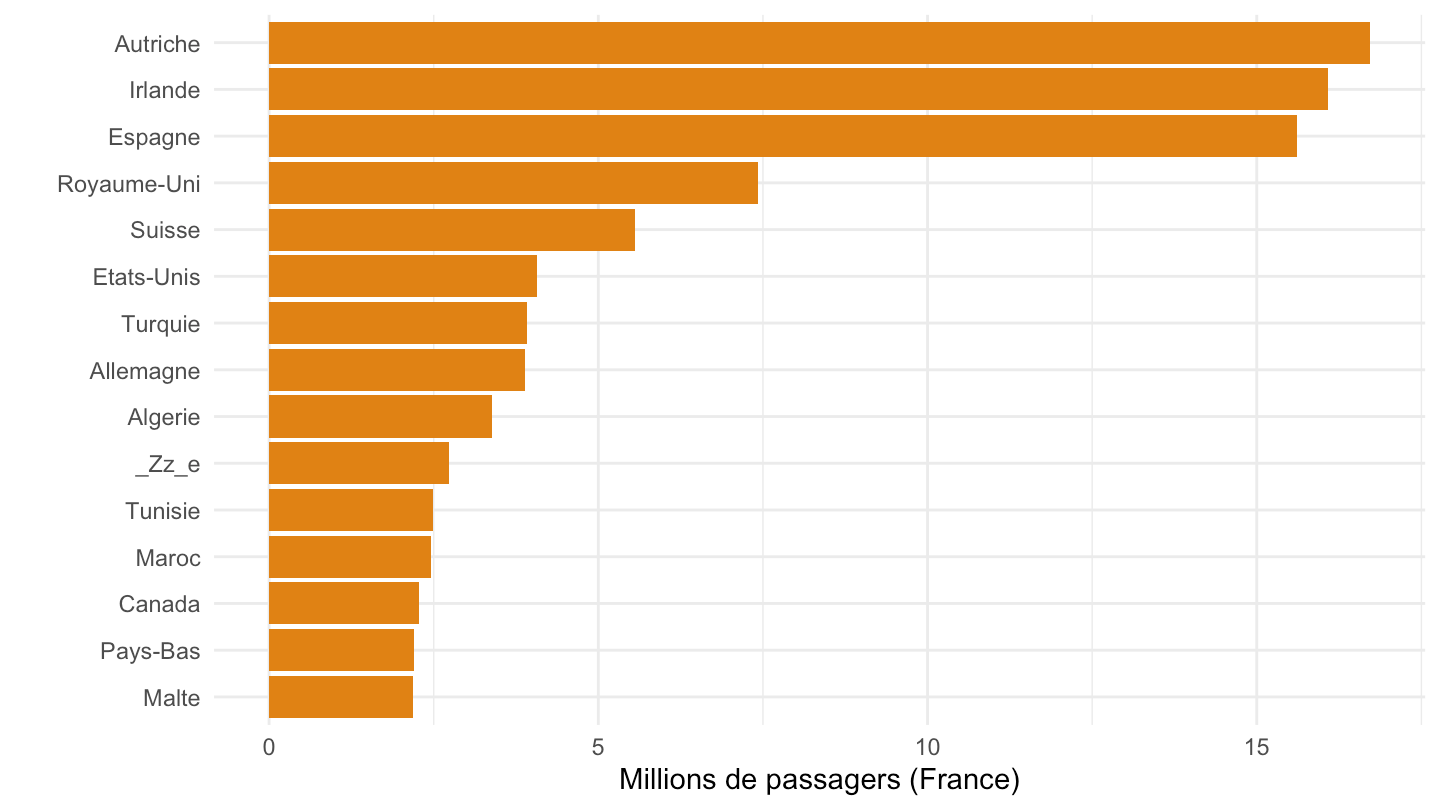
`trafic-aerien-compagnies` |>
  filter(CIE_NOM %in% principales) |>
  mutate(annee = year(date)) |>
  group_by(annee, CIE_NOM) |>
  summarise(pkt = sum(CIE_PKT, na.rm = TRUE), .groups = "drop") |>
  mutate(date = as.Date(paste0(annee, "-01-01")), CIE_NOM = str_to_title(CIE_NOM)) |>
  ggplot(aes(x = date, y = pkt, color = CIE_NOM)) +
  geom_line() + theme_minimal() + xlab("") + ylab("Milliards de passagers-km") +
  scale_x_date(date_breaks = "2 years", labels = date_format("%Y")) +
  theme(legend.position = "bottom", legend.title = element_blank())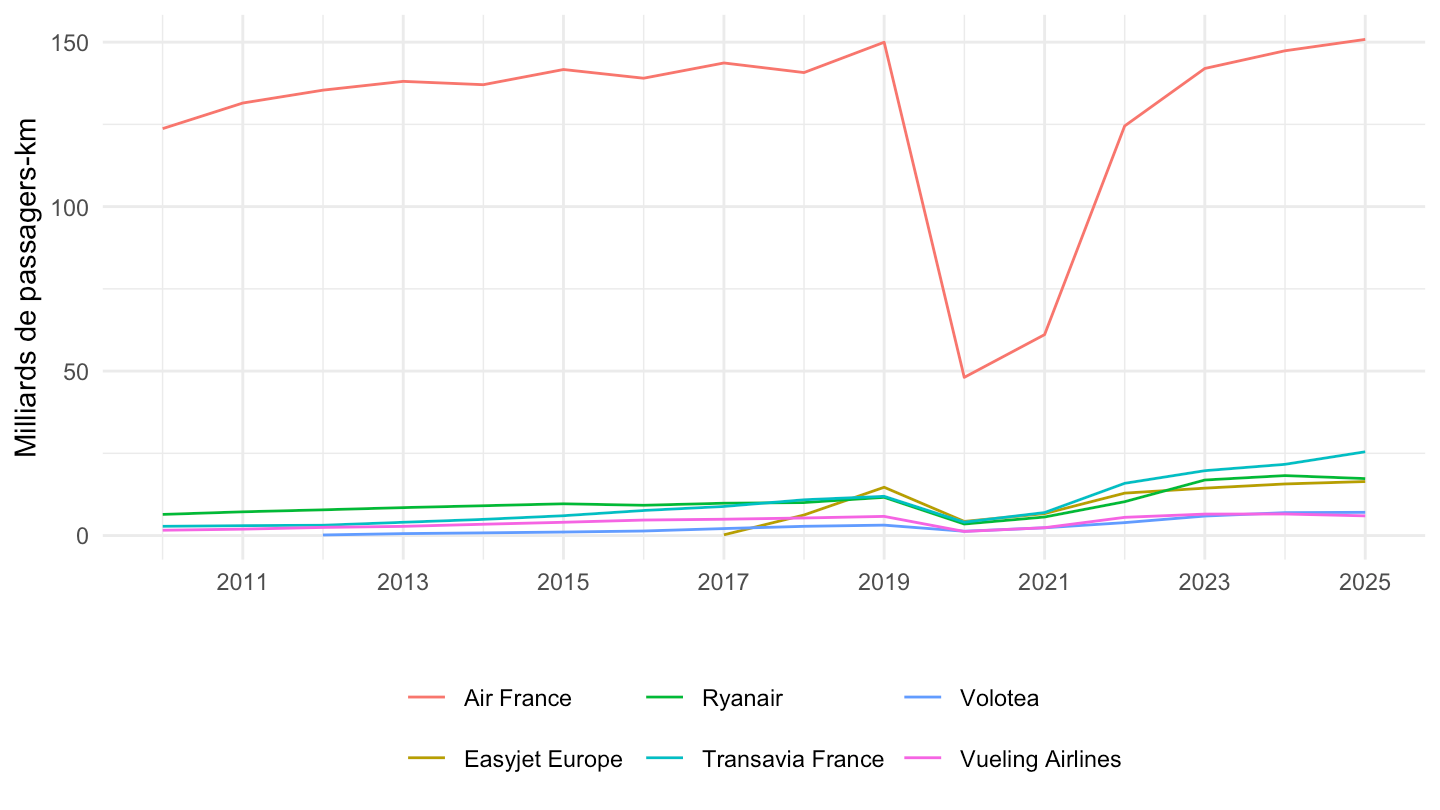
`trafic-aerien-compagnies` |>
  filter(CIE_NOM %in% principales) |>
  mutate(annee = year(date)) |>
  group_by(annee, CIE_NOM) |>
  summarise(km = sum(CIE_PKT, na.rm = TRUE) * 1e9 / sum(CIE_PAX, na.rm = TRUE), .groups = "drop") |>
  mutate(date = as.Date(paste0(annee, "-01-01")), CIE_NOM = str_to_title(CIE_NOM)) |>
  ggplot(aes(x = date, y = km, color = CIE_NOM)) +
  geom_line() + theme_minimal() + xlab("") + ylab("km par passager") +
  scale_x_date(date_breaks = "2 years", labels = date_format("%Y")) +
  scale_y_continuous(labels = fr) +
  theme(legend.position = "bottom", legend.title = element_blank())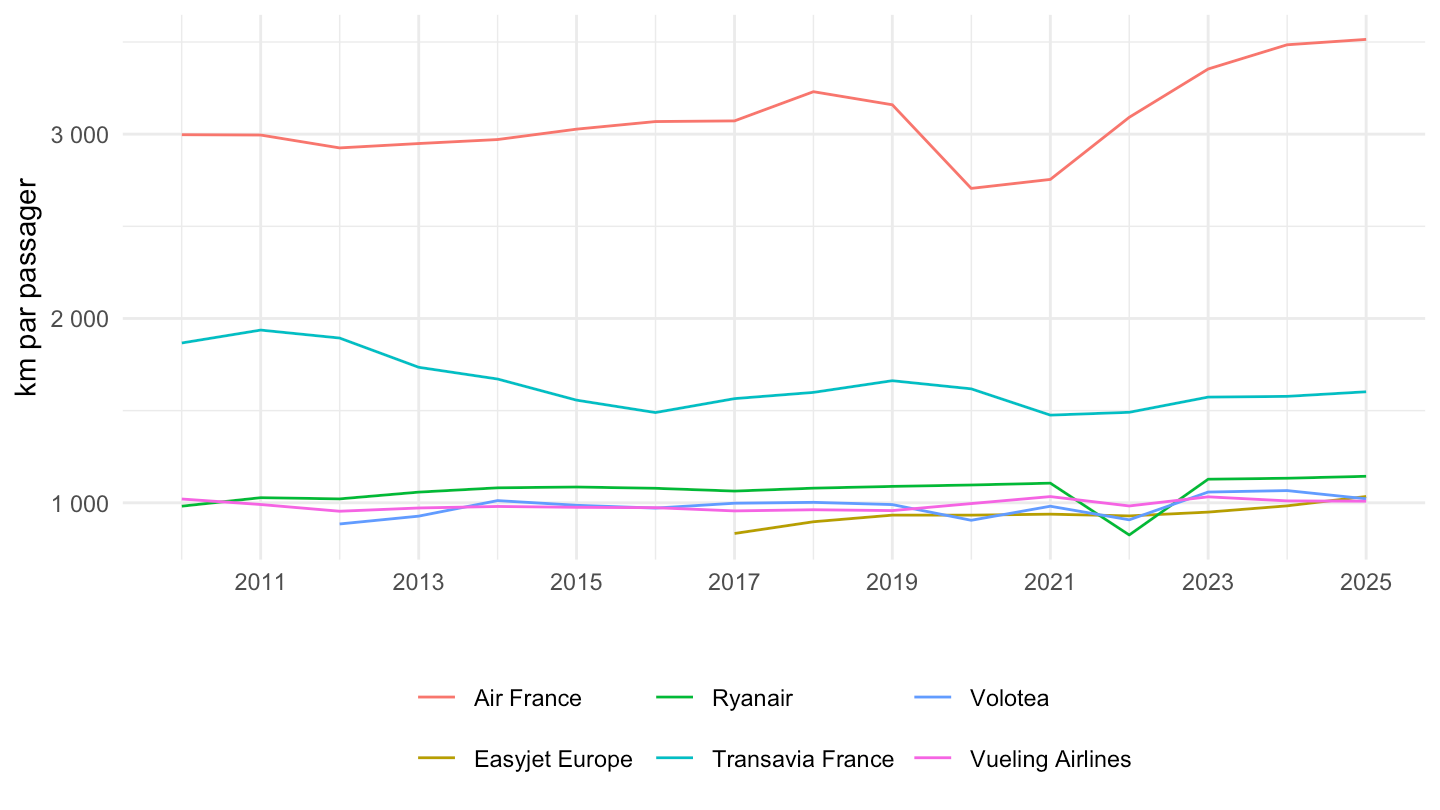
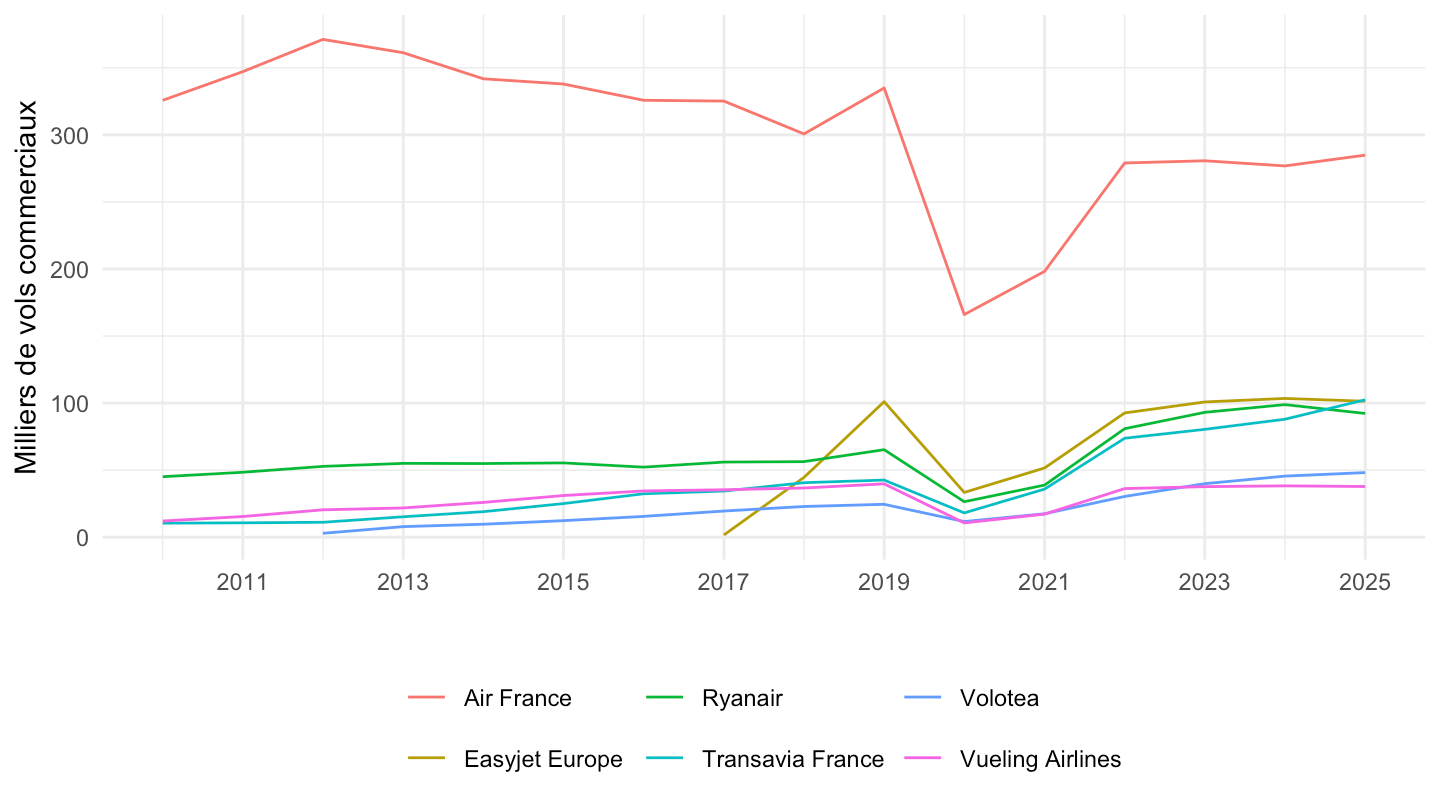
`trafic-aerien-compagnies` |>
  filter(CIE_NOM %in% principales) |>
  mutate(annee = year(date)) |>
  group_by(annee, CIE_NOM) |>
  summarise(vols = sum(CIE_VOL, na.rm = TRUE) / 1e3, .groups = "drop") |>
  mutate(date = as.Date(paste0(annee, "-01-01")), CIE_NOM = str_to_title(CIE_NOM)) |>
  ggplot(aes(x = date, y = vols, color = CIE_NOM)) +
  geom_line() + theme_minimal() + xlab("") + ylab("Milliers de vols commerciaux") +
  scale_x_date(date_breaks = "2 years", labels = date_format("%Y")) +
  theme(legend.position = "bottom", legend.title = element_blank())