Last data update: 10 oct. 2026, 07:41
Last compile: 11 oct. 2026, 07:26
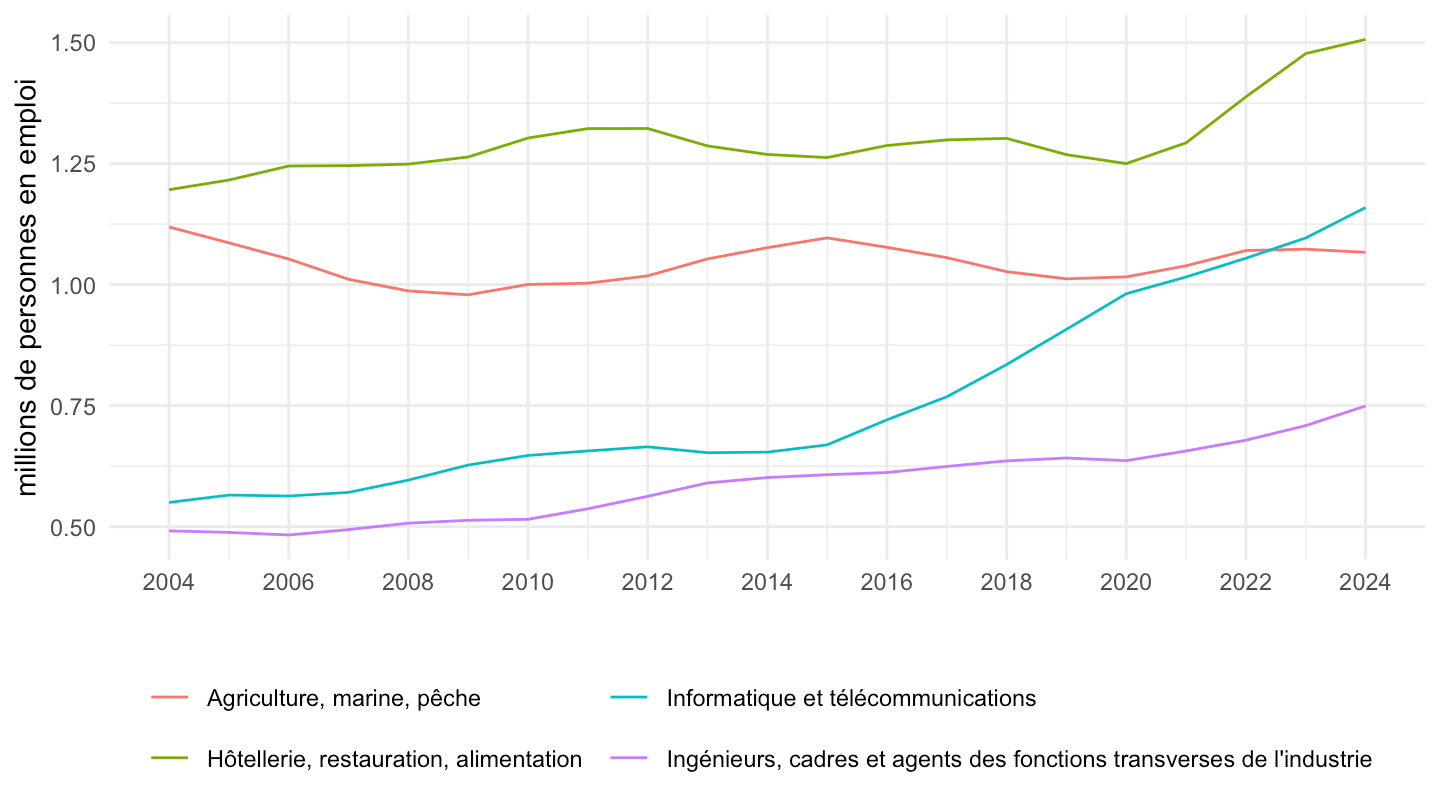
`portraits-statistiques-des-metiers` |>
  filter(code_fap %in% c("A", "H", "M", "S")) |>
  ggplot(aes(x = date, y = effectif / 1e6, color = libelle)) +
  geom_line() +
  theme_minimal() + xlab("") + ylab("millions de personnes en emploi") +
  scale_x_date(date_breaks = "2 years", labels = date_format("%Y")) +
  theme(legend.position = "bottom", legend.title = element_blank()) +
  guides(color = guide_legend(nrow = 2))