Last observation: 2025 (N = 102)
First observation: 2004 (N = 57)
Last data update: 20 sept. 2026, 19:43
Last compile: 10 oct. 2026, 07:46
`le-contrat-de-professionnalisation` |>
  filter(Variable %in% c("Industrie", "Construction", "Tertiaire")) |>
  ggplot() + geom_line(aes(x = date, y = value/100, color = Variable)) +
  theme_minimal() + xlab("") + ylab("") +
  scale_x_date(date_breaks = "2 years", labels = date_format("%Y")) +
  scale_y_continuous(labels = percent_format(accuracy = 1)) +
  scale_color_manual(values = viridis(4)[1:3]) +
  theme(legend.position = c(0.5, 0.8), legend.title = element_blank(),
        axis.text.x = element_text(angle = 45, vjust = 1, hjust = 1))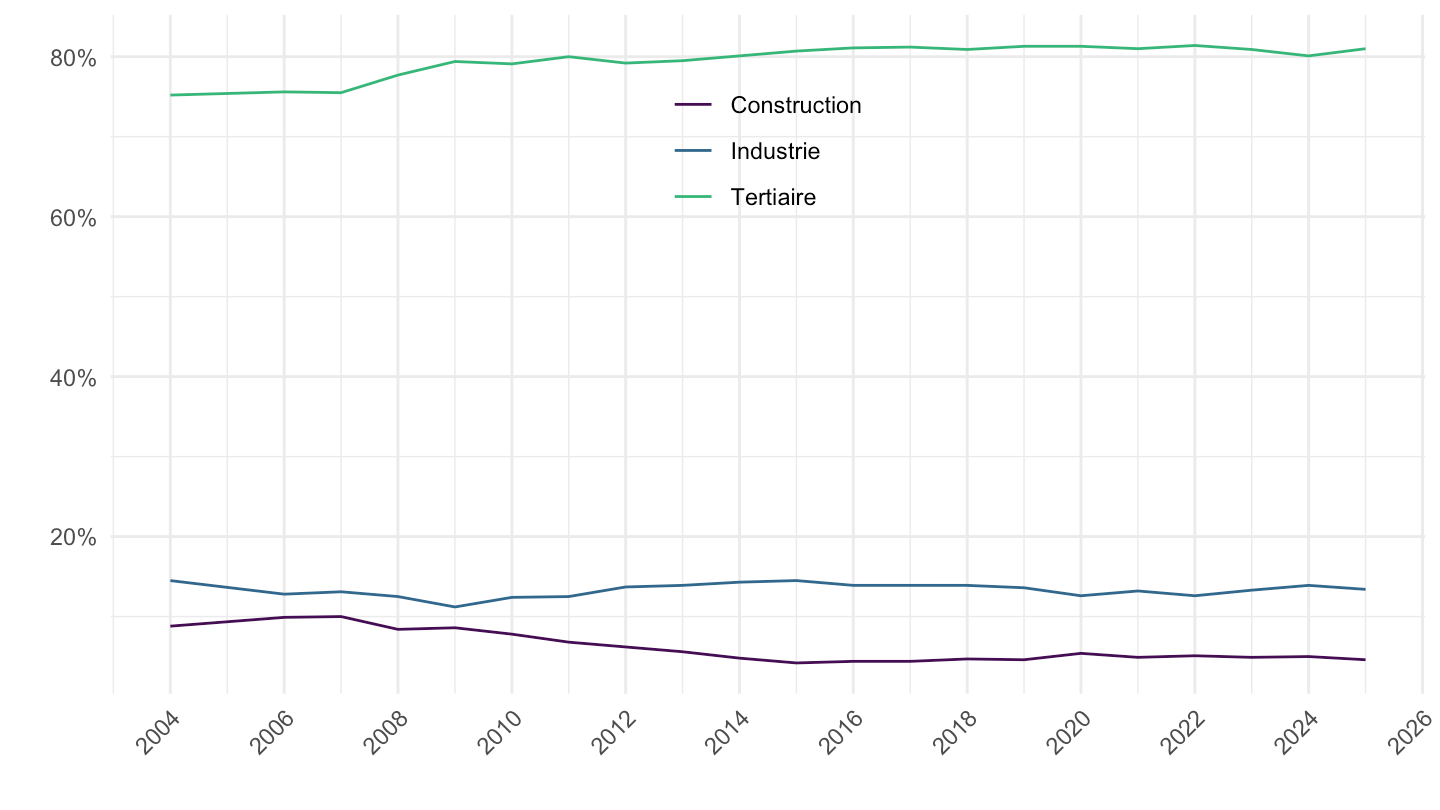
`le-contrat-de-professionnalisation` |>
  filter(Variable %in% c("Homme", "Femme")) |>
  ggplot() + geom_line(aes(x = date, y = value/100, color = Variable)) +
  theme_minimal() + xlab("") + ylab("") +
  scale_x_date(date_breaks = "2 years", labels = date_format("%Y")) +
  scale_y_continuous(labels = percent_format(accuracy = 1)) +
  theme(legend.position = c(0.5, 0.7), legend.title = element_blank(),
        axis.text.x = element_text(angle = 45, vjust = 1, hjust = 1))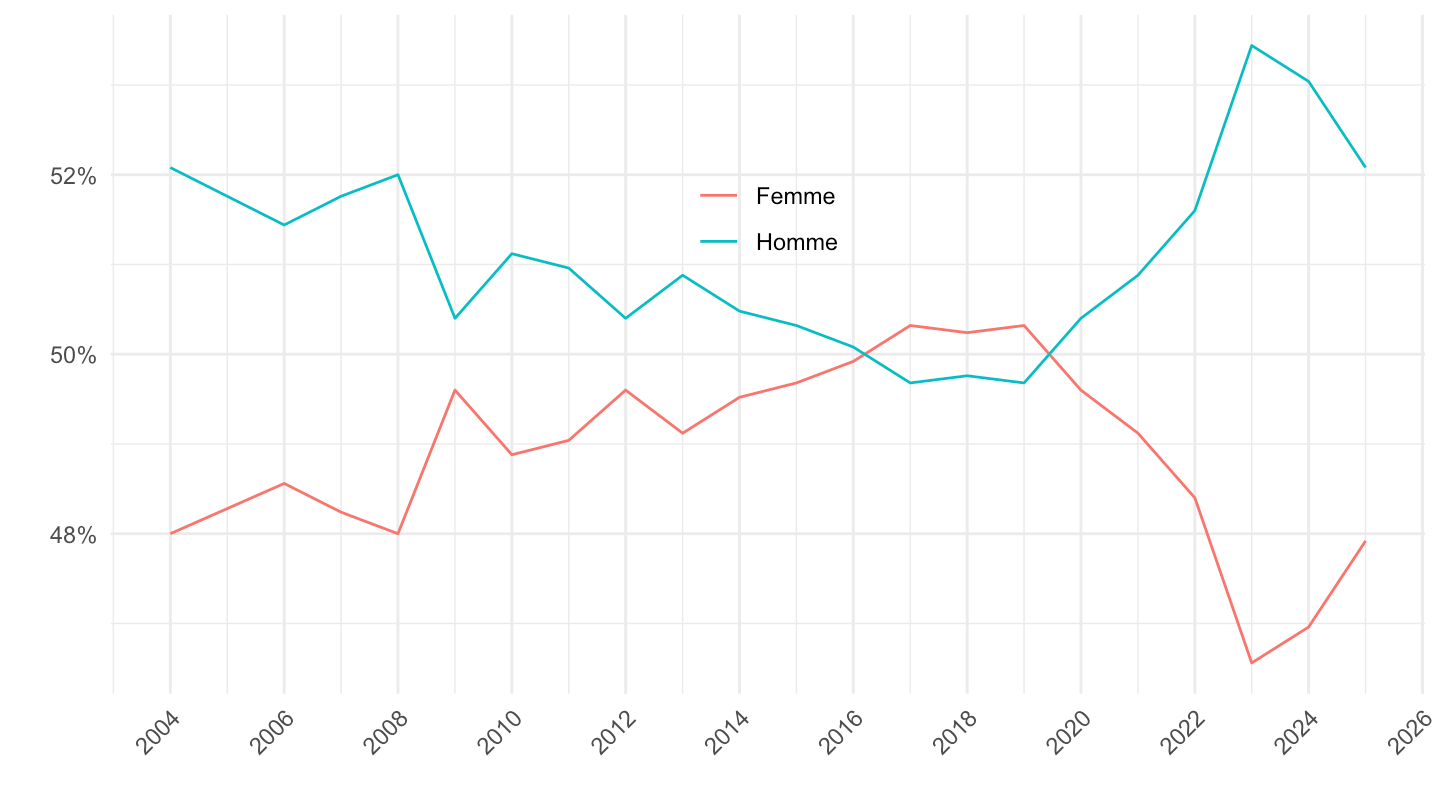
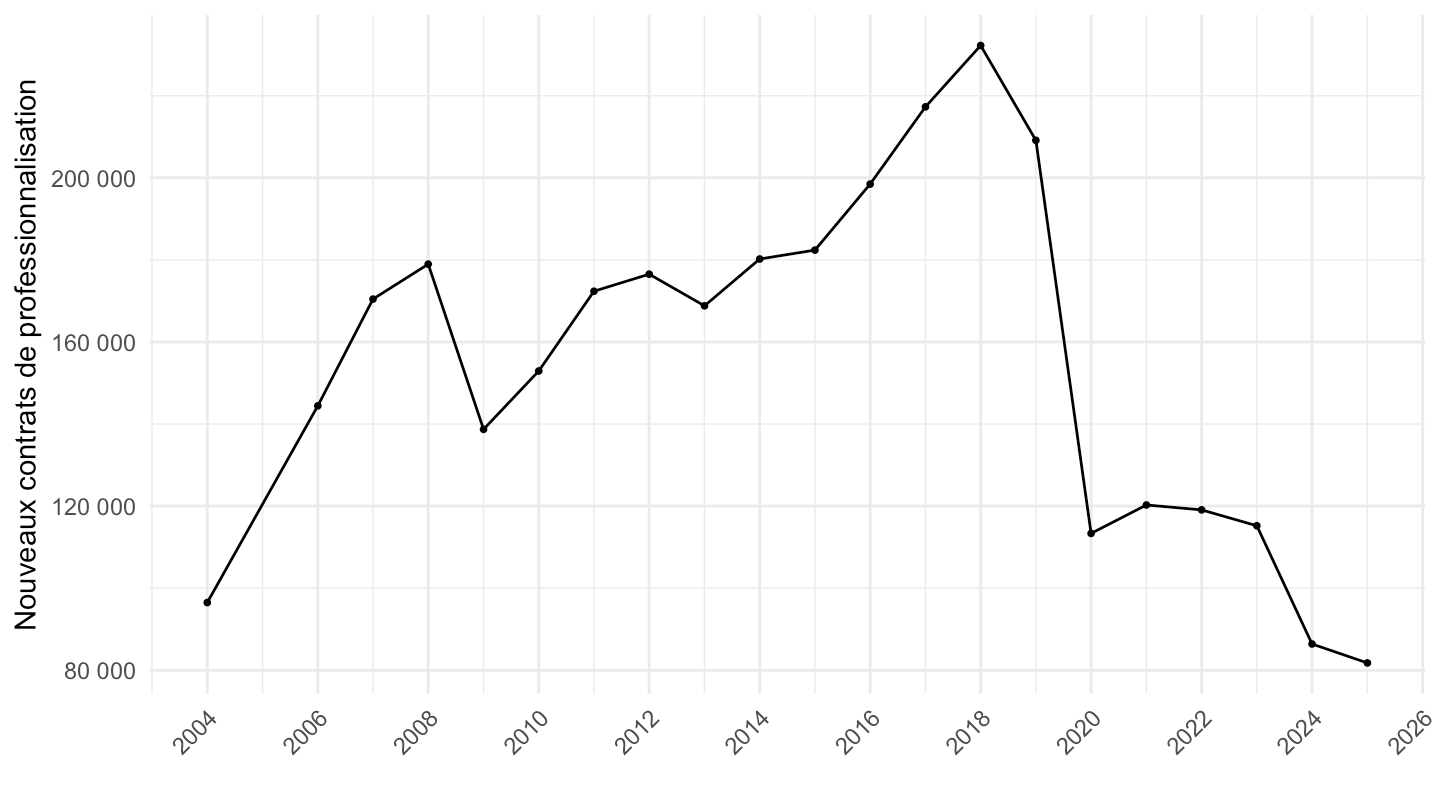
`le-contrat-de-professionnalisation` |>
  filter(Variable == "Flux de nouveaux contrats") |>
  ggplot() + geom_line(aes(x = date, y = value)) +
  geom_point(aes(x = date, y = value), size = 0.7) +
  theme_minimal() + xlab("") + ylab("Nouveaux contrats de professionnalisation") +
  scale_x_date(date_breaks = "2 years", labels = date_format("%Y")) +
  scale_y_continuous(labels = label_number(big.mark = " ")) +
  theme(axis.text.x = element_text(angle = 45, vjust = 1, hjust = 1))