Résultats de synthèse — dépenses de l’assurance maladie (juillet 2026)

Données - Assurance Maladie (Cnam)

Code
source(here::here("_rinit.R"))
invisible(Sys.setlocale("LC_TIME", "fr_FR.UTF-8"))
# cd ~/iCloud/website/data/cnam; /usr/local/bin/R -e 'quarto::quarto_render("resultats_synthese.qmd")'
# (données : Rscript --vanilla cnam.R)

knitr::opts_chunk$set(echo = TRUE, message = FALSE, warning = FALSE,
                      fig.width = 9, fig.height = 5.5, dpi = 150)
library(dplyr); library(tidyr); library(ggplot2); library(stringr)

path <- here::here("data", "cnam", "resultats_synthese.parquet")
d <- arrow::read_parquet(path)

mdd <- scales::label_number(scale = 1e-9, suffix = " Md€", accuracy = 0.1, big.mark = " ", decimal.mark = ",")
mde <- scales::label_number(scale = 1e-6, suffix = " M€", accuracy = 1, big.mark = " ", decimal.mark = ",")
pct <- scales::label_percent(accuracy = 0.1, decimal.mark = ",")
nb  <- scales::label_number(big.mark = " ", decimal.mark = ",")

theme_cnam <- theme_minimal(base_size = 12) +
  theme(plot.title = element_text(face = "bold", size = 13), plot.title.position = "plot",
        plot.subtitle = element_text(colour = "grey35"),
        panel.grid.minor = element_blank(), legend.position = "bottom")
col1 <- "#1b7f79"; col2 <- "#c0392b"

# barres horizontales triées
barh <- function(df, lab, val, fmt = mdd, fill = col1, ...) {
  df |>
    mutate(.l = forcats::fct_reorder({{ lab }}, {{ val }})) |>
    ggplot(aes(.l, {{ val }})) +
    geom_col(fill = fill, ...) +
    geom_text(aes(label = fmt({{ val }})), hjust = -0.08, size = 3) +
    coord_flip() +
    scale_y_continuous(labels = fmt, expand = expansion(mult = c(0, 0.2))) +
    labs(x = NULL, y = NULL) + theme_cnam
}
Code
s <- d
mois_ref <- unique(s$mois_ref)
cum <- s |> filter(periode == "cumul", risque == "total") |>
  mutate(is_total = str_detect(prestation, "^(TOTAL|Total)"))
mens <- s |> filter(periode == "mois")
gt_total <- cum |> filter(str_detect(prestation, "TOTAL STATISTIQUE"))

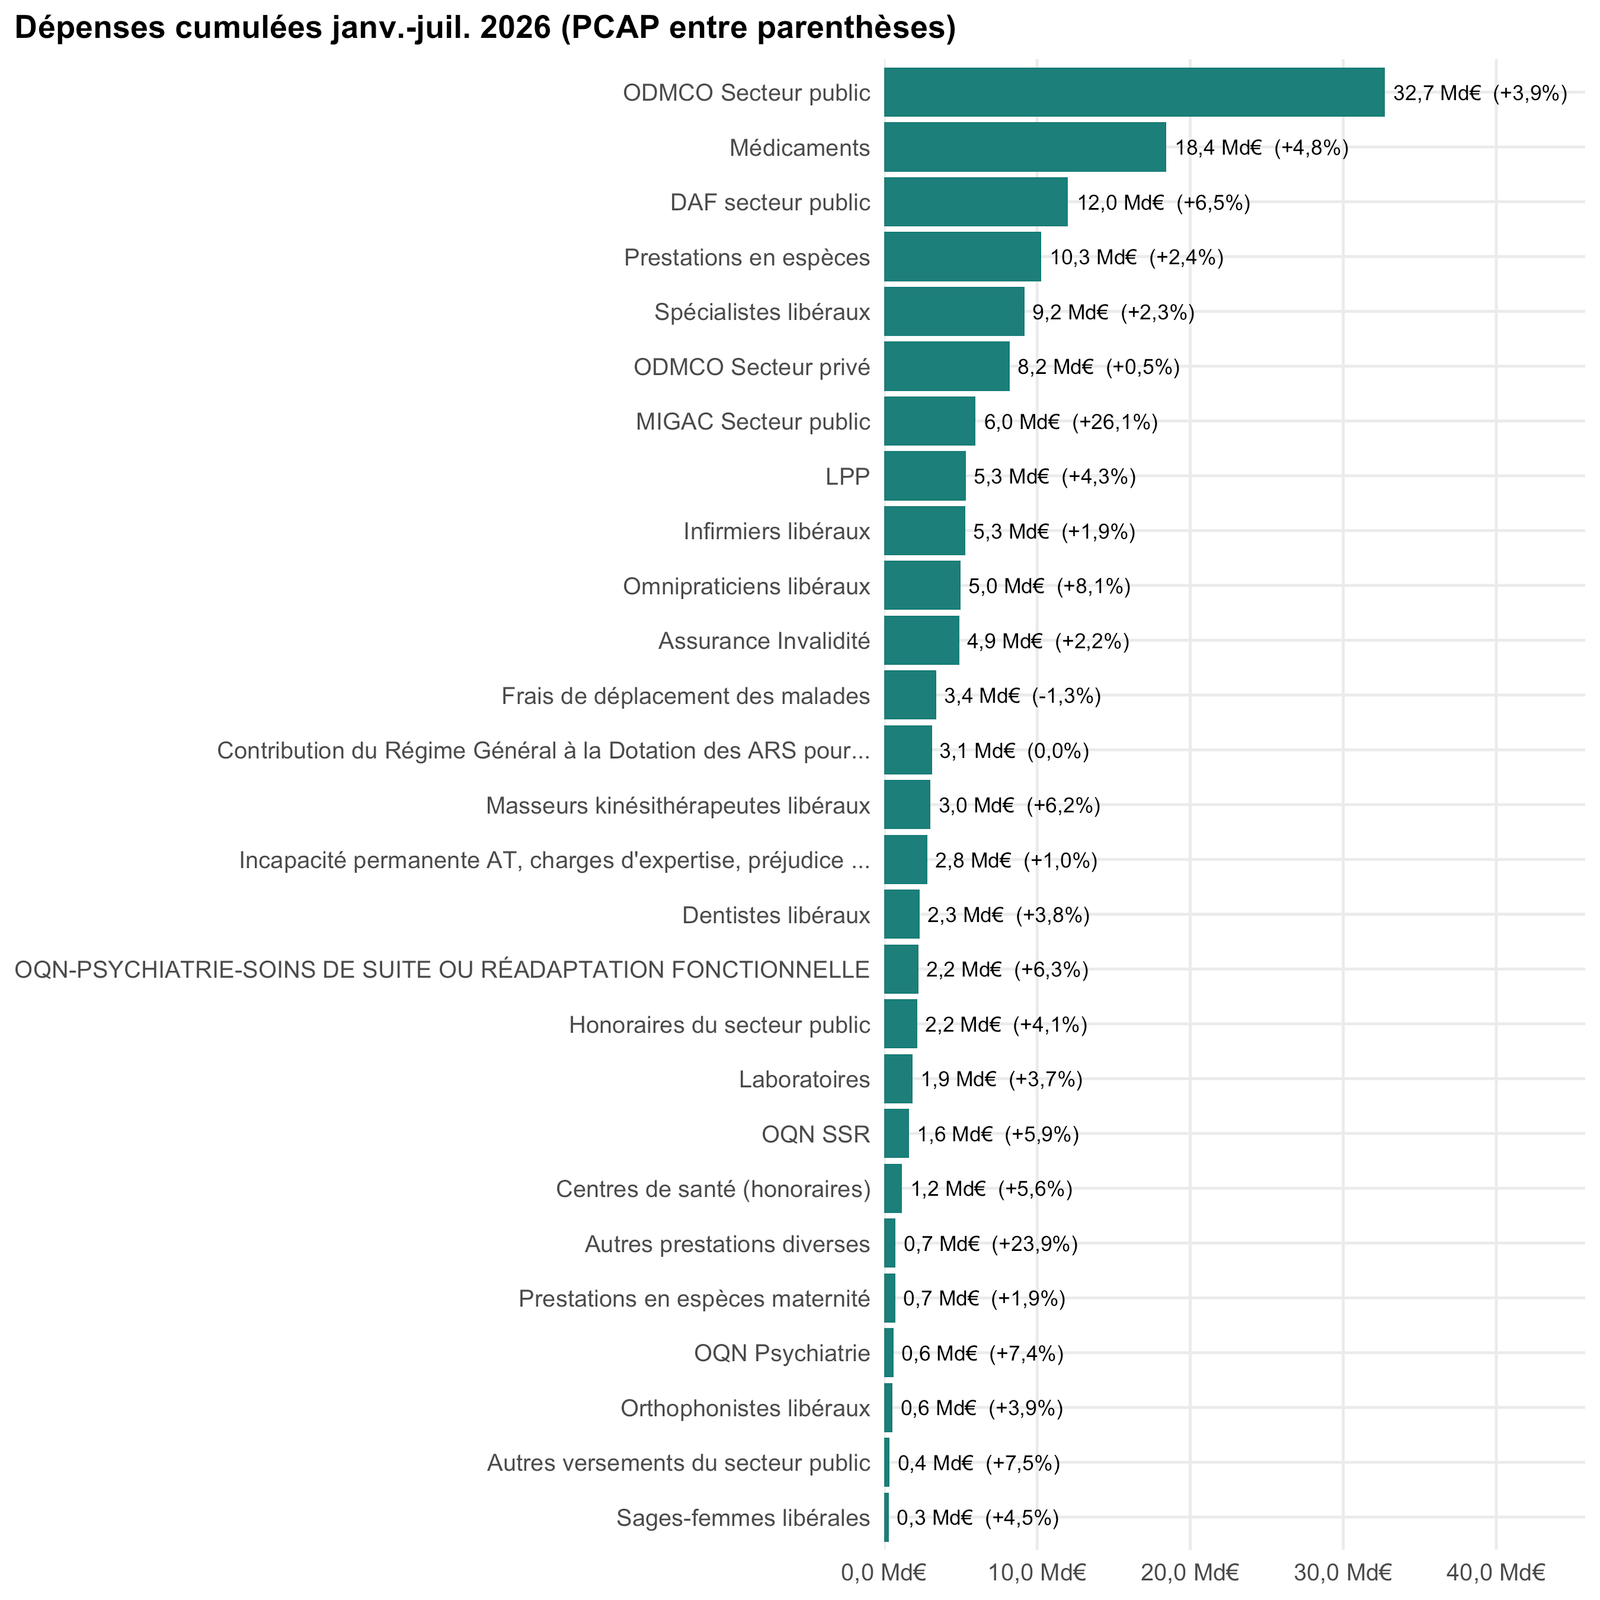
Statistique mensuelle des dépenses de l’assurance maladie (régime général, tous risques : maladie, maternité, accidents du travail) publiée par la Cnam : soins de ville (honoraires, auxiliaires, laboratoires, transports, médicaments, LPP), versements aux établissements de santé publics et privés, établissements médico-sociaux, prestations en espèces, invalidité et décès, fonds divers. Deux feuillets : le mois de juillet 2026 et le cumul du 1er janvier au 31 juillet avec l’évolution en PCAP (par rapport à la même période de l’année précédente). Le total statistique cumulé atteint 143,9 Md€ (4,5% sur un an).

Les grands postes du cumul

Code
cum |> filter(!is_total, montant > 3e8) |> mutate(l = forcats::fct_reorder(str_trunc(prestation, 60), montant)) |>
  ggplot(aes(l, montant)) + geom_col(fill = col1) + coord_flip() +
  geom_text(aes(label = paste0(mdd(montant), "  (", scales::label_percent(accuracy = 0.1, decimal.mark = ",", style_positive = "plus")(evolution), ")")),
            hjust = -0.05, size = 3) +
  scale_y_continuous(labels = mdd, expand = expansion(mult = c(0, .4))) +
  labs(x = NULL, y = NULL, title = "Dépenses cumulées janv.-juil. 2026 (PCAP entre parenthèses)") + theme_cnam

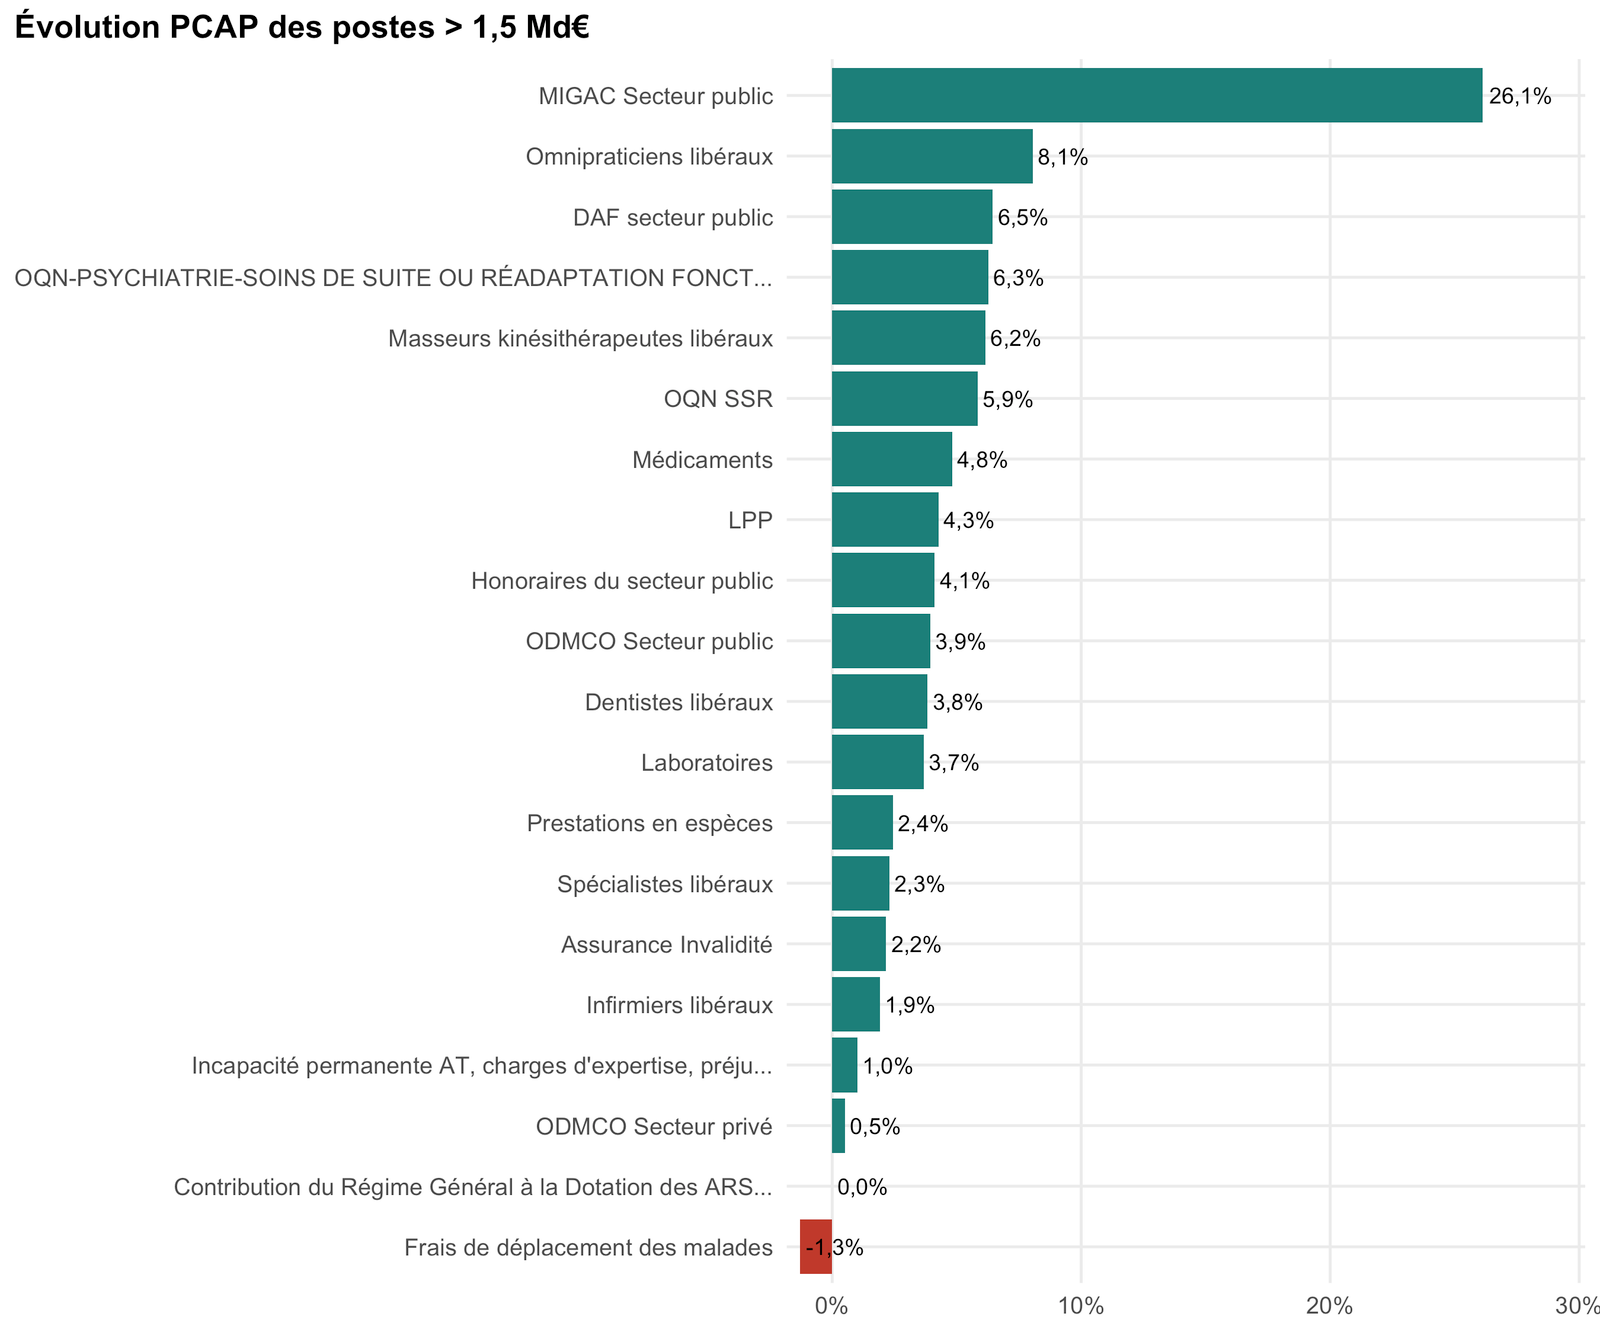
Ce qui accélère, ce qui ralentit

Code
cum |> filter(!is_total, montant > 1.5e9, !is.na(evolution)) |>
  mutate(l = forcats::fct_reorder(str_trunc(prestation, 55), evolution)) |>
  ggplot(aes(l, evolution, fill = evolution > 0)) + geom_col(show.legend = FALSE) + coord_flip() +
  geom_text(aes(label = pct(evolution)), hjust = -0.1, size = 3.2) +
  scale_y_continuous(labels = scales::label_percent(), expand = expansion(mult = c(0.02, .15))) +
  scale_fill_manual(values = c(`TRUE` = col1, `FALSE` = col2)) +
  labs(x = NULL, y = NULL, title = "Évolution PCAP des postes > 1,5 Md€") + theme_cnam

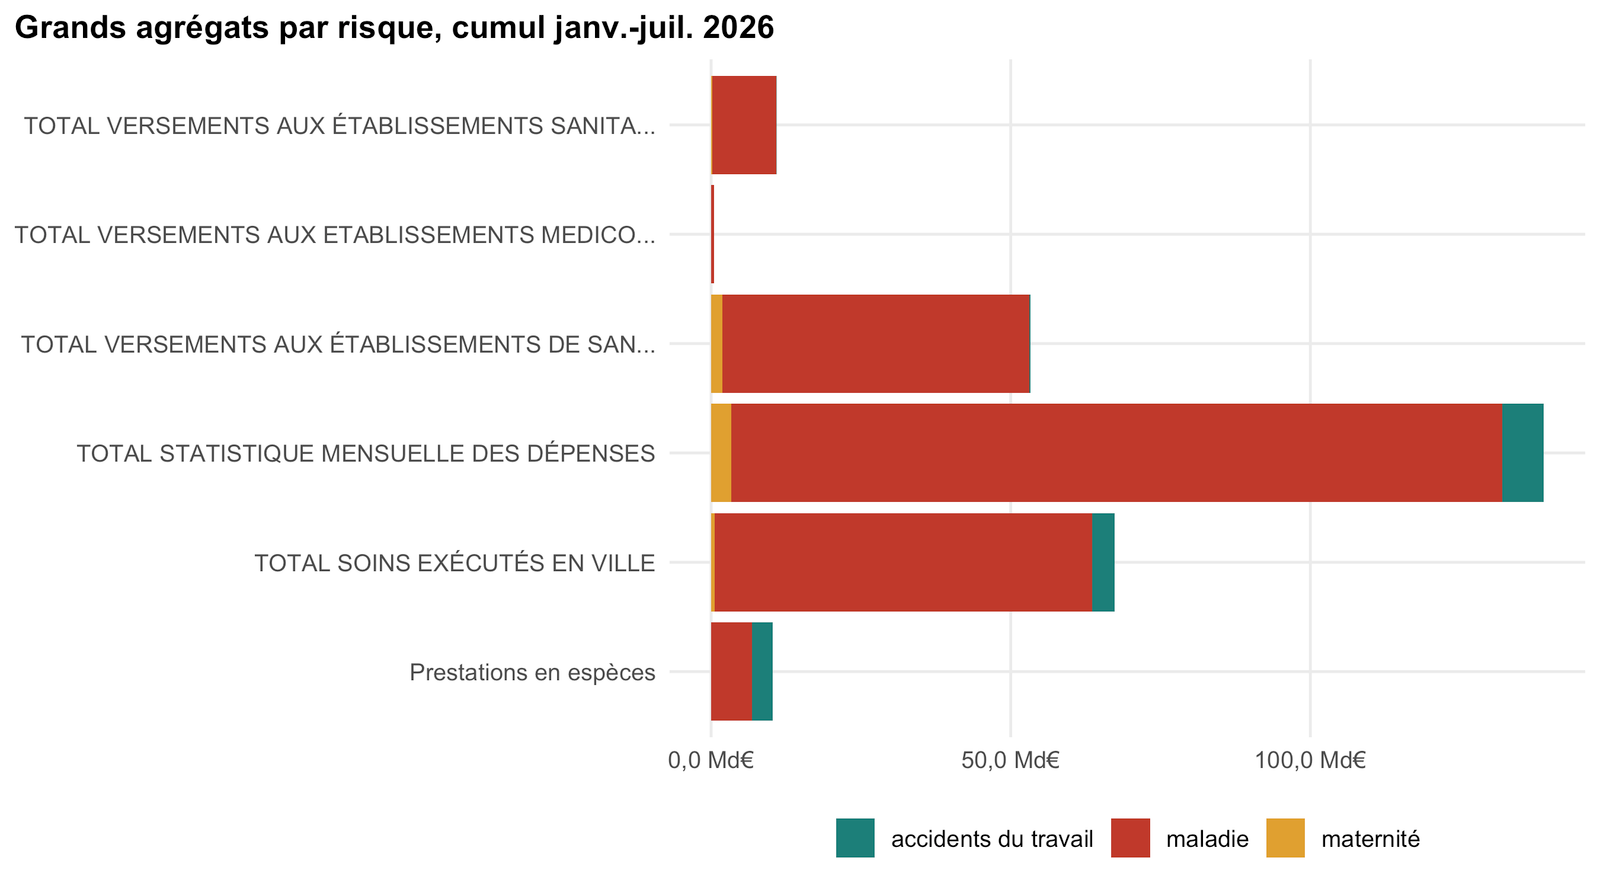
Par risque

Code
sg <- s |> filter(periode == "cumul", risque != "total", str_detect(prestation, "^TOTAL (SOINS EXÉCUTÉS EN VILLE|VERSEMENTS|STATISTIQUE)|^Prestations en espèces$|^Assurance"))
sg |> mutate(prestation = str_trunc(prestation, 45)) |>
  ggplot(aes(prestation, montant, fill = risque)) + geom_col() + coord_flip() +
  scale_y_continuous(labels = mdd) + scale_fill_manual(values = c(col1, col2, "#e0a030")) +
  labs(x = NULL, y = NULL, fill = NULL, title = "Grands agrégats par risque, cumul janv.-juil. 2026") + theme_cnam

Les accidents du travail pèsent surtout par les prestations en espèces (indemnités journalières et rentes), la maternité par les prestations en espèces et les honoraires des sages-femmes ; la maladie porte le reste.

Le mois de juillet

Code
mens |> filter(risque == "total", !str_detect(prestation, "^(TOTAL|Total)"), montant > 1.5e8) |>
  mutate(l = forcats::fct_reorder(str_trunc(prestation, 55), montant)) |>
  ggplot(aes(l, montant)) + geom_col(fill = col2) + coord_flip() +
  geom_text(aes(label = mdd(montant)), hjust = -0.1, size = 3) +
  scale_y_continuous(expand = expansion(mult = c(0, .2))) +
  labs(x = NULL, y = NULL, title = "Dépenses du mois de juillet 2026, lignes > 150 M€") + theme_cnam

Table complète

Code
s |> filter(periode == "cumul") |> select(ligne, prestation, risque, montant, evolution) |>
  pivot_wider(names_from = risque, values_from = c(montant, evolution)) |>
  select(ligne, prestation, `montant_total`, `evolution_total`, `montant_maladie`, `montant_maternité`, `montant_accidents du travail`) |>
  reactable::reactable(searchable = TRUE, pagination = FALSE, height = 520, compact = TRUE,
    columns = list(ligne = reactable::colDef(show = FALSE),
      prestation = reactable::colDef(name = "Prestation", minWidth = 280),
      montant_total = reactable::colDef(name = "Total (€)", format = reactable::colFormat(separators = TRUE, digits = 0)),
      evolution_total = reactable::colDef(name = "PCAP", format = reactable::colFormat(percent = TRUE, digits = 1)),
      montant_maladie = reactable::colDef(name = "Maladie", format = reactable::colFormat(separators = TRUE, digits = 0)),
      `montant_maternité` = reactable::colDef(name = "Maternité", format = reactable::colFormat(separators = TRUE, digits = 0)),
      `montant_accidents du travail` = reactable::colDef(name = "AT", format = reactable::colFormat(separators = TRUE, digits = 0))))

Source

Caisse nationale de l’Assurance Maladie (Cnam) — Cnam (SNDS) — « Résultats à fin juillet 2026 » (statistique mensuelle des dépenses), onglets SYNTHESE et CUMUL_SYNTHESE. Conversion Excel → Parquet : cnam.R (dossier data/cnam).