Last observation: sept. 2026 (N = 423)
First observation: janv. 2000 (N = 423)
Last data update: 20 oct. 2026, 10:33
Last compile: 20 oct. 2026, 10:37
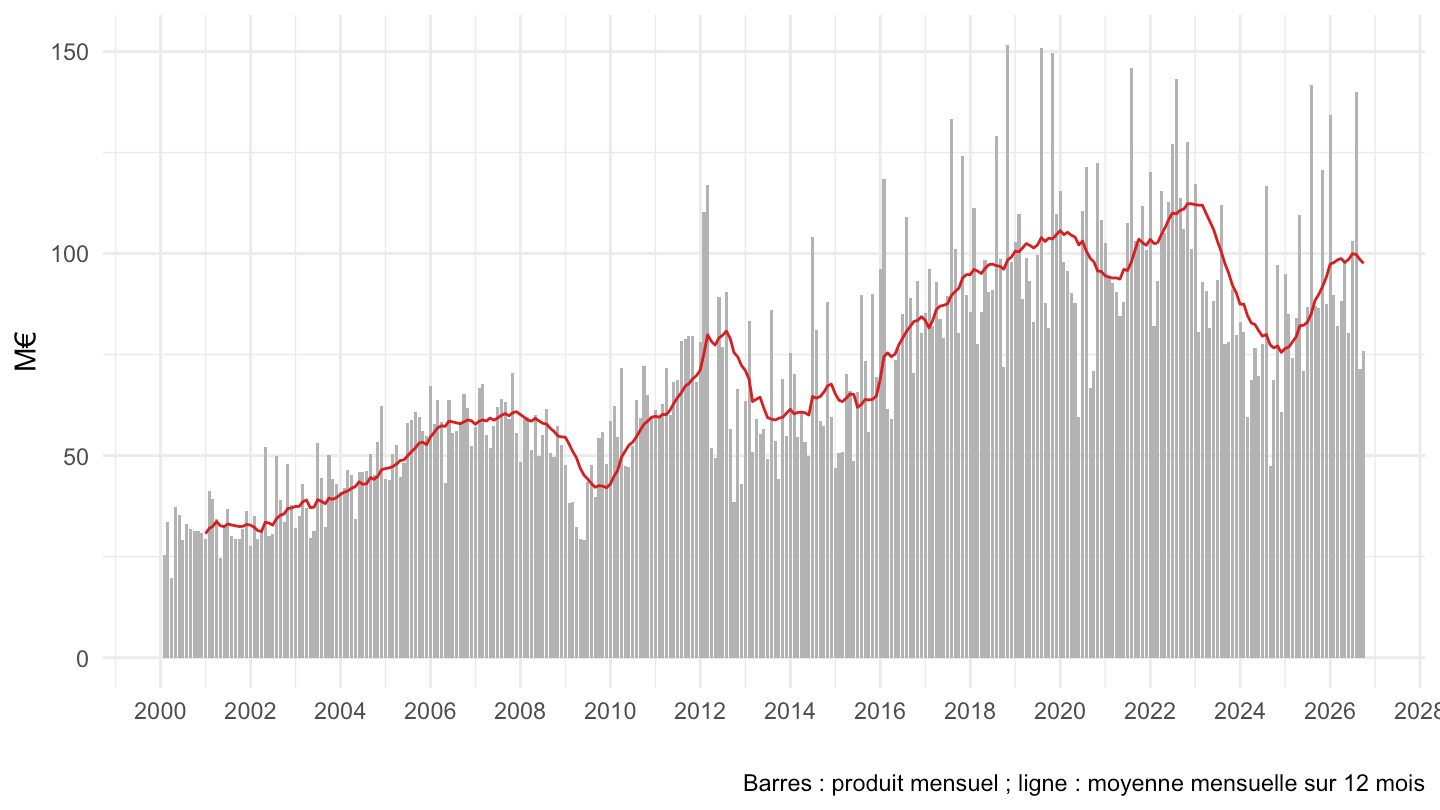
Produit mensuel des droits de mutation à titre onéreux (DMTO, la plus grosse partie des « frais de notaire ») perçus par les départements, d’après la DGFiP, compilé par Jacques Friggit (IGEDD). Trois assiettes :
NB : depuis mi-2019, les montants de la Haute-Corse (2B) sont fusionnés dans ceux de la Corse-du-Sud (2A) ; depuis début 2021, ceux du Bas-Rhin (67) dans ceux du Haut-Rhin (68). Les graphiques par département ci-dessous regroupent donc la Corse et l’Alsace.
Source : IGEDD, valeur-immobilier-france.xlsx.
dmto |>
  filter(niveau == "Département") |>
  mutate(value = round(value)) |>
  pivot_wider(id_cols = c(date, code, libelle), names_from = type, values_from = value) |>
  rename(departement = libelle) |>
  download_this(output_name = "droits-mutation-departement",
                output_extension = ".csv",
                button_label = "Départements, mensuel (CSV)",
                button_type = "success",
                has_icon = TRUE, icon = "fa fa-download",
csv2 = FALSE)dmto |>
mutate(annee = year(date)) |>
group_by(niveau, code, libelle, type, annee) |>
summarise(value = round(sum(value)), nb_mois = n(), .groups = "drop") |>
download_this(output_name = "droits-mutation-annuel",
output_extension = ".csv",
button_label = "Tous niveaux, annuel (CSV)",
button_type = "success",
has_icon = TRUE, icon = "fa fa-download",
csv2 = FALSE)dmto_12m |>
filter(code == "FR", !is.na(value_12m)) |>
ggplot() + theme_minimal() + xlab("") + ylab("Cumul sur 12 mois (Md€)") +
geom_line(aes(x = date, y = value_12m / 1e9, color = type)) +
scale_x_date(breaks = seq(1960, 2100, 2) |> paste0("-01-01") |> as.Date(),
labels = date_format("%Y")) +
scale_y_continuous(breaks = seq(0, 30, 1),
labels = dollar_format(accuracy = 1, prefix = "", suffix = " Md€")) +
theme(legend.position = c(0.25, 0.85),
legend.title = element_blank())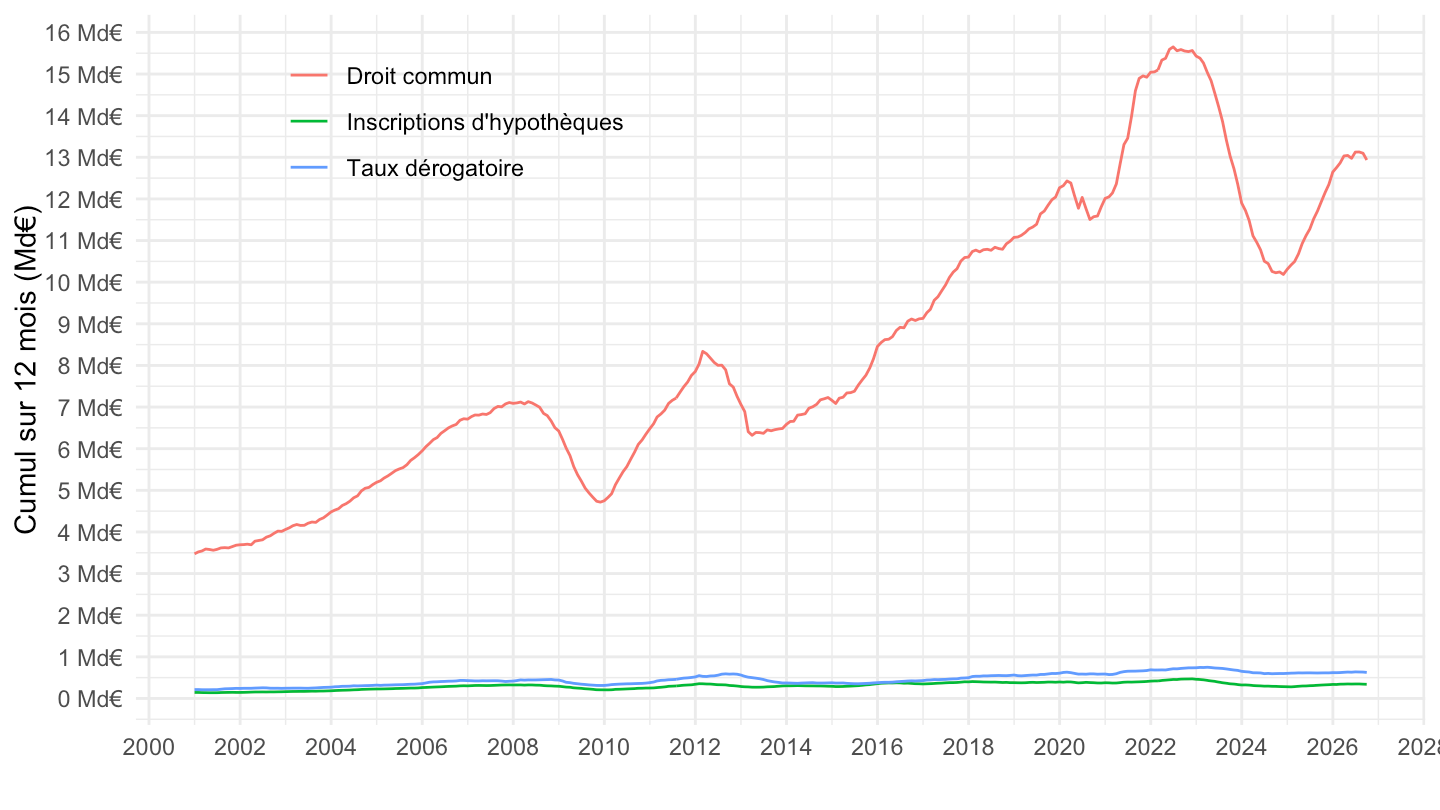
dmto_12m |>
  filter(code == "FR", type == "Droit commun", !is.na(value_12m)) |>
  ggplot() + theme_minimal() + xlab("") + ylab("Cumul sur 12 mois (Md€)") +
  geom_line(aes(x = date, y = value_12m / 1e9)) +
  scale_x_date(breaks = seq(1960, 2100, 2) |> paste0("-01-01") |> as.Date(),
               labels = date_format("%Y")) +
  scale_y_continuous(breaks = seq(0, 30, 1),
                     labels = dollar_format(accuracy = 1, prefix = "", suffix = " Md€"))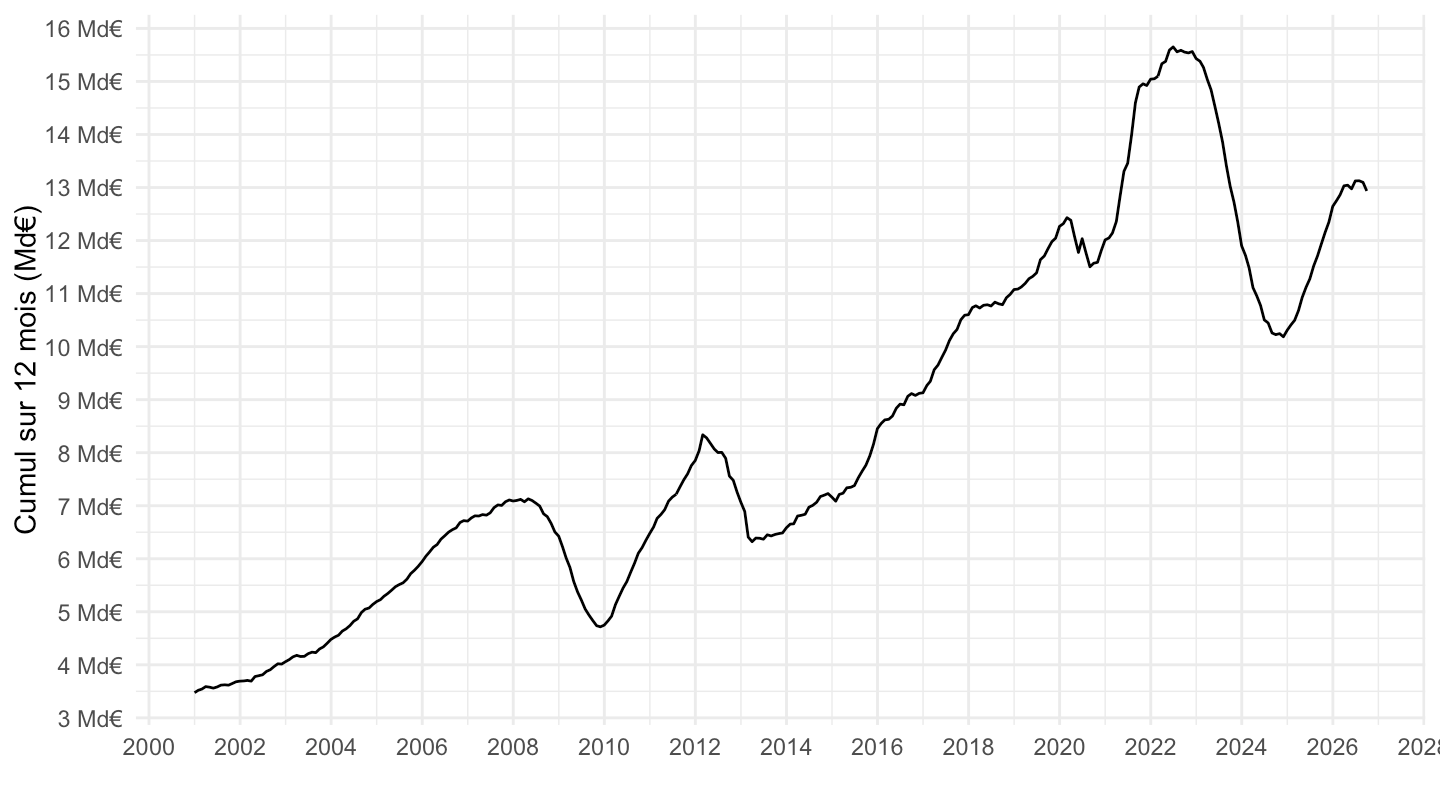
dmto_12m |>
  filter(code == "FR", type == "Droit commun") |>
  arrange(date) |>
  mutate(yoy = value_12m / lag(value_12m, 12) - 1) |>
  filter(!is.na(yoy)) |>
  ggplot() + theme_minimal() + xlab("") + ylab("Glissement annuel") +
  geom_line(aes(x = date, y = yoy)) +
  geom_hline(yintercept = 0, linetype = "dashed") +
  scale_x_date(breaks = seq(1960, 2100, 2) |> paste0("-01-01") |> as.Date(),
               labels = date_format("%Y")) +
  scale_y_continuous(breaks = 0.01 * seq(-50, 50, 5),
                     labels = percent_format(accuracy = 1))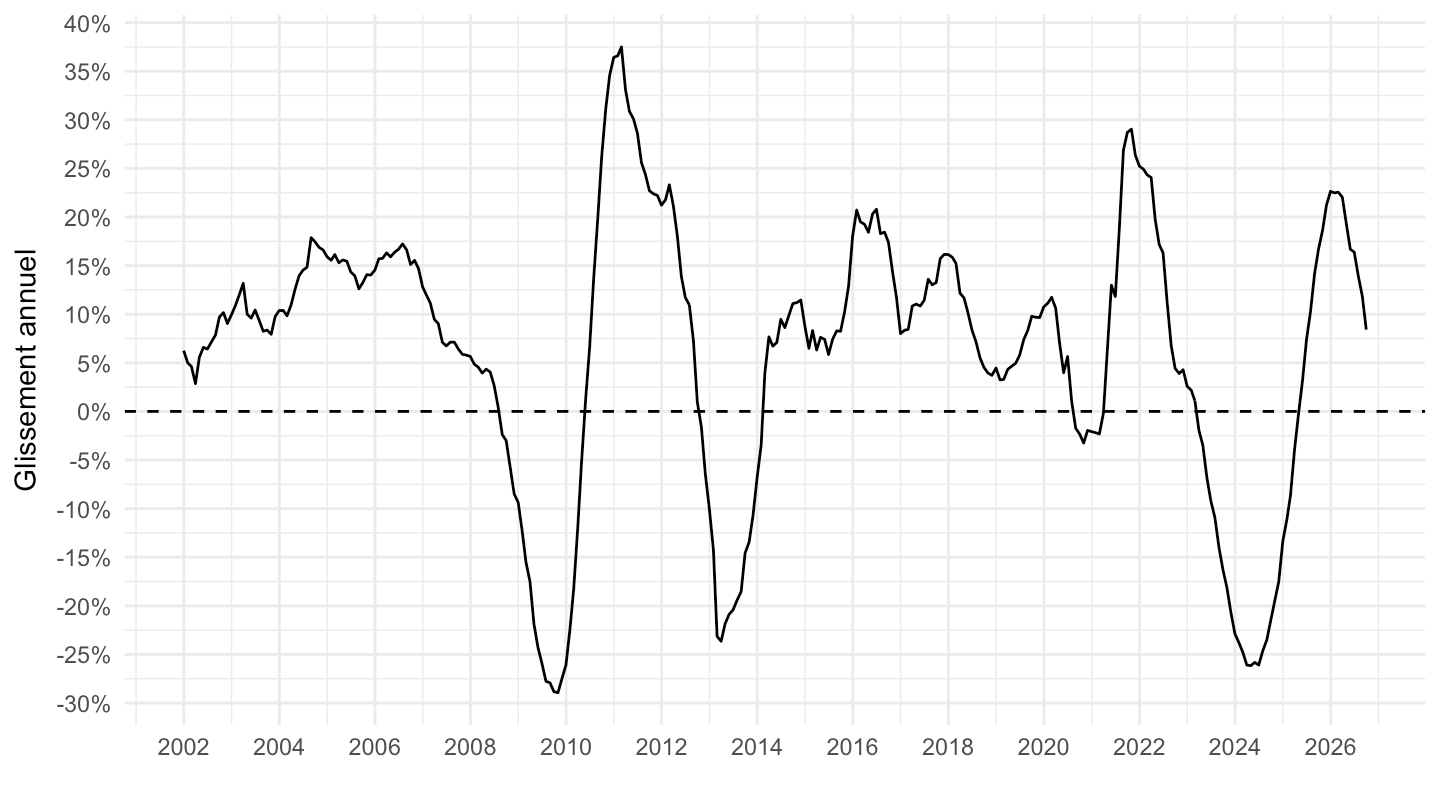
dmto_12m |>
  filter(niveau == "France", code != "FR", type == "Droit commun", !is.na(value_12m)) |>
  group_by(libelle) |>
  mutate(value_12m = 100 * value_12m / value_12m[date == as.Date("2019-12-31")]) |>
  ggplot() + theme_minimal() + xlab("") + ylab("Cumul sur 12 mois (100 = 2019)") +
  geom_line(aes(x = date, y = value_12m, color = libelle)) +
  scale_x_date(breaks = seq(1960, 2100, 2) |> paste0("-01-01") |> as.Date(),
               labels = date_format("%Y")) +
  scale_y_log10(breaks = seq(0, 300, 10)) +
  theme(legend.position = c(0.2, 0.85),
        legend.title = element_blank())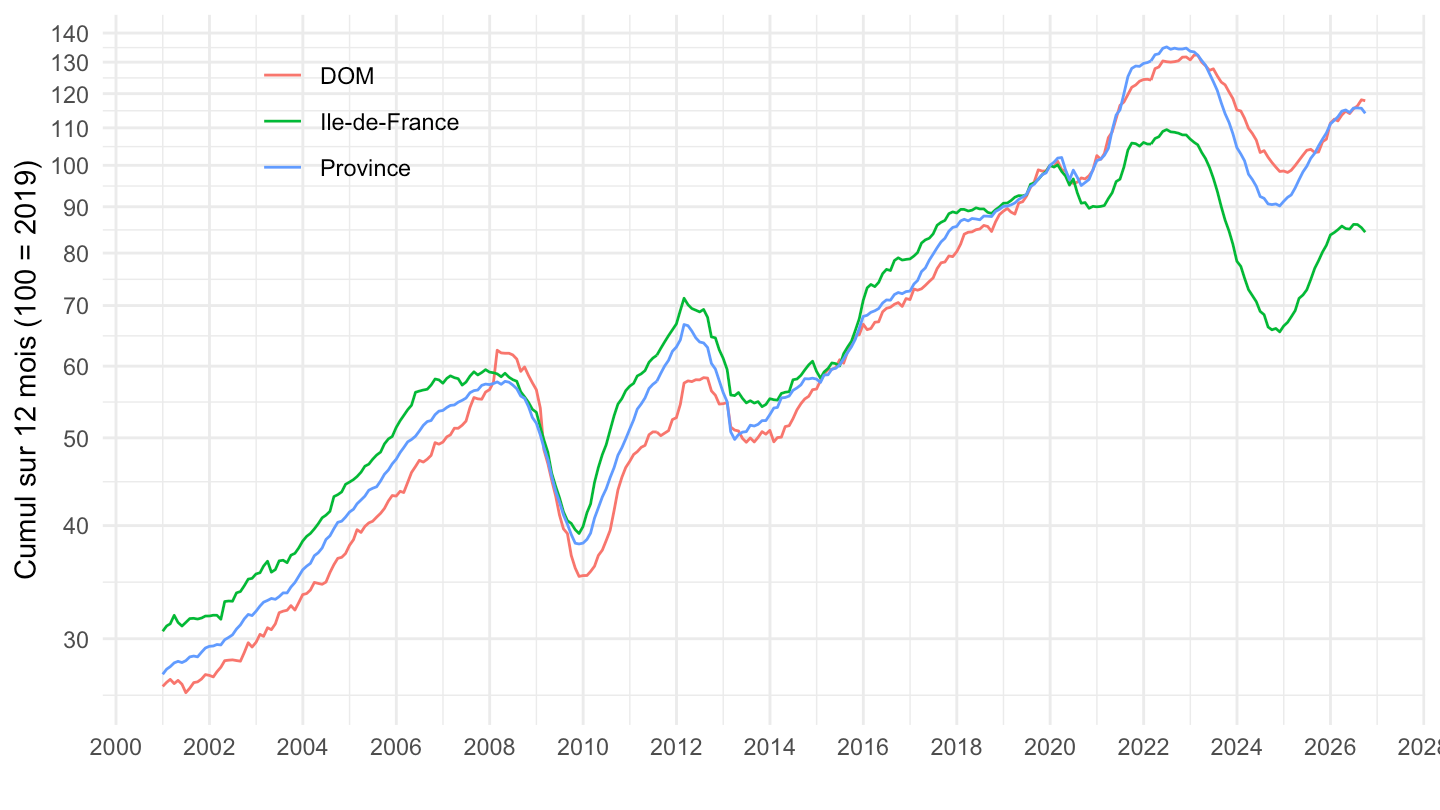
dmto_12m |>
  filter(niveau == "Région", type == "Droit commun", !is.na(value_12m)) |>
  ggplot() + theme_minimal() + xlab("") + ylab("Cumul sur 12 mois (Md€)") +
  geom_line(aes(x = date, y = value_12m / 1e9, color = libelle)) +
  scale_x_date(breaks = seq(1960, 2100, 4) |> paste0("-01-01") |> as.Date(),
               labels = date_format("%Y")) +
  scale_y_log10(breaks = c(0.01, 0.02, 0.05, 0.1, 0.2, 0.5, 1, 2, 5),
                labels = dollar_format(accuracy = 0.01, prefix = "", suffix = " Md€")) +
  theme(legend.title = element_blank())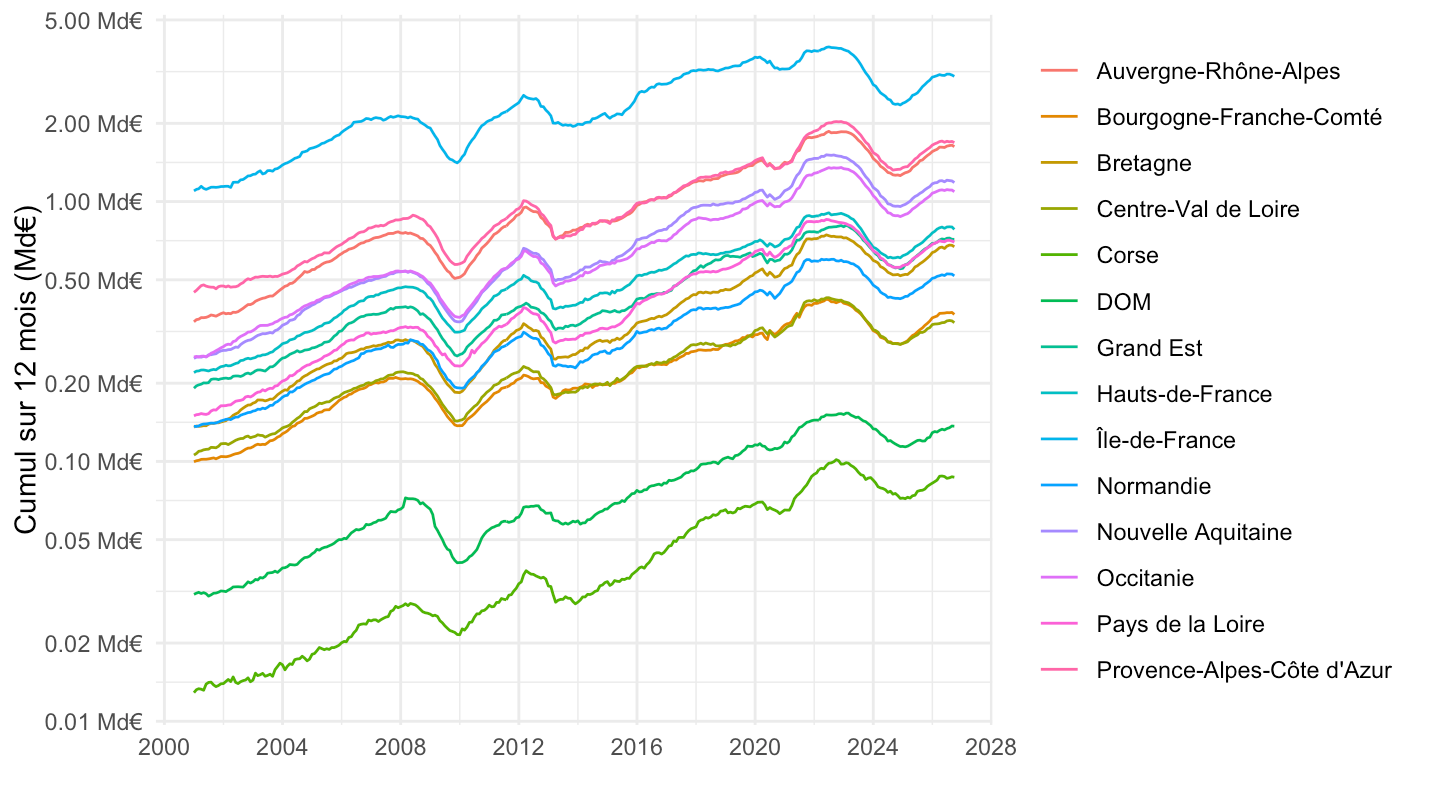
dmto_12m |>
  filter(niveau == "Région", type == "Droit commun", !is.na(value_12m),
         date >= as.Date("2015-01-01")) |>
  group_by(libelle) |>
  mutate(value_12m = 100 * value_12m / value_12m[date == as.Date("2019-12-31")]) |>
  ggplot() + theme_minimal() + xlab("") + ylab("Cumul sur 12 mois (100 = 2019)") +
  geom_line(aes(x = date, y = value_12m)) +
  geom_hline(yintercept = 100, linetype = "dashed", color = "grey50") +
  facet_wrap(~ libelle) +
  scale_x_date(breaks = seq(1960, 2100, 4) |> paste0("-01-01") |> as.Date(),
               labels = date_format("%Y"))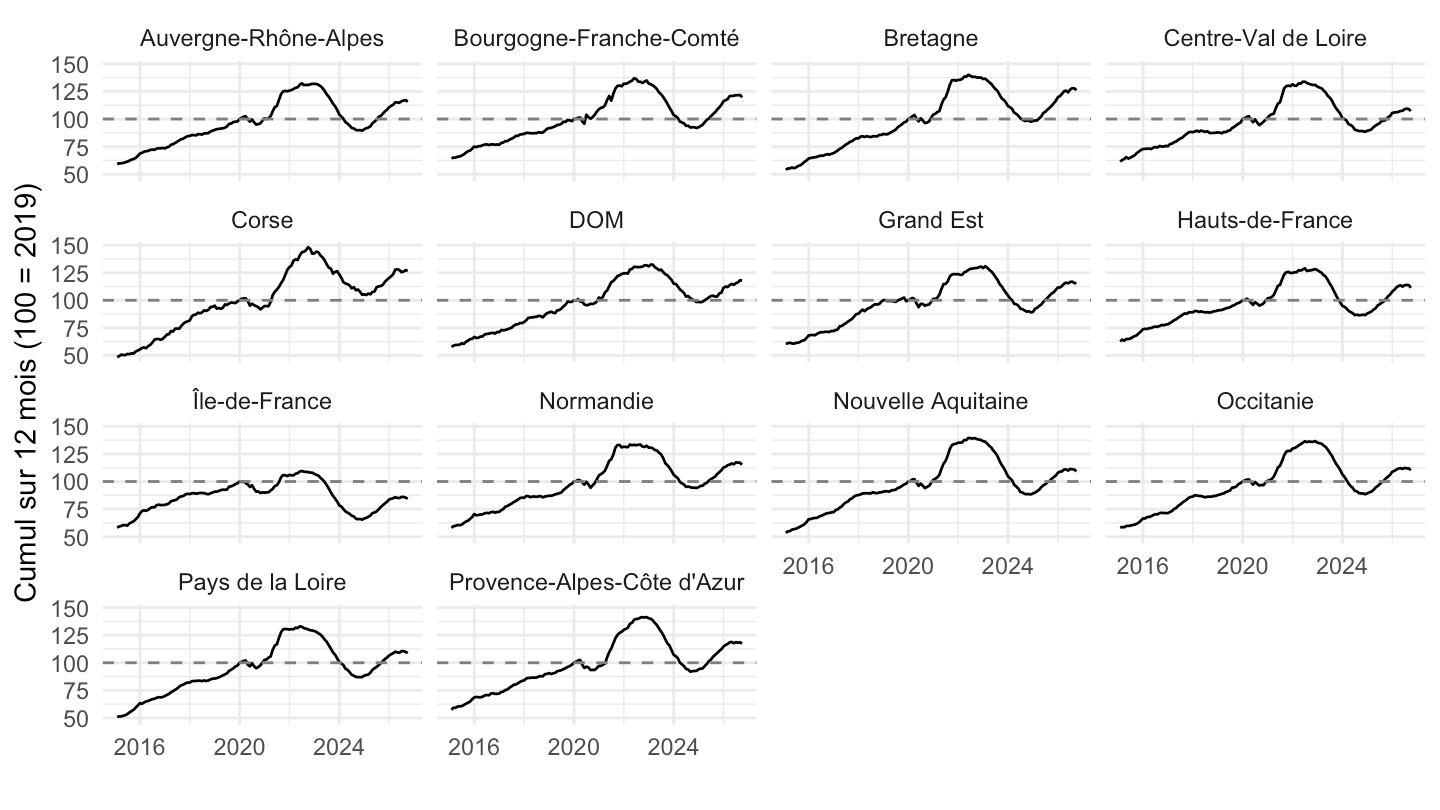
dep_12m |>
  group_by(zone) |>
  arrange(date) |>
  summarise(`Cumul 12 mois (M€)` = last(value_12m) / 1e6,
            `Glissement annuel` = last(value_12m) / value_12m[date == last_date - years(1)] - 1,
            `Max (M€)` = max(value_12m, na.rm = TRUE) / 1e6,
            `Date du max` = date[which.max(value_12m)],
            `Écart au max` = last(value_12m) / max(value_12m, na.rm = TRUE) - 1) |>
  arrange(-`Cumul 12 mois (M€)`) |>
  rename(`Département` = zone) |>
  gt::gt() |>
  gt::fmt_number(c(`Cumul 12 mois (M€)`, `Max (M€)`), decimals = 0, sep_mark = " ") |>
  gt::fmt_percent(c(`Glissement annuel`, `Écart au max`), decimals = 1) |>
  gt::fmt_date(`Date du max`, date_style = "yMMM", locale = "fr") |>
gt::opt_interactive(use_search = TRUE, use_sorting = TRUE, page_size_default = 20)dep_12m |>
filter(date == last_date) |>
slice_max(value_12m, n = 20) |>
ggplot() + theme_minimal() + xlab("") + ylab("") +
geom_col(aes(x = value_12m / 1e6, y = reorder(zone, value_12m)), fill = "#2c7fb8") +
scale_x_continuous(breaks = seq(0, 2000, 100),
labels = dollar_format(accuracy = 1, prefix = "", suffix = " M€")) +
labs(caption = paste("Cumul sur 12 mois à fin", format(last_date, "%B %Y")))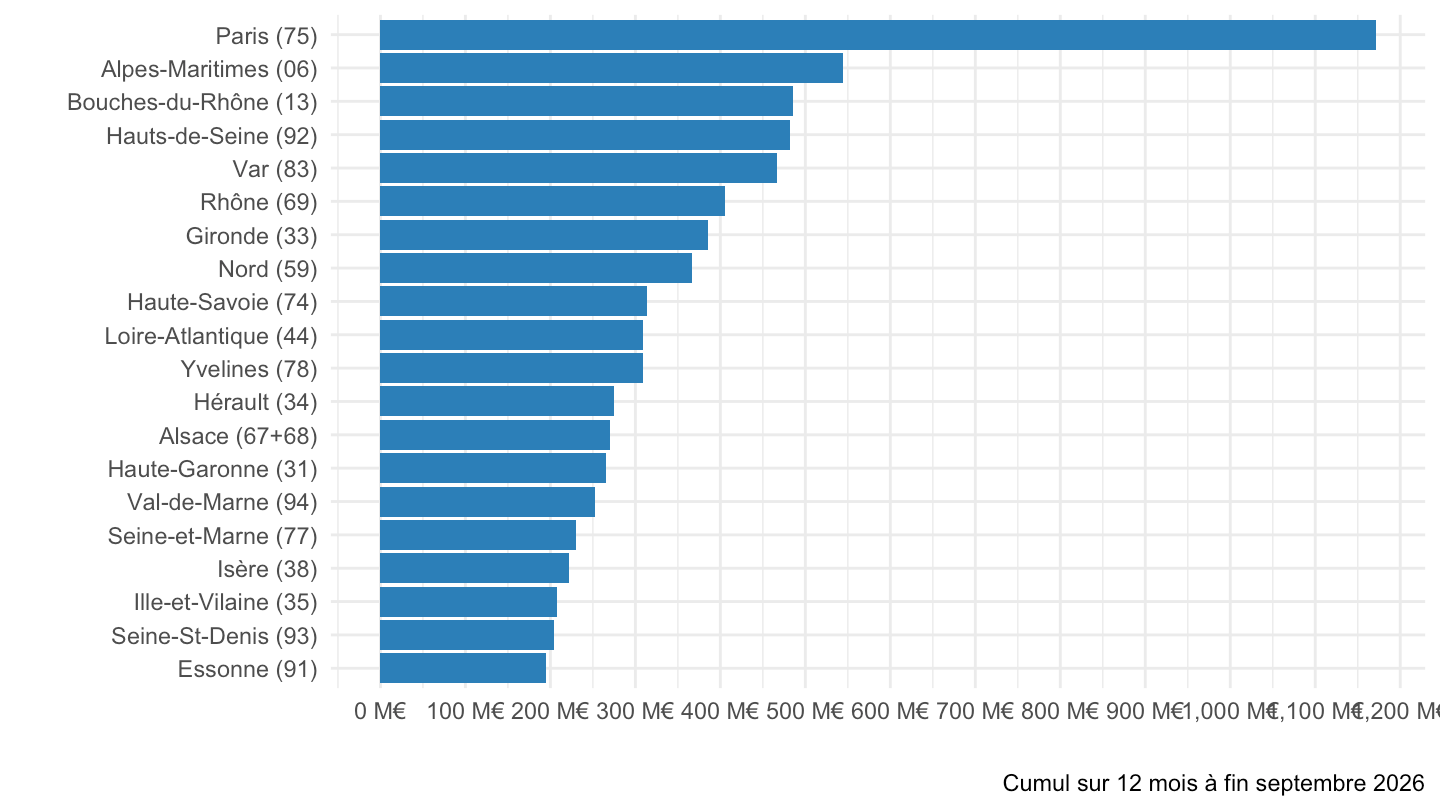
carte_data <- dep_12m |>
  filter(date == last_date) |>
  select(zone, value_12m) |>
  left_join(zones, by = "zone") |>
  # La Corse / l'Alsace ont un montant pour 2 polygones : on répartit à parts égales
  group_by(zone) |>
  mutate(value_12m = value_12m / n()) |>
  ungroup()

carte_data |>
  right_join(departements, by = "CODE_DEPT") |>
  ggplot() + aes(long, lat, group = group, fill = value_12m / 1e6) +
  coord_equal() + theme_void() + geom_polygon(color = "white", linewidth = 0.1) +
  scale_fill_viridis_c(na.value = "white", direction = -1, trans = "log10",
                       name = "M€ sur 12 mois",
                       breaks = c(10, 20, 50, 100, 200, 500, 1000)) +
  labs(caption = paste("Droit commun, cumul sur 12 mois à fin", format(last_date, "%B %Y"),
                       "\nCorse et Alsace : montant réparti à parts égales"))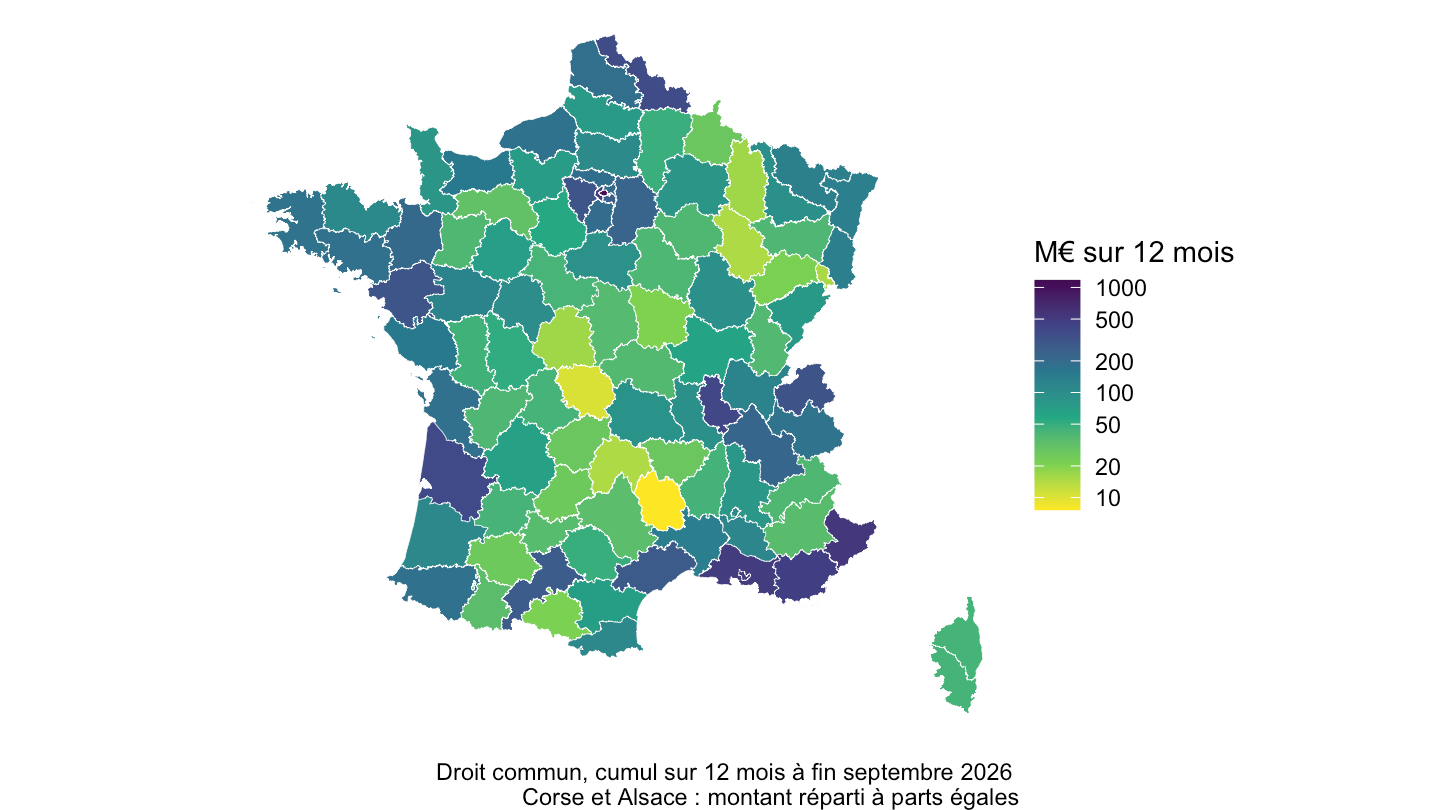
dep_12m |>
  group_by(zone) |>
  summarise(yoy = value_12m[date == last_date] / value_12m[date == last_date - years(1)] - 1) |>
  left_join(zones, by = "zone") |>
  right_join(departements, by = "CODE_DEPT") |>
  ggplot() + aes(long, lat, group = group, fill = yoy) +
  coord_equal() + theme_void() + geom_polygon(color = "white", linewidth = 0.1) +
  scale_fill_gradient2(low = "#d7191c", mid = "white", high = "#1a9641", midpoint = 0,
                       na.value = "grey90", labels = percent_format(accuracy = 1),
                       name = "Glissement\nannuel") +
  labs(caption = paste("Droit commun, cumul sur 12 mois à fin", format(last_date, "%B %Y"),
                       "vs. un an plus tôt"))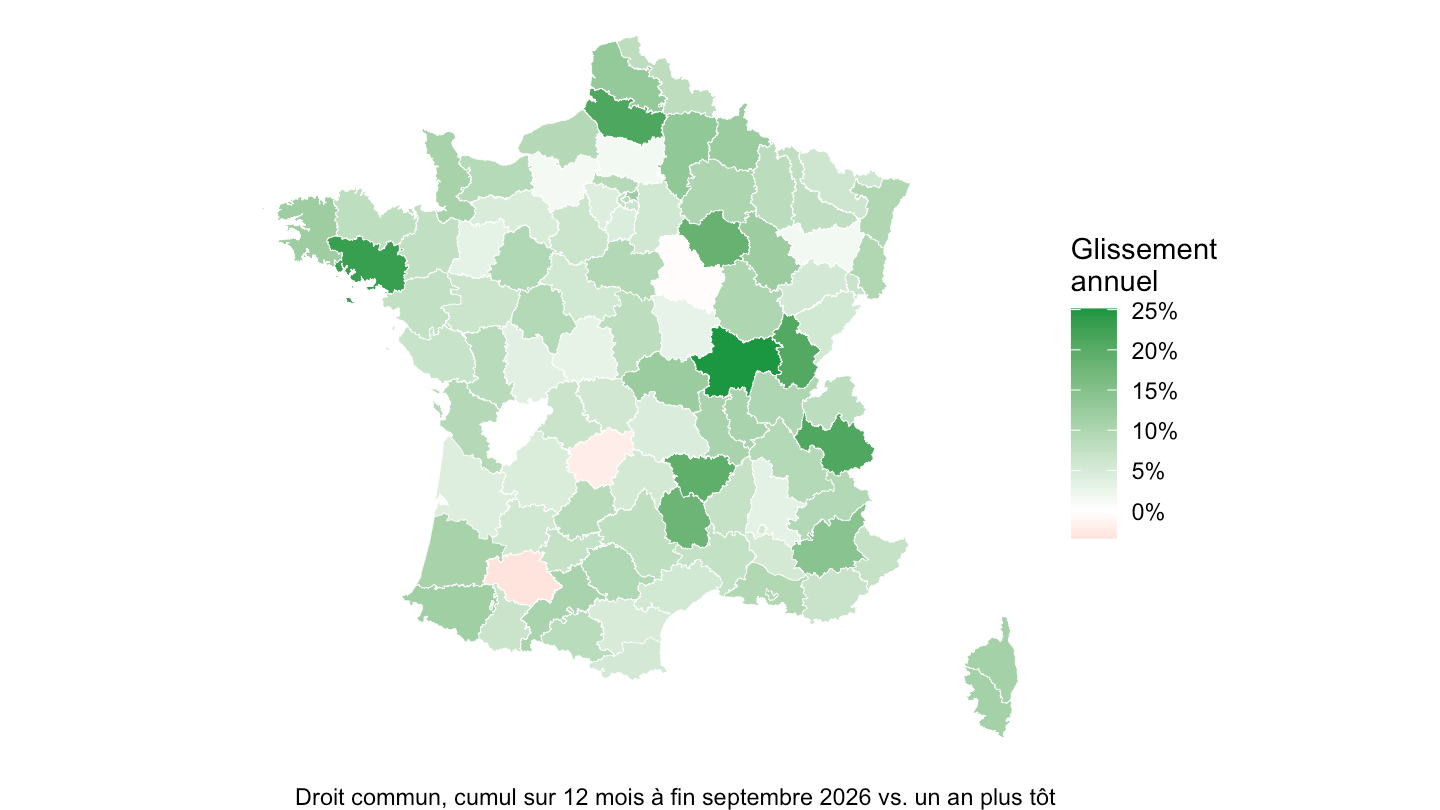
dep_12m |>
  group_by(zone) |>
  summarise(ecart = value_12m[date == last_date] /
              max(value_12m[year(date) == 2022], na.rm = TRUE) - 1) |>
  left_join(zones, by = "zone") |>
  right_join(departements, by = "CODE_DEPT") |>
  ggplot() + aes(long, lat, group = group, fill = ecart) +
  coord_equal() + theme_void() + geom_polygon(color = "white", linewidth = 0.1) +
  scale_fill_gradient2(low = "#d7191c", mid = "white", high = "#1a9641", midpoint = 0,
                       na.value = "grey90", labels = percent_format(accuracy = 1),
                       name = "Écart au\nmax. 2022") +
  labs(caption = paste("Droit commun, cumul sur 12 mois à fin", format(last_date, "%B %Y"),
                       "vs. maximum atteint en 2022"))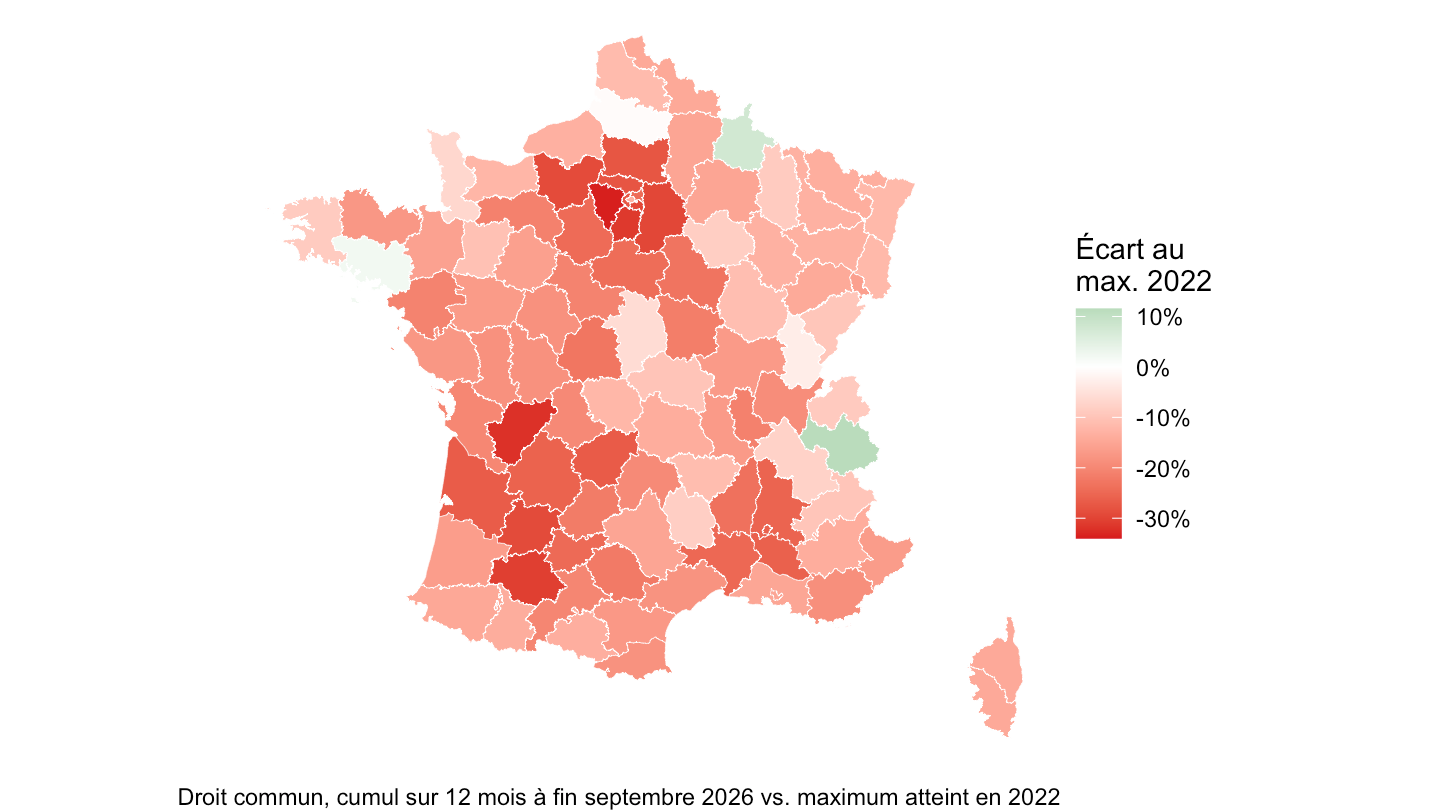
dep_12m |>
  filter(zone %in% c("Paris (75)", "Hauts-de-Seine (92)", "Rhône (69)",
                     "Bouches-du-Rhône (13)", "Gironde (33)", "Haute-Garonne (31)",
                     "Alpes-Maritimes (06)", "Loire-Atlantique (44)", "Nord (59)"),
         !is.na(value_12m)) |>
  group_by(zone) |>
  mutate(value_12m = 100 * value_12m / value_12m[date == as.Date("2019-12-31")]) |>
  ggplot() + theme_minimal() + xlab("") + ylab("Cumul sur 12 mois (100 = 2019)") +
  geom_line(aes(x = date, y = value_12m, color = zone)) +
  geom_hline(yintercept = 100, linetype = "dashed", color = "grey50") +
  scale_x_date(breaks = seq(1960, 2100, 2) |> paste0("-01-01") |> as.Date(),
               labels = date_format("%Y")) +
  scale_y_log10(breaks = seq(0, 300, 10)) +
  theme(legend.title = element_blank())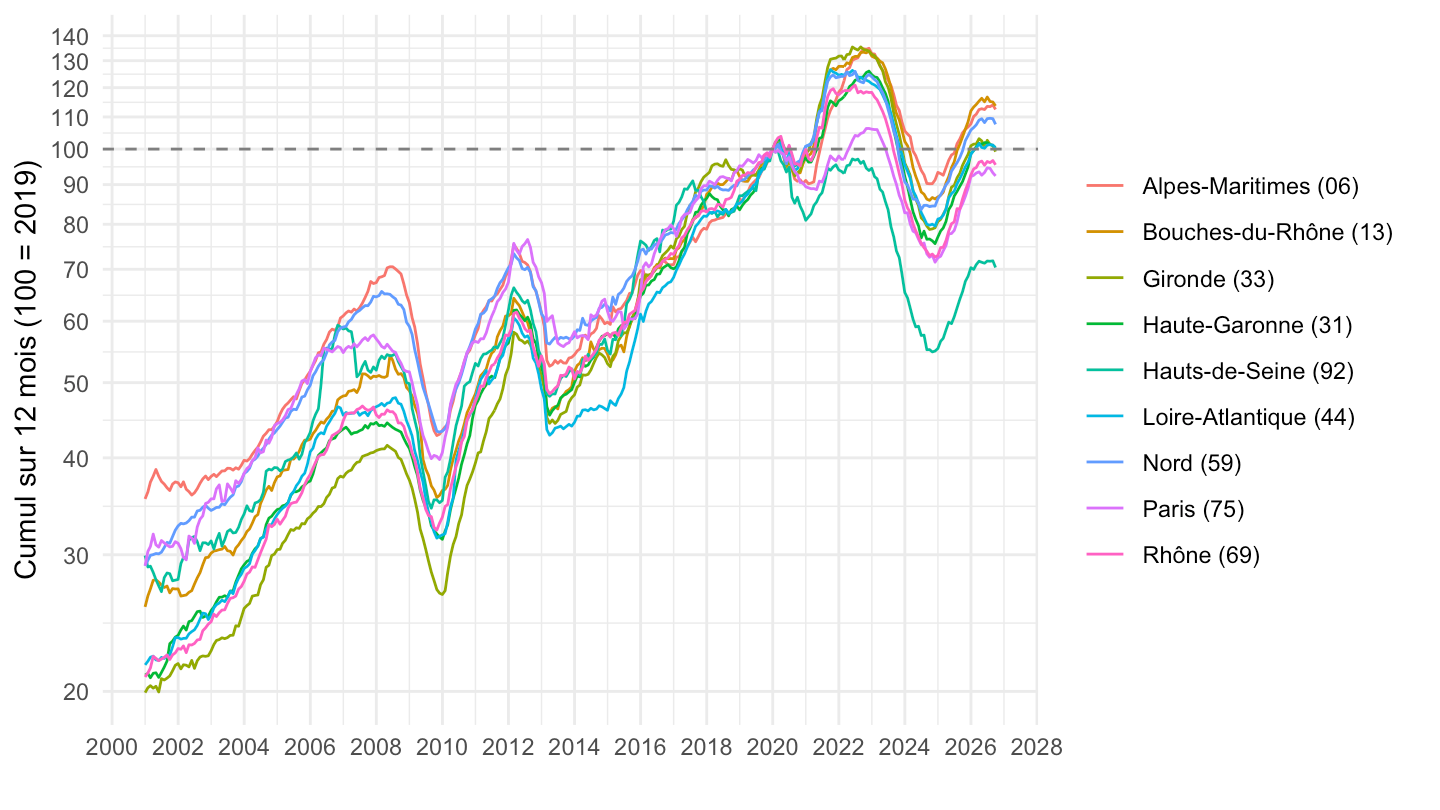
dep_12m |>
  filter(zone == "Paris (75)") |>
  ggplot() + theme_minimal() + xlab("") + ylab("M€") +
  geom_col(aes(x = date, y = value / 1e6), fill = "grey70") +
  geom_line(aes(x = date, y = value_12m / 12 / 1e6), color = "#d7191c") +
  scale_x_date(breaks = seq(1960, 2100, 2) |> paste0("-01-01") |> as.Date(),
               labels = date_format("%Y")) +
  labs(caption = "Barres : produit mensuel ; ligne : moyenne mensuelle sur 12 mois")