Nobs - Javascript
Code
bilateral_ER %>%
  group_by(iso3c, iso3c_reference) %>%
  summarise(Nobs = n(),
            date1 = first(date),
            date2 = last(date)) %>%
  arrange(-Nobs) %>%
  {if (is_html_output()) datatable(., filter = 'top', rownames = F) else .}
Fixed Exchange Rates
Code
ER_regime %>%
  group_by(fixed) %>%
  summarise(Nobs = n()) %>%
  {if (is_html_output()) print_table(.) else .}
| FALSE |
1215998 |
| TRUE |
155924 |
Code
ER_regime %>%
  filter(fixed) %>%
  group_by(iso3c, iso3c_reference) %>%
  summarise(Nobs = n(),
            date1 = first(date),
            date2 = last(date)) %>%
  arrange(-Nobs) %>%
  {if (is_html_output()) datatable(., filter = 'top', rownames = F) else .}
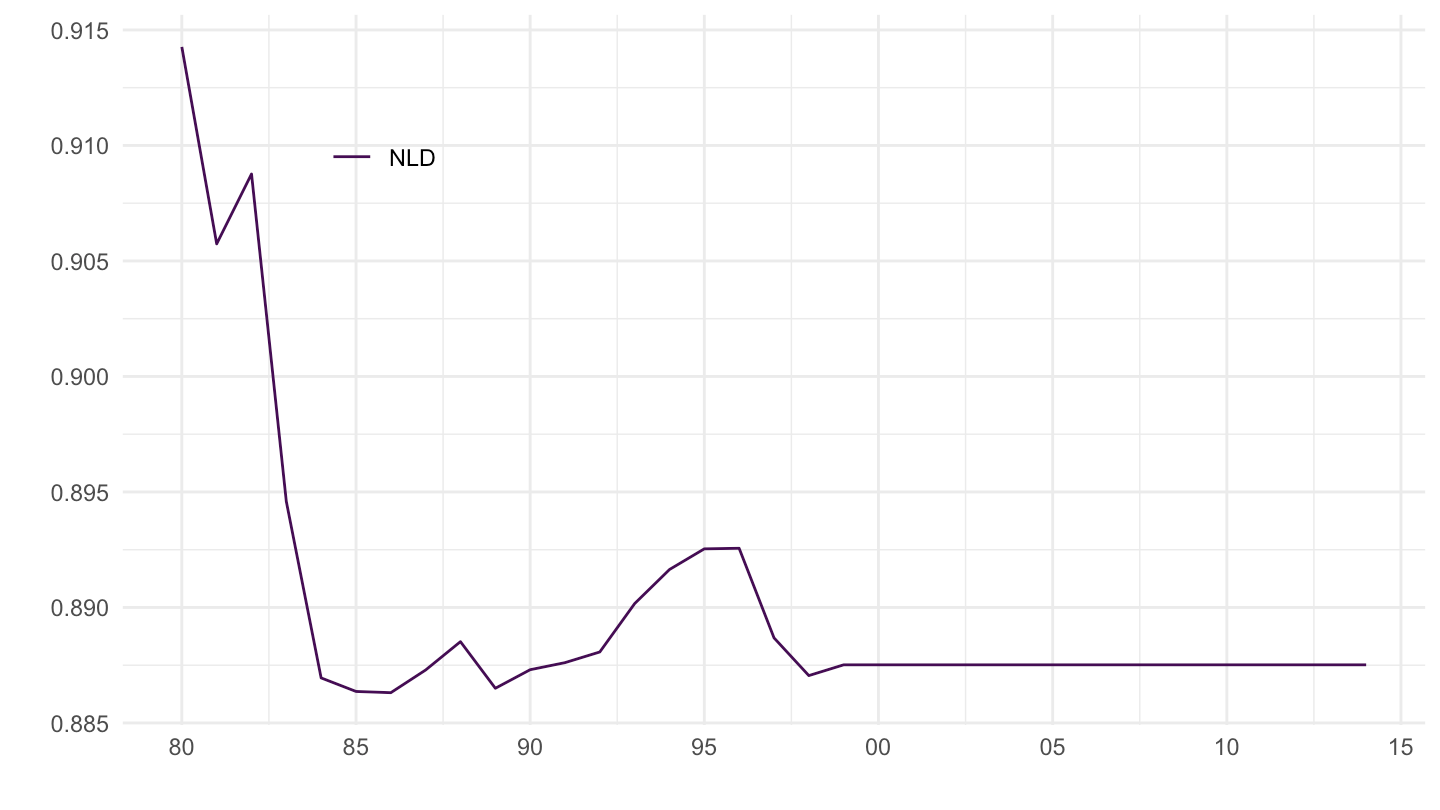
NLD/DEU
1 dollar = 7 Francs
Code
bilateral_ER %>%
  filter(iso3c_reference == "DEU",
         iso3c %in% c("NLD"),
         date >= as.Date("1980-01-01")) %>%
  ggplot + geom_line(aes(x = date, y = value, color = iso3c)) +
  theme_minimal() + xlab("") + ylab("") +
  scale_x_date(breaks = seq(1960, 2020, 5) %>% paste0("-01-01") %>% as.Date,
               labels = date_format("%y")) +
  scale_color_manual(values = viridis(5)[1:4]) +
  theme(legend.position = c(0.2, 0.80),
        legend.title = element_blank())
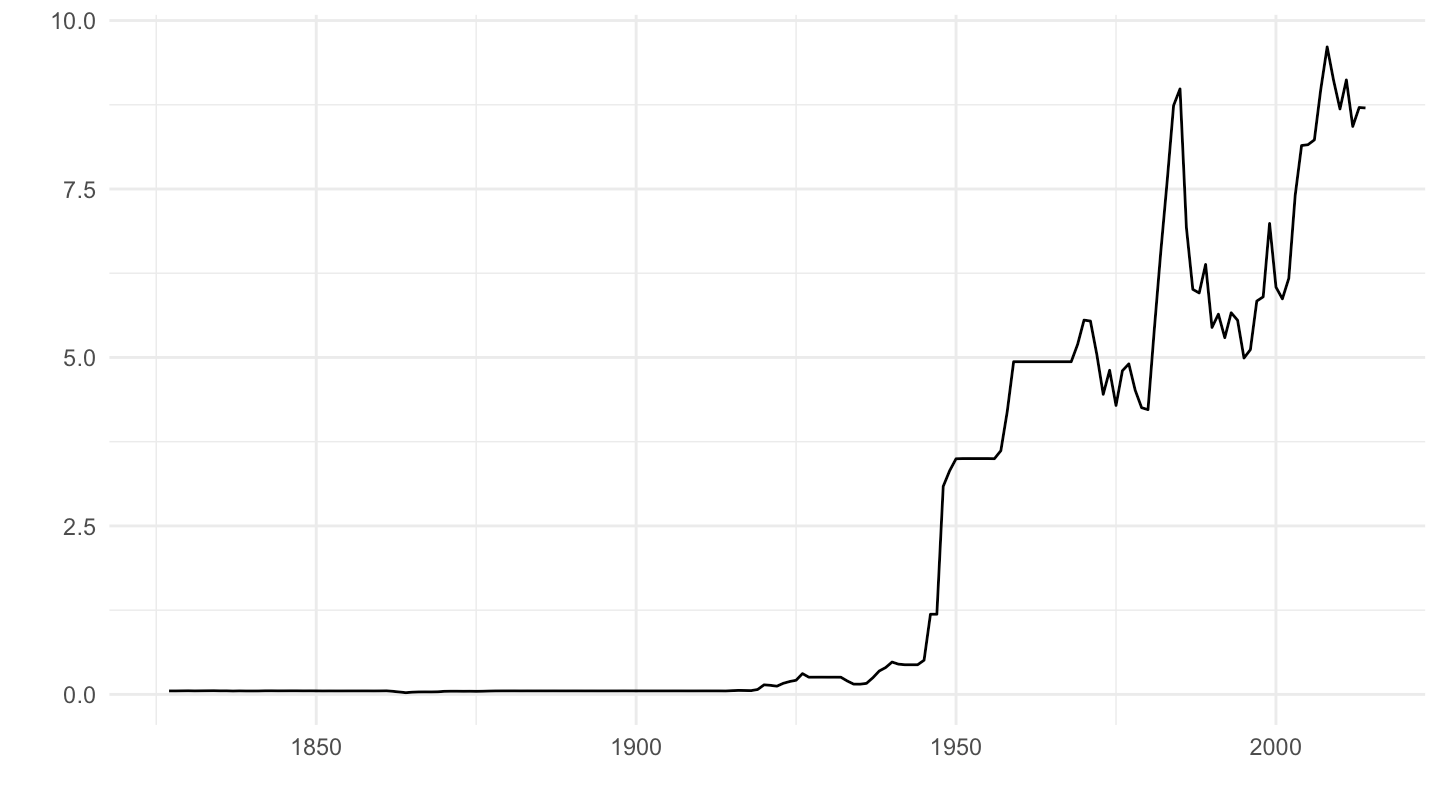
USA/FRA
1 dollar = 7 Francs
Code
bilateral_ER %>%
  filter(iso3c_reference == "FRA",
         iso3c == "USA") %>%
  ggplot + geom_line(aes(x = date, y = value)) +
  theme_minimal() + xlab("") + ylab("")
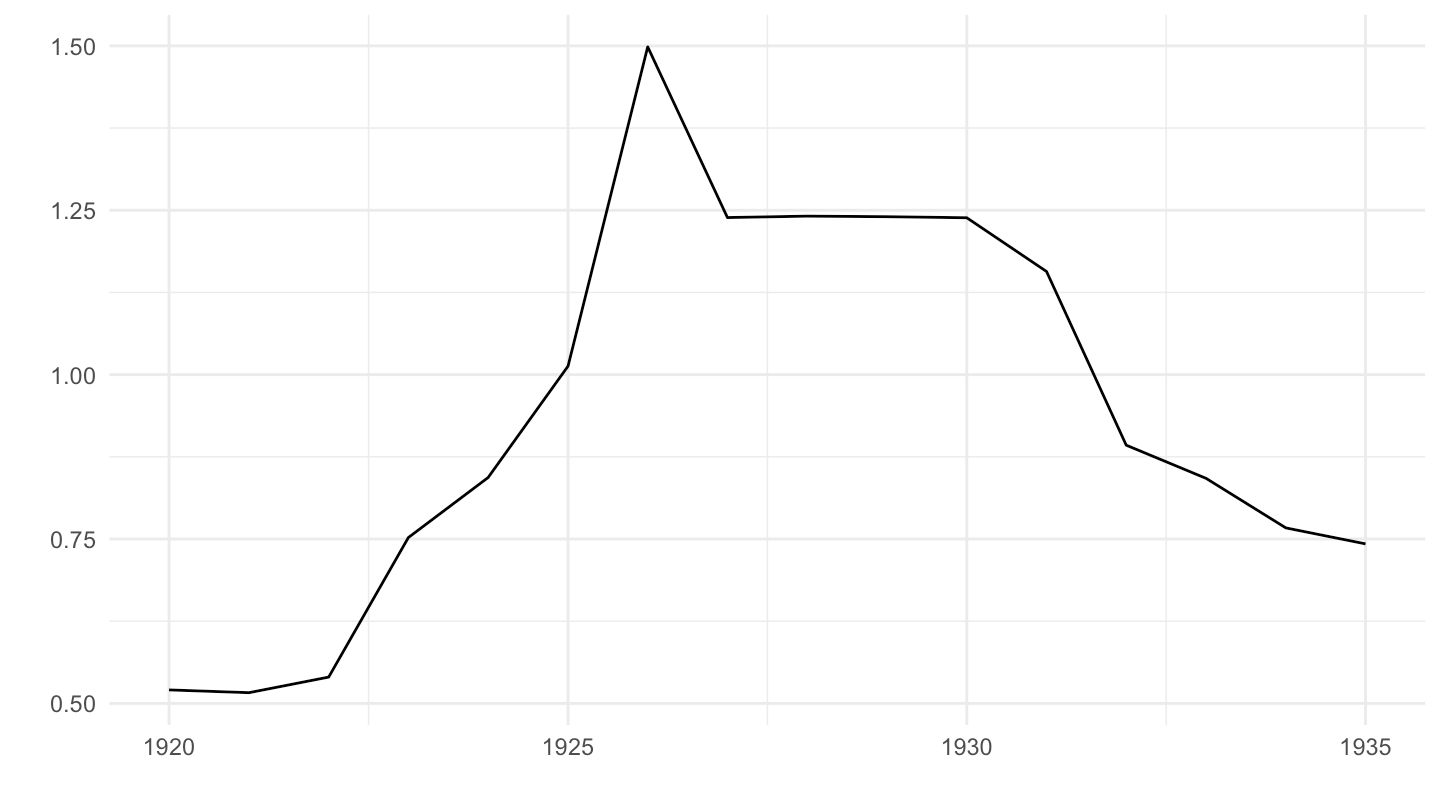
GBR/FRA
Code
bilateral_ER %>%
  filter(iso3c_reference == "FRA",
         iso3c == "GBR",
         date >= as.Date("1920-01-01"),
         date <= as.Date("1935-01-01")) %>%
  ggplot + geom_line(aes(x = date, y = value)) +
  theme_minimal() + xlab("") + ylab("")
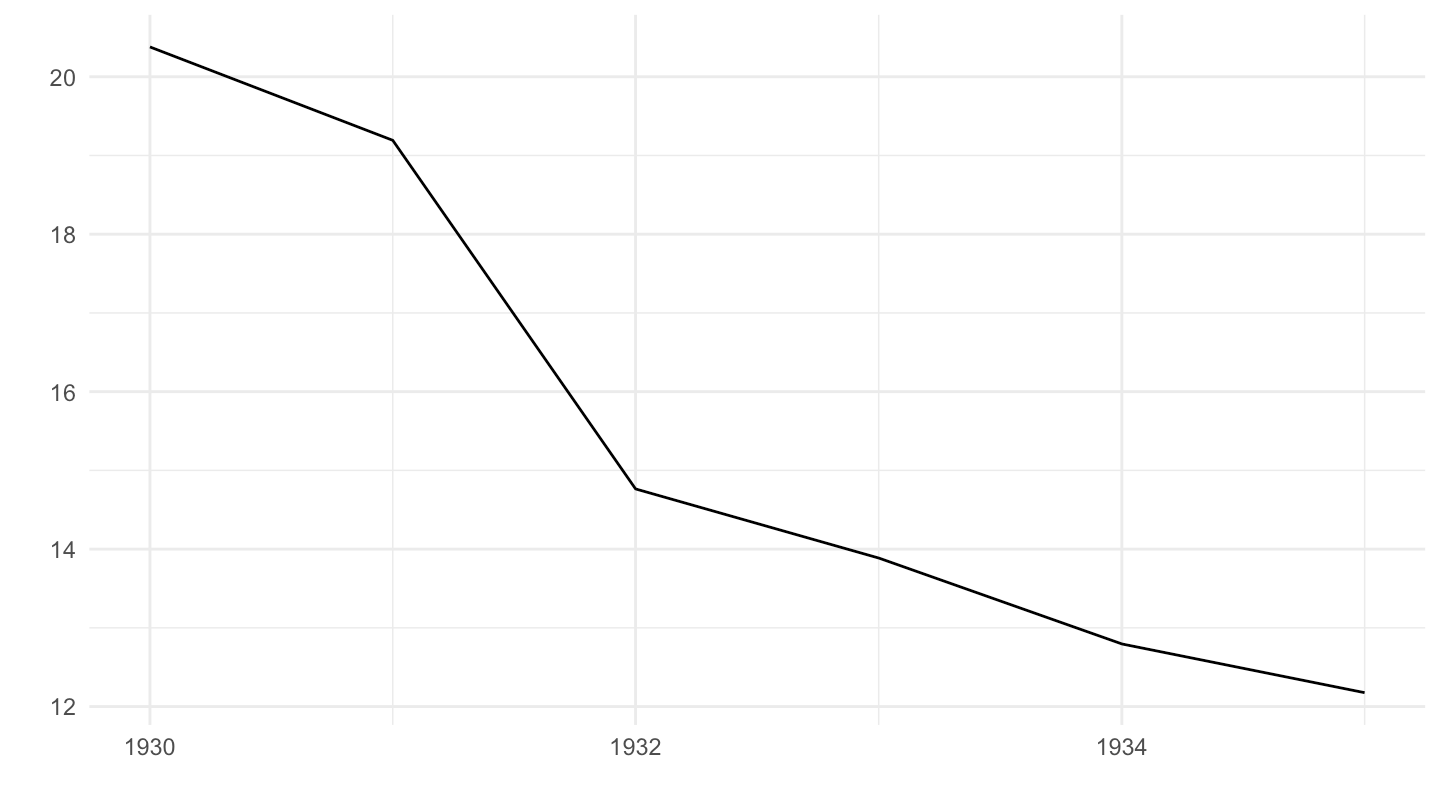
DEU/FRA
Depreciation of the Pound: out of the Gold Standard.
Code
bilateral_ER %>%
  filter(iso3c_reference == "DEU",
         iso3c == "GBR",
         date >= as.Date("1930-01-01"),
         date <= as.Date("1935-01-01")) %>%
  ggplot + geom_line(aes(x = date, y = value)) +
  theme_minimal() + xlab("") + ylab("")