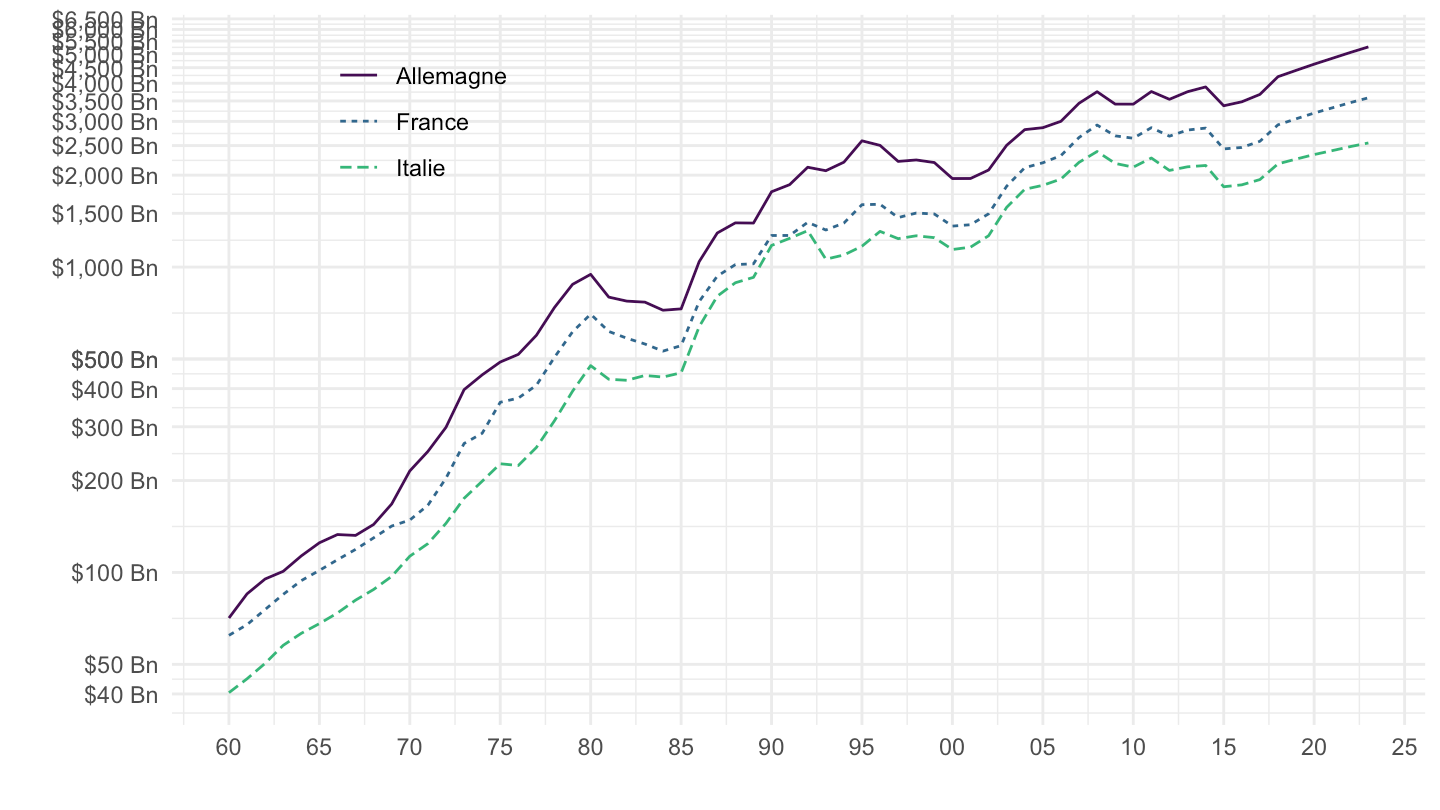
CHELEM_2018_PIB_VA_BvD_20180702 %>%
  filter(iso3c %in% c("FRA", "DEU", "ITA")) %>%
  left_join(iso3c, by = "iso3c") %>%
  ggplot() + theme_minimal() + scale_color_manual(values = viridis(4)[1:3]) +
  geom_line(aes(x = date, y = value/1000, color = Iso3c, linetype = Iso3c)) +
  scale_x_date(breaks = as.Date(paste0(seq(1960, 2025, 5), "-01-01")),
               labels = date_format("%y")) +
  theme(legend.position = c(0.2, 0.85),
        legend.title = element_blank()) +
  xlab("") + ylab("") +
  scale_y_log10(breaks = c(seq(0, 50, 10), seq(0, 500, 100), seq(0, 7000, 500)),
                labels = dollar_format(suffix = " Bn", accuracy = 1))