| LAST_DOWNLOAD |
|---|
| 2022-06-05 |
Consumer Price Index - Urban Wage Earners and Clerical Workers (Current Series) - CW
Data - BLS
Info
LAST_DOWNLOAD
LAST_COMPILE
| LAST_COMPILE |
|---|
| 2024-06-20 |
Last
| date | Nobs |
|---|---|
| 2022-04-01 | 62 |
cw.area
Code
cw.area %>%
  {if (is_html_output()) datatable(., filter = 'top', rownames = F) else .}
cw.item
Code
cw.item %>%
  {if (is_html_output()) datatable(., filter = 'top', rownames = F) else .}
cw.seasonal
Code
cw.seasonal %>%
{if (is_html_output()) print_table(.) else .}| seasonal_code | seasonal_text |
|---|---|
| S | Seasonally Adjusted |
| U | Not Seasonally Adjusted |
cw.periodicity
Code
cw.periodicity %>%
{if (is_html_output()) print_table(.) else .}| periodicity_code | periodicity_name |
|---|---|
| R | Monthly |
| S | Semi-Annual |
Longest Series (starting before 1950)
Code
cw.series %>%
  filter(begin_year <= 1950) %>%
  arrange(begin_year) %>%
  select(series_id, series_title, begin_year, end_year) %>%
  {if (is_html_output()) datatable(., filter = 'top', rownames = F) else .}
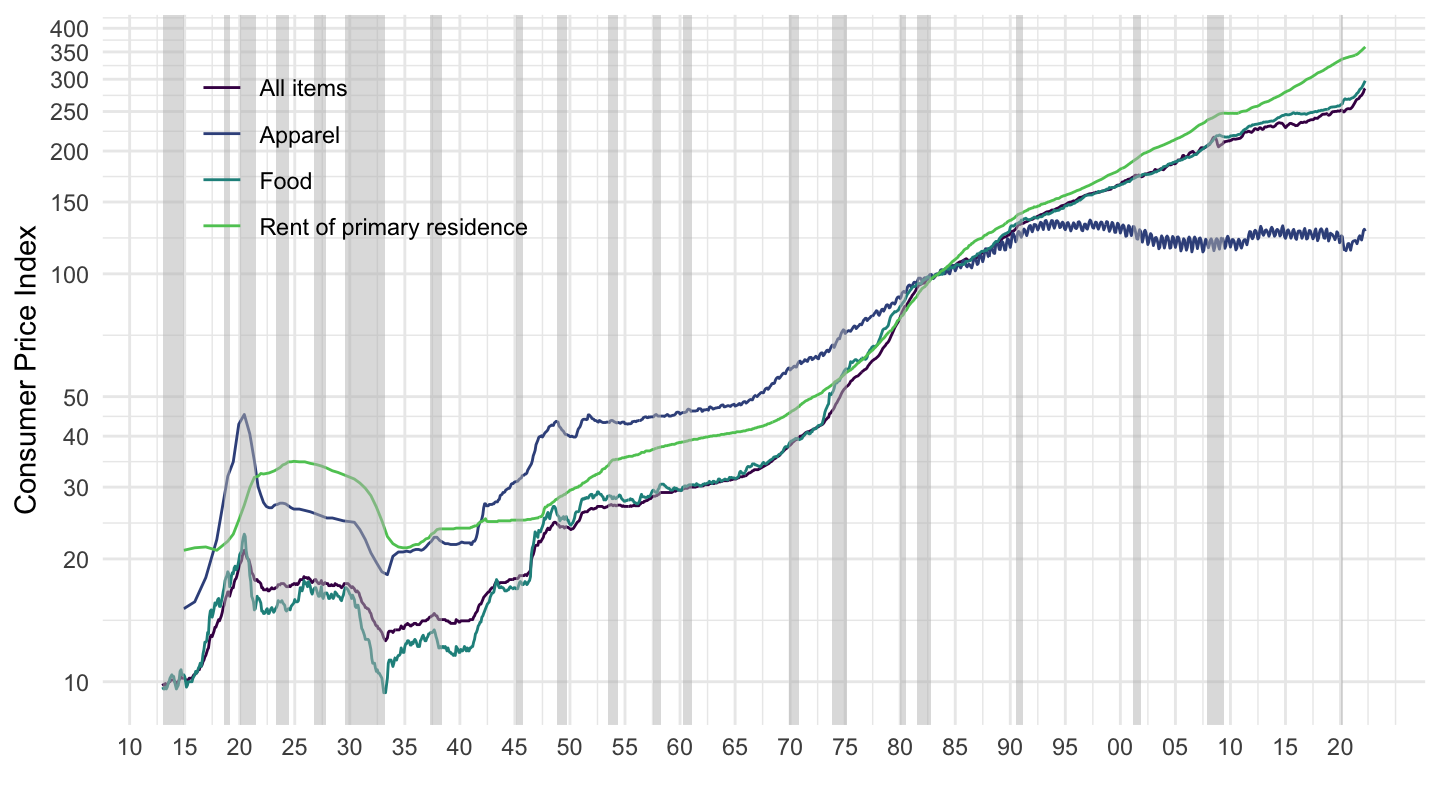
Longest Series
All
Code
cw.data.1.AllItems %>%
  bind_rows(cw.data.11.USFoodBeverage) %>%
  bind_rows(cw.data.12.USHousing) %>%
  bind_rows(cw.data.13.USApparel) %>%
  bind_rows(cw.data.14.USTransportation) %>%
  filter(series_id %in% c("CWUR0000SA0", "CWUR0000SAA",
                          "CWUR0000SAF1", "CWUR0000SEHA")) %>%
  left_join(cw.series, by = "series_id") %>%
  left_join(cw.item, by = "item_code") %>%
  month_to_date() %>%
  ggplot(.) + theme_minimal() + xlab("") +
  ylab("Consumer Price Index") +
  geom_line(aes(x = date, y = value, color = item_name)) +
  geom_rect(data = nber_recessions %>%
              filter(Trough >= as.Date("1914-01-01")),
            aes(xmin = Peak, xmax = Trough, ymin = 0, ymax = +Inf),
            fill = 'grey', alpha = 0.5) +
  scale_x_date(breaks = seq(1910, 2020, 5) %>% paste0("-01-01") %>% as.Date,
               labels = date_format("%y")) +
  scale_y_log10(breaks = c(seq(0, 50, 10), seq(100, 500, 50)),
                     labels = dollar_format(accuracy = 1, prefix = "")) +
  scale_color_manual(values = viridis(5)[1:4]) +
  theme(legend.position = c(0.2, 0.80),
        legend.title = element_blank())
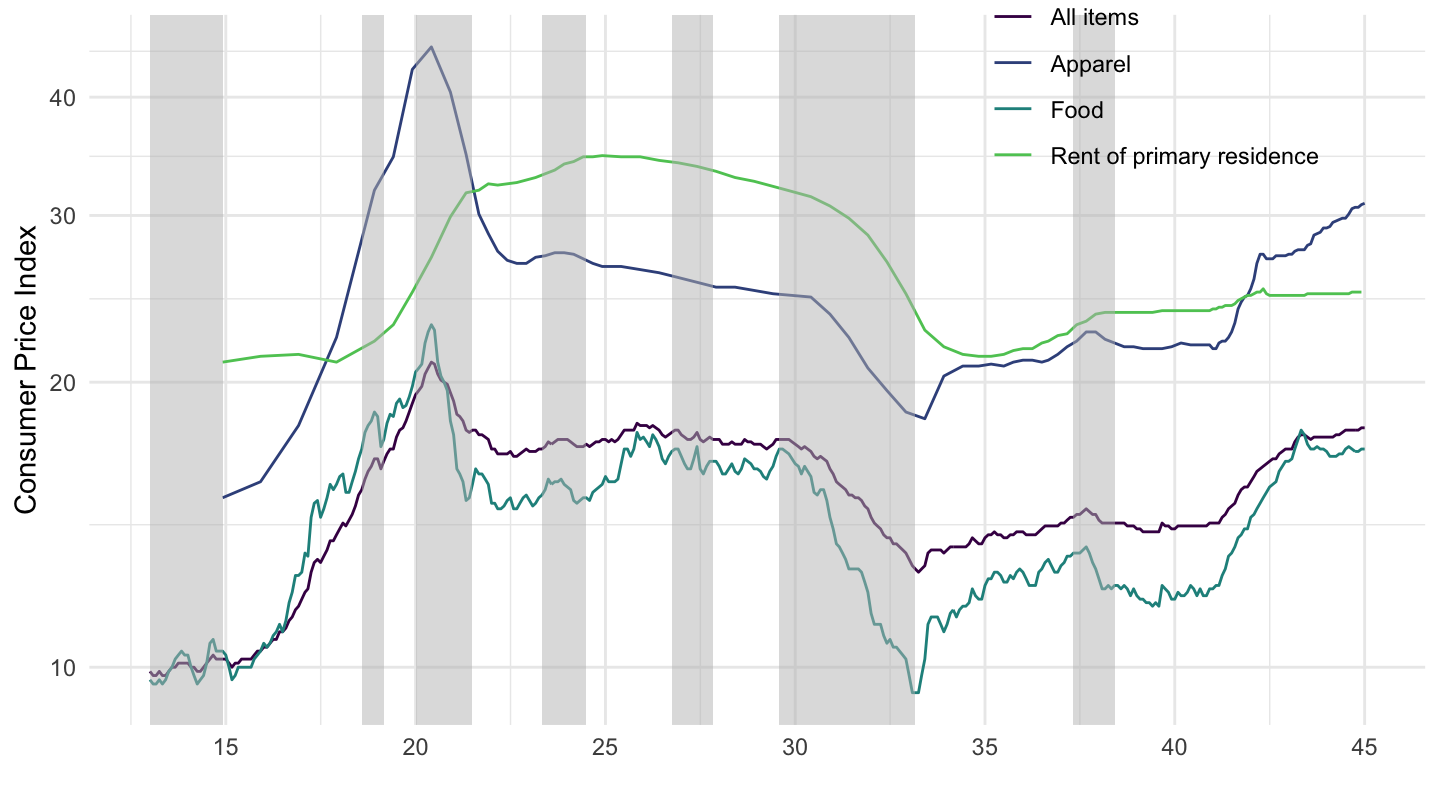
1914-1945
Code
cw.data.1.AllItems %>%
  bind_rows(cw.data.11.USFoodBeverage) %>%
  bind_rows(cw.data.12.USHousing) %>%
  bind_rows(cw.data.13.USApparel) %>%
  bind_rows(cw.data.14.USTransportation) %>%
  filter(series_id %in% c("CWUR0000SA0", "CWUR0000SAA",
                          "CWUR0000SAF1", "CWUR0000SEHA")) %>%
  left_join(cw.series, by = "series_id") %>%
  left_join(cw.item, by = "item_code") %>%
  month_to_date() %>%
  filter(date <= as.Date("1945-01-01")) %>%
  ggplot(.) + theme_minimal() + xlab("") +
  ylab("Consumer Price Index") +
  geom_line(aes(x = date, y = value, color = item_name)) +
  geom_rect(data = nber_recessions %>%
              filter(Peak <= as.Date("1945-01-01"),
                     Trough >= as.Date("1914-01-01")),
            aes(xmin = Peak, xmax = Trough, ymin = 0, ymax = +Inf),
            fill = 'grey', alpha = 0.5) +
  scale_x_date(breaks = seq(1910, 2020, 5) %>% paste0("-01-01") %>% as.Date,
               labels = date_format("%y")) +
  scale_y_log10(breaks = seq(-10, 500, 10),
                     labels = dollar_format(accuracy = 1, prefix = "")) +
  scale_color_manual(values = viridis(5)[1:4]) +
  theme(legend.position = c(0.8, 0.9),
        legend.title = element_blank())
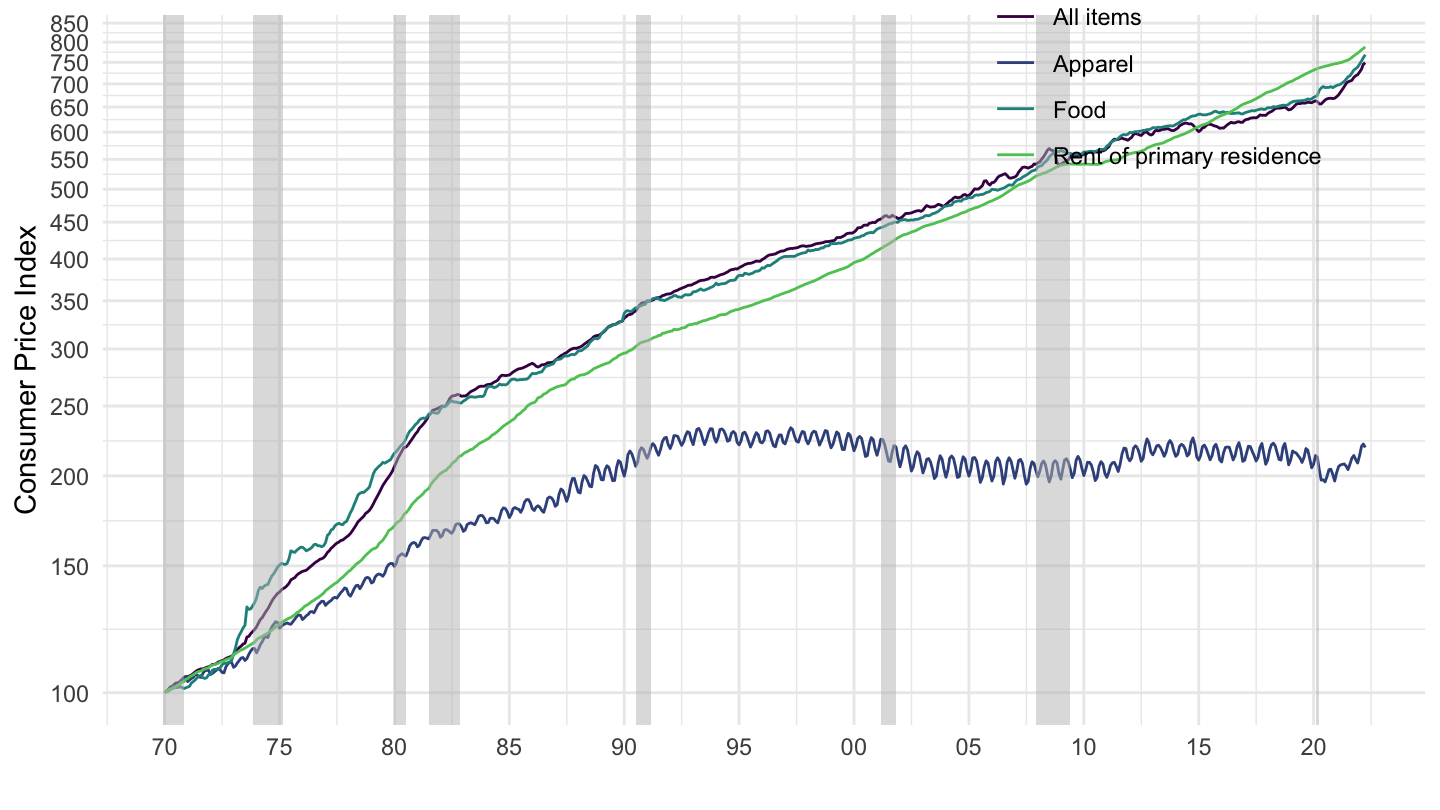
1970-
Code
cw.data.1.AllItems %>%
  bind_rows(cw.data.11.USFoodBeverage) %>%
  bind_rows(cw.data.12.USHousing) %>%
  bind_rows(cw.data.13.USApparel) %>%
  bind_rows(cw.data.14.USTransportation) %>%
  filter(series_id %in% c("CWUR0000SA0", "CWUR0000SAA",
                          "CWUR0000SAF1", "CWUR0000SEHA")) %>%
  left_join(cw.series, by = "series_id") %>%
  left_join(cw.item, by = "item_code") %>%
  month_to_date() %>%
  filter(date >= as.Date("1970-01-01")) %>%
  group_by(item_name) %>%
  arrange(date) %>%
  mutate(value = 100*value/value[1]) %>%
  ggplot(.) + theme_minimal() + xlab("") +
  ylab("Consumer Price Index") +
  geom_line(aes(x = date, y = value, color = item_name)) +
  geom_rect(data = nber_recessions %>%
              filter(Peak <= as.Date("2025-01-01"),
                     Trough >= as.Date("1970-01-01")),
            aes(xmin = Peak, xmax = Trough, ymin = 0, ymax = +Inf),
            fill = 'grey', alpha = 0.5) +
  scale_x_date(breaks = seq(1910, 2025, 5) %>% paste0("-01-01") %>% as.Date,
               labels = date_format("%y")) +
  scale_y_log10(breaks = seq(0, 1000, 50),
                     labels = dollar_format(accuracy = 1, prefix = "")) +
  scale_color_manual(values = viridis(5)[1:4]) +
  theme(legend.position = c(0.8, 0.9),
        legend.title = element_blank())
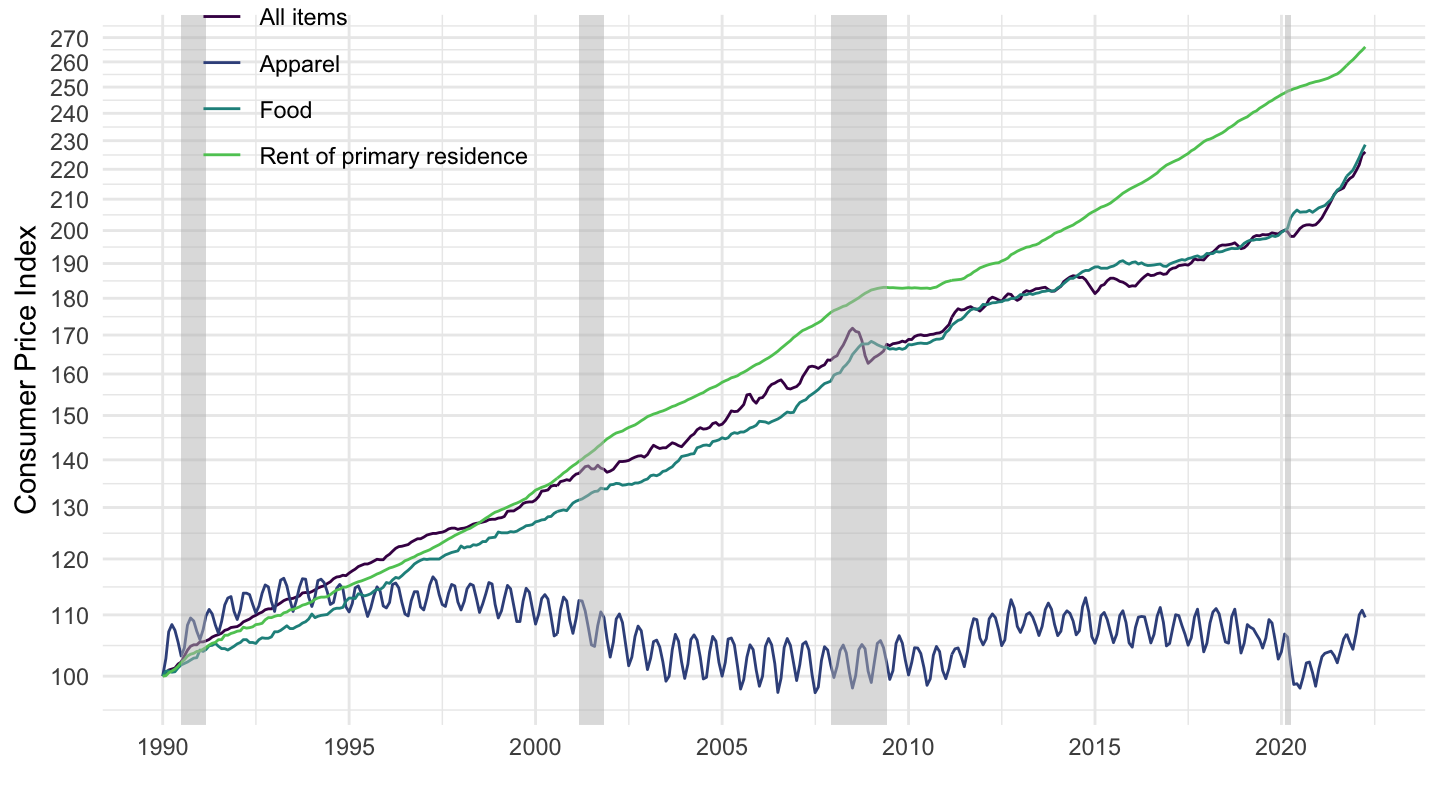
1990-
Code
cw.data.1.AllItems %>%
  bind_rows(cw.data.11.USFoodBeverage) %>%
  bind_rows(cw.data.12.USHousing) %>%
  bind_rows(cw.data.13.USApparel) %>%
  bind_rows(cw.data.14.USTransportation) %>%
  filter(series_id %in% c("CWUR0000SA0", "CWUR0000SAA",
                          "CWUR0000SAF1", "CWUR0000SEHA")) %>%
  left_join(cw.series, by = "series_id") %>%
  left_join(cw.item, by = "item_code") %>%
  month_to_date() %>%
  filter(date >= as.Date("1990-01-01")) %>%
  group_by(item_name) %>%
  arrange(date) %>%
  mutate(value = 100*value/value[1]) %>%
  ggplot(.) + theme_minimal() + xlab("") +
  ylab("Consumer Price Index") +
  geom_line(aes(x = date, y = value, color = item_name)) +
  geom_rect(data = nber_recessions %>%
              filter(Peak <= as.Date("2025-01-01"),
                     Trough >= as.Date("1990-01-01")),
            aes(xmin = Peak, xmax = Trough, ymin = 0, ymax = +Inf),
            fill = 'grey', alpha = 0.5) +
  scale_x_date(breaks = seq(1910, 2025, 5) %>% paste0("-01-01") %>% as.Date,
               labels = date_format("%Y")) +
  scale_y_log10(breaks = seq(0, 1000, 10),
                     labels = dollar_format(accuracy = 1, prefix = "")) +
  scale_color_manual(values = viridis(5)[1:4]) +
  theme(legend.position = c(0.2, 0.9),
        legend.title = element_blank())