| LAST_COMPILE |
|---|
| 2026-07-26 |
Credit to the non-financial sector
Data - BIS
Info
LAST_COMPILE
Last
| date | Nobs |
|---|---|
| 2023-04-01 | 1133 |
| 2023-01-01 | 1133 |
TC_LENDERS, Lending sector
Code
TOTAL_CREDIT %>%
  group_by(TC_LENDERS, `Lending sector`) %>%
  summarise(Nobs = n()) %>%
  arrange(-Nobs) %>%
print_table_conditional()| TC_LENDERS | Lending sector | Nobs |
|---|---|---|
| A | All sectors | 136165 |
| B | Banks, domestic | 38137 |
TC_BORROWERS, Borrowing sector
Code
TOTAL_CREDIT %>%
  group_by(TC_BORROWERS, `Borrowing sector`) %>%
  summarise(Nobs = n()) %>%
  arrange(-Nobs) %>%
print_table_conditional()| TC_BORROWERS | Borrowing sector | Nobs |
|---|---|---|
| P | Private non-financial sector | 76571 |
| G | General government | 27944 |
| H | Households & NPISHs | 26375 |
| N | Non-financial corporations | 26048 |
| C | Non financial sector | 17364 |
VALUATION, Valuation
Code
TOTAL_CREDIT %>%
  group_by(VALUATION, `Valuation method`) %>%
  summarise(Nobs = n()) %>%
  arrange(-Nobs) %>%
print_table_conditional()| VALUATION | Valuation method | Nobs |
|---|---|---|
| M | Market value | 157575 |
| N | Nominal value | 16727 |
TC_ADJUST, Type of adjustment
Code
TOTAL_CREDIT %>%
  group_by(TC_ADJUST, `Adjustment`) %>%
  summarise(Nobs = n()) %>%
  arrange(-Nobs) %>%
print_table_conditional()| TC_ADJUST | Adjustment | Nobs |
|---|---|---|
| A | Adjusted for breaks | 142415 |
| U | Unadjusted | 31887 |
iso3c, iso2c, Borrowers’ country
Code
TOTAL_CREDIT %>%
  arrange(iso3c, date) %>%
  group_by(iso3c, iso2c, `Borrowers' country`) %>%
  summarise(Nobs = n(),
            start = first(date),
            end = last(date)) %>%
  arrange(-Nobs) %>%
  mutate(Flag = gsub(" ", "-", str_to_lower(`Borrowers' country`)),
         Flag = paste0('<img src="../../bib/flags/vsmall/', Flag, '.png" alt="Flag">')) %>%
  select(Flag, everything()) %>%
  {if (is_html_output()) datatable(., filter = 'top', rownames = F, escape = F) else .}
FREQ, Frequency
Code
TOTAL_CREDIT %>%
  group_by(FREQ, Frequency) %>%
  summarise(Nobs = n()) %>%
  arrange(-Nobs) %>%
{if (is_html_output()) print_table(.) else .}| FREQ | Frequency | Nobs |
|---|---|---|
| Q | Quarterly | 174302 |
UNIT_TYPE, Unit type
Code
TOTAL_CREDIT %>%
  group_by(UNIT_TYPE, `Unit type`) %>%
  summarise(Nobs = n()) %>%
  arrange(-Nobs) %>%
{if (is_html_output()) print_table(.) else .}| UNIT_TYPE | Unit type | Nobs |
|---|---|---|
| XDC | Domestic currency (incl. conv. to current ccy made using a fix parity) | 77951 |
| USD | US dollar | 47282 |
| 770 | Percentage of GDP | 46748 |
| 799 | Percentage of GDP (using PPP exchange rates) | 2321 |
All
Sweden
All
Code
TOTAL_CREDIT %>%
  filter(iso2c %in% c("SE"),
         UNIT_TYPE == "770",
         TC_LENDERS == "A",
         VALUATION == "M",
         TC_ADJUST == "A") %>%
  ggplot(.) + theme_minimal() + xlab("") + ylab("Credit to GDP (% of GDP)") +
  geom_line(aes(x = date, y = value/100, color = `Borrowing sector`)) +
  scale_x_date(breaks = seq(1940, 2100, 5) %>% paste0("-01-01") %>% as.Date,
               labels = date_format("%Y")) +
  scale_y_continuous(breaks = 0.01*seq(0, 700, 25),
                labels = percent_format(accuracy = 1)) +
  scale_color_manual(values = viridis(6)[1:5]) +
  theme(legend.position = c(0.2, 0.75),
        legend.title = element_blank())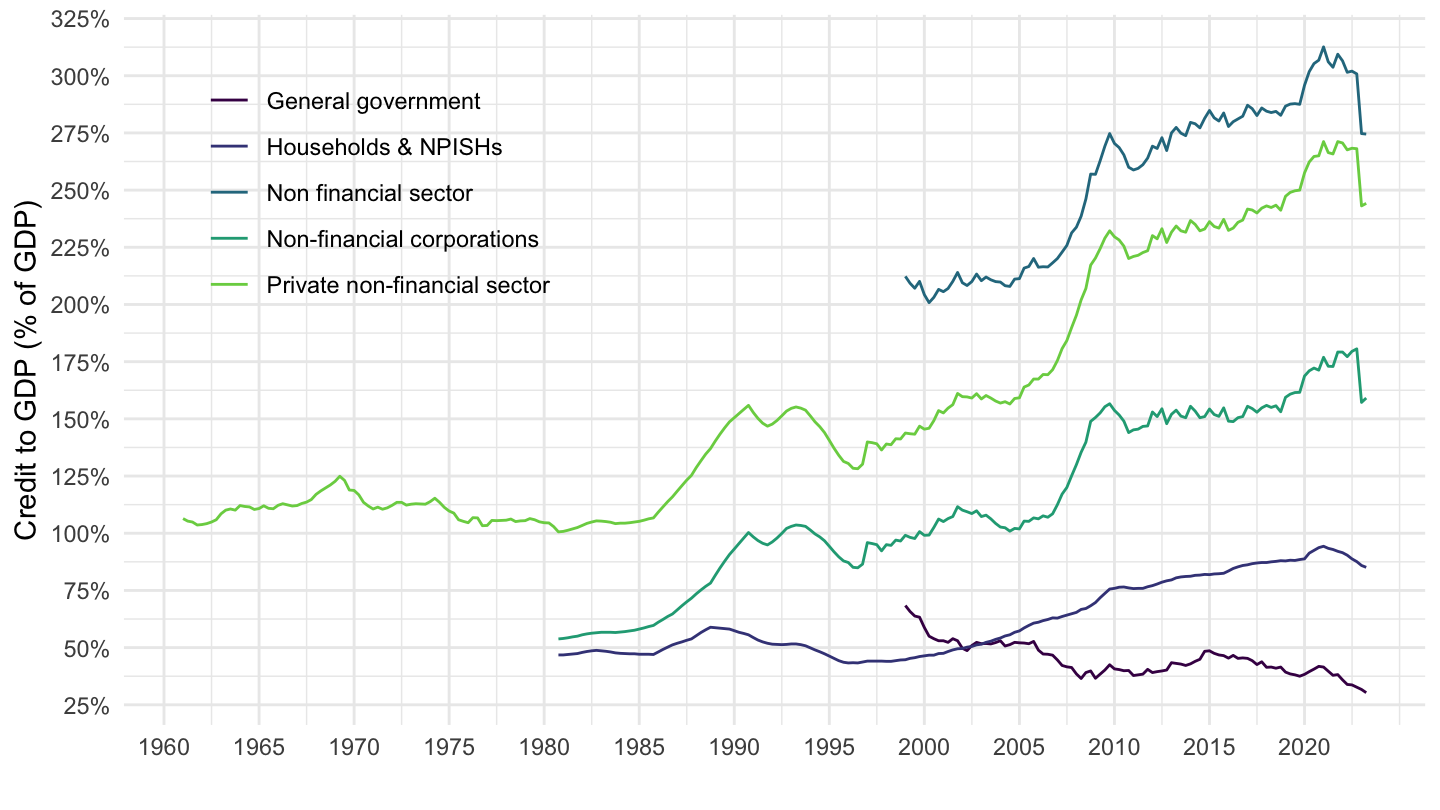
1980-2000
Code
TOTAL_CREDIT %>%
  filter(iso2c %in% c("SE"),
         UNIT_TYPE == "770",
         TC_LENDERS == "A",
         VALUATION == "M",
         TC_ADJUST == "A",
         date >= as.Date("1980-01-01"),
         date <= as.Date("1998-01-01")) %>%
  ggplot(.) + theme_minimal() + xlab("") + ylab("Credit to GDP (% of GDP)") +
  geom_line(aes(x = date, y = value/100, color = `Borrowing sector`)) +
  scale_x_date(breaks = seq(1940, 2100, 2) %>% paste0("-01-01") %>% as.Date,
               labels = date_format("%Y")) +
  scale_y_continuous(breaks = 0.01*seq(0, 700, 10),
                labels = percent_format(accuracy = 1)) +
  scale_color_manual(values = viridis(4)[1:3]) +
  theme(legend.position = c(0.2, 0.85),
        legend.title = element_blank())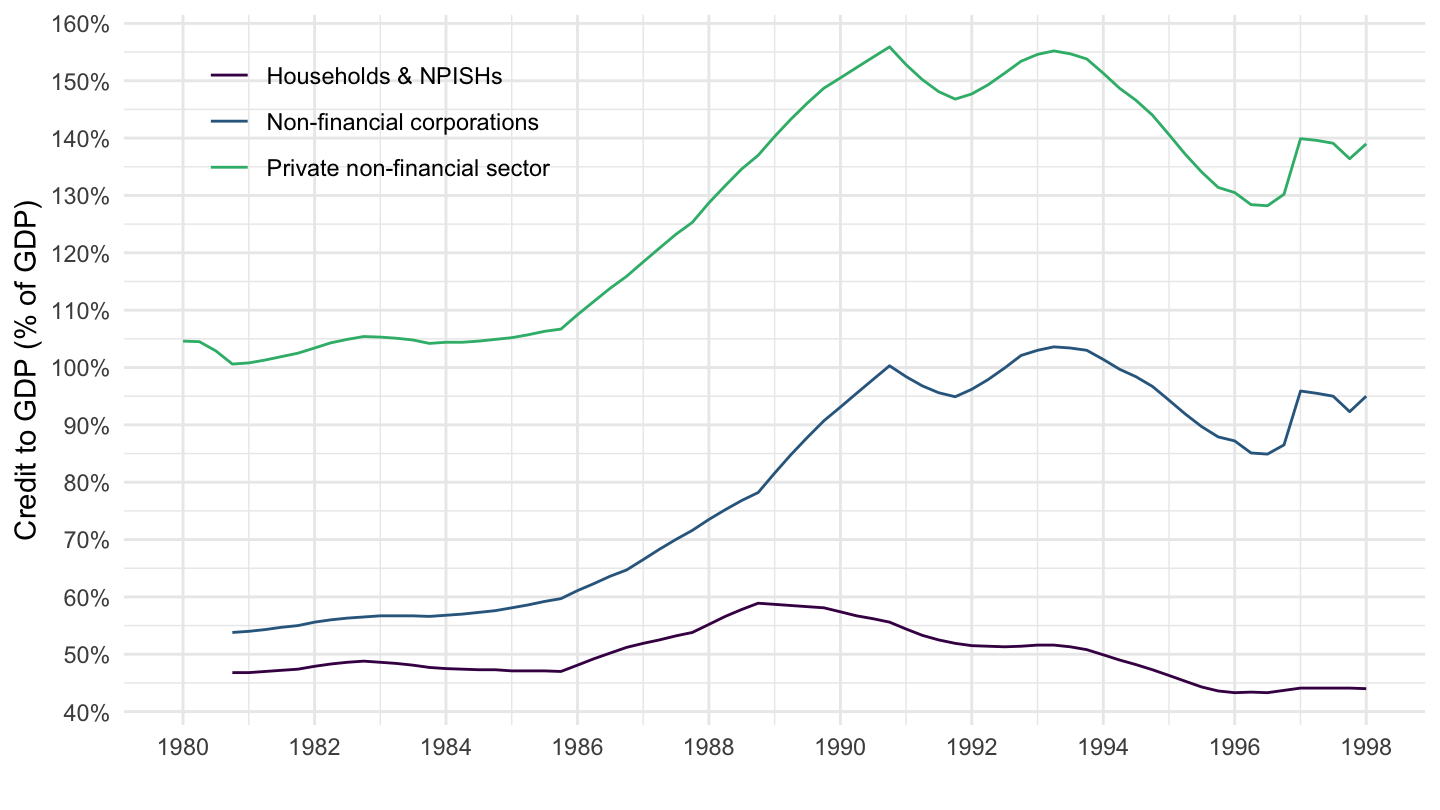
Peru
Code
TOTAL_CREDIT %>%
  filter(iso2c %in% c("PE"),
         UNIT_TYPE == "770",
         TC_LENDERS == "A",
         VALUATION == "M",
         TC_ADJUST == "A") %>%
  ggplot(.) + theme_minimal() + xlab("") + ylab("Credit to GDP (% of GDP)") +
  geom_line(aes(x = date, y = value/100, color = `Borrowing sector`)) +
  scale_x_date(breaks = seq(1940, 2100, 5) %>% paste0("-01-01") %>% as.Date,
               labels = date_format("%Y")) +
  scale_y_continuous(breaks = 0.01*seq(0, 700, 25),
                labels = percent_format(accuracy = 1)) +
  scale_color_manual(values = viridis(6)[1:5]) +
  theme(legend.position = c(0.2, 0.75),
        legend.title = element_blank())
Netherlands
Code
TOTAL_CREDIT %>%
  filter(iso2c %in% c("NL"),
         UNIT_TYPE == "770",
         TC_LENDERS == "A",
         VALUATION == "M",
         TC_ADJUST == "A") %>%
  ggplot(.) + theme_minimal() + xlab("") + ylab("Credit to GDP (% of GDP)") +
  geom_line(aes(x = date, y = value/100, color = `Borrowing sector`)) +
  scale_x_date(breaks = seq(1940, 2100, 5) %>% paste0("-01-01") %>% as.Date,
               labels = date_format("%Y")) +
  scale_y_continuous(breaks = 0.01*seq(0, 700, 25),
                labels = percent_format(accuracy = 1)) +
  scale_color_manual(values = viridis(6)[1:5]) +
  theme(legend.position = c(0.2, 0.75),
        legend.title = element_blank())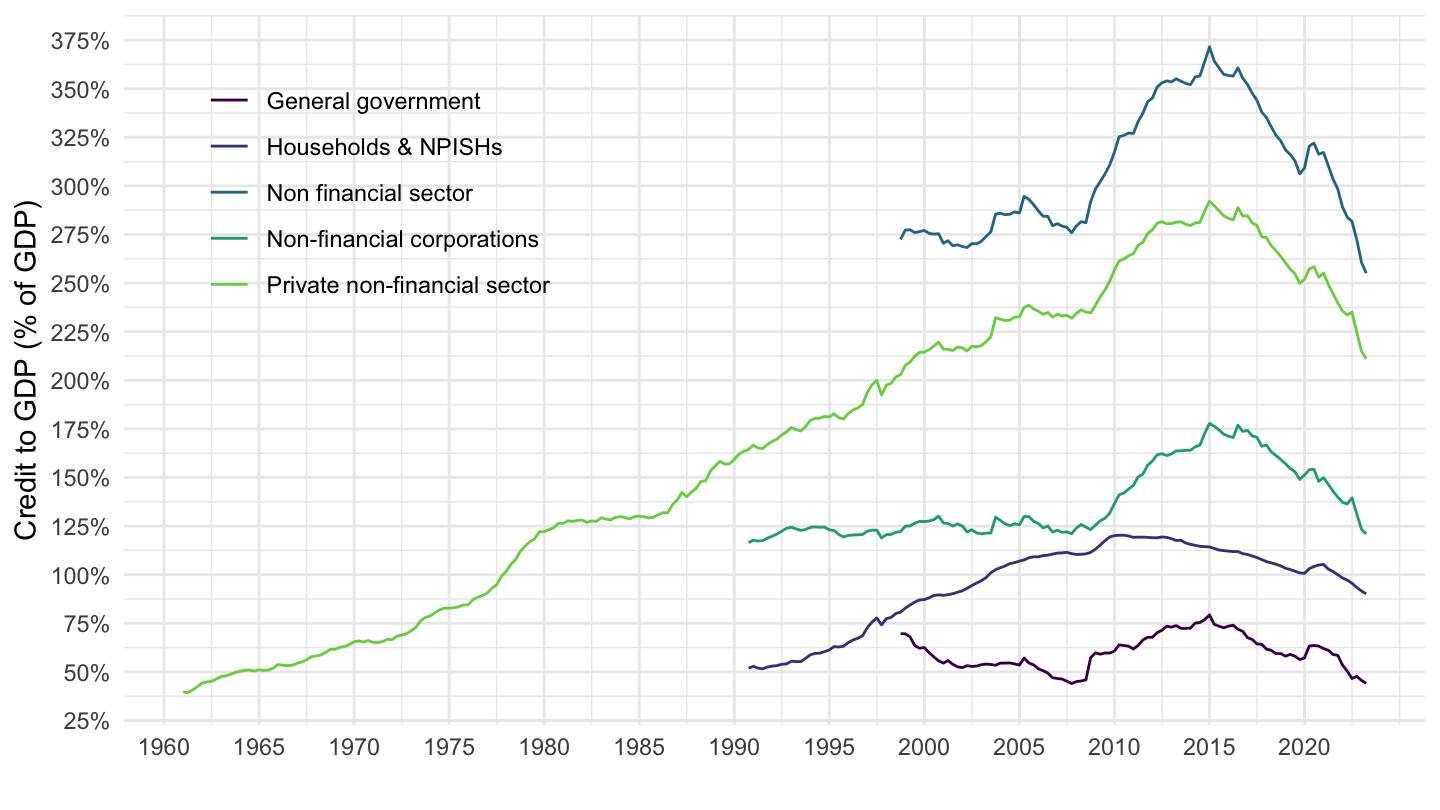
Denmark
Code
TOTAL_CREDIT %>%
  filter(iso2c %in% c("DK"),
         UNIT_TYPE == "770",
         TC_LENDERS == "A",
         VALUATION == "M",
         TC_ADJUST == "A") %>%
  ggplot(.) + theme_minimal() + xlab("") + ylab("Credit to GDP (% of GDP)") +
  geom_line(aes(x = date, y = value/100, color = `Borrowing sector`)) +
  scale_x_date(breaks = seq(1940, 2100, 5) %>% paste0("-01-01") %>% as.Date,
               labels = date_format("%Y")) +
  scale_y_continuous(breaks = 0.01*seq(0, 700, 25),
                labels = percent_format(accuracy = 1)) +
  scale_color_manual(values = viridis(6)[1:5]) +
  theme(legend.position = c(0.2, 0.75),
        legend.title = element_blank())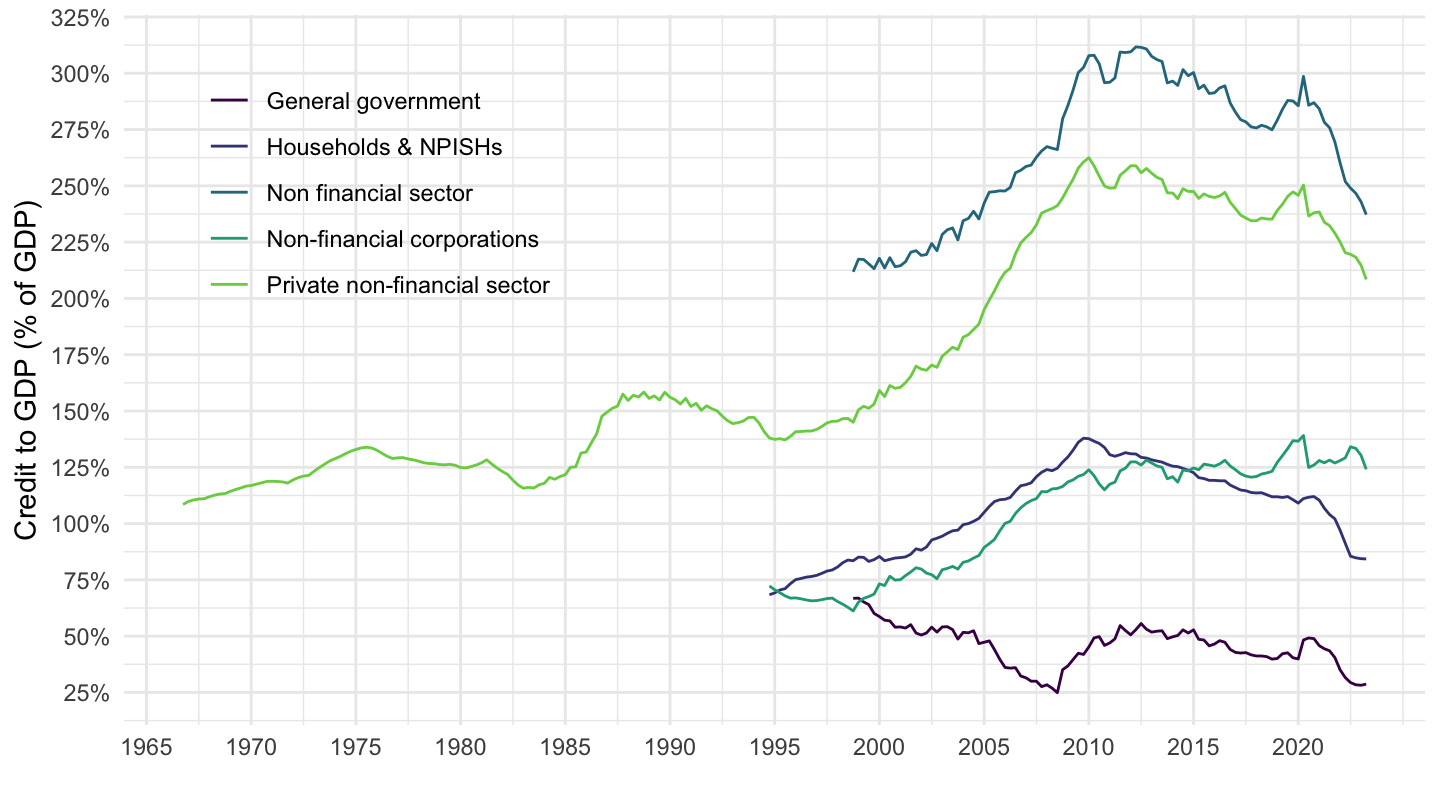
France
Code
TOTAL_CREDIT %>%
  filter(iso2c %in% c("FR"),
         UNIT_TYPE == "770",
         TC_LENDERS == "A",
         VALUATION == "M",
         TC_ADJUST == "A") %>%
  ggplot(.) + theme_minimal() + xlab("") + ylab("Credit to GDP (% of GDP)") +
  geom_line(aes(x = date, y = value/100, color = `Borrowing sector`)) +
  scale_x_date(breaks = seq(1940, 2100, 5) %>% paste0("-01-01") %>% as.Date,
               labels = date_format("%Y")) +
  scale_y_continuous(breaks = 0.01*seq(0, 700, 25),
                labels = percent_format(accuracy = 1)) +
  scale_color_manual(values = viridis(6)[1:5]) +
  theme(legend.position = c(0.2, 0.75),
        legend.title = element_blank())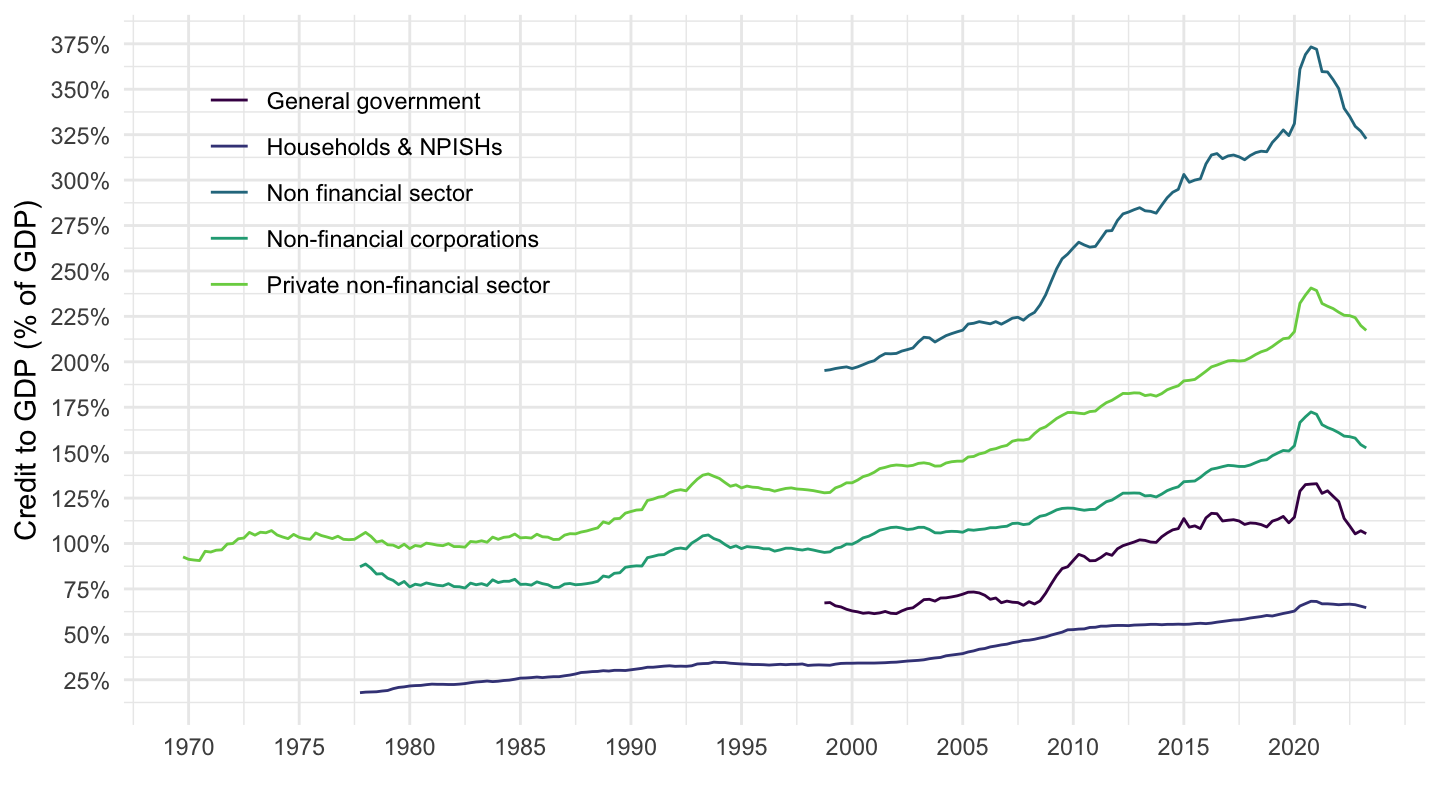
United States
Code
TOTAL_CREDIT %>%
  filter(iso2c %in% c("US"),
         UNIT_TYPE == "770",
         TC_LENDERS == "A",
         VALUATION == "M",
         TC_ADJUST == "A") %>%
  ggplot(.) + theme_minimal() + xlab("") + ylab("Credit to GDP (% of GDP)") +
  geom_line(aes(x = date, y = value/100, color = `Borrowing sector`)) +
  scale_x_date(breaks = seq(1940, 2100, 5) %>% paste0("-01-01") %>% as.Date,
               labels = date_format("%Y")) +
  scale_y_continuous(breaks = 0.01*seq(0, 700, 25),
                labels = percent_format(accuracy = 1)) +
  scale_color_manual(values = viridis(6)[1:5]) +
  theme(legend.position = c(0.2, 0.75),
        legend.title = element_blank())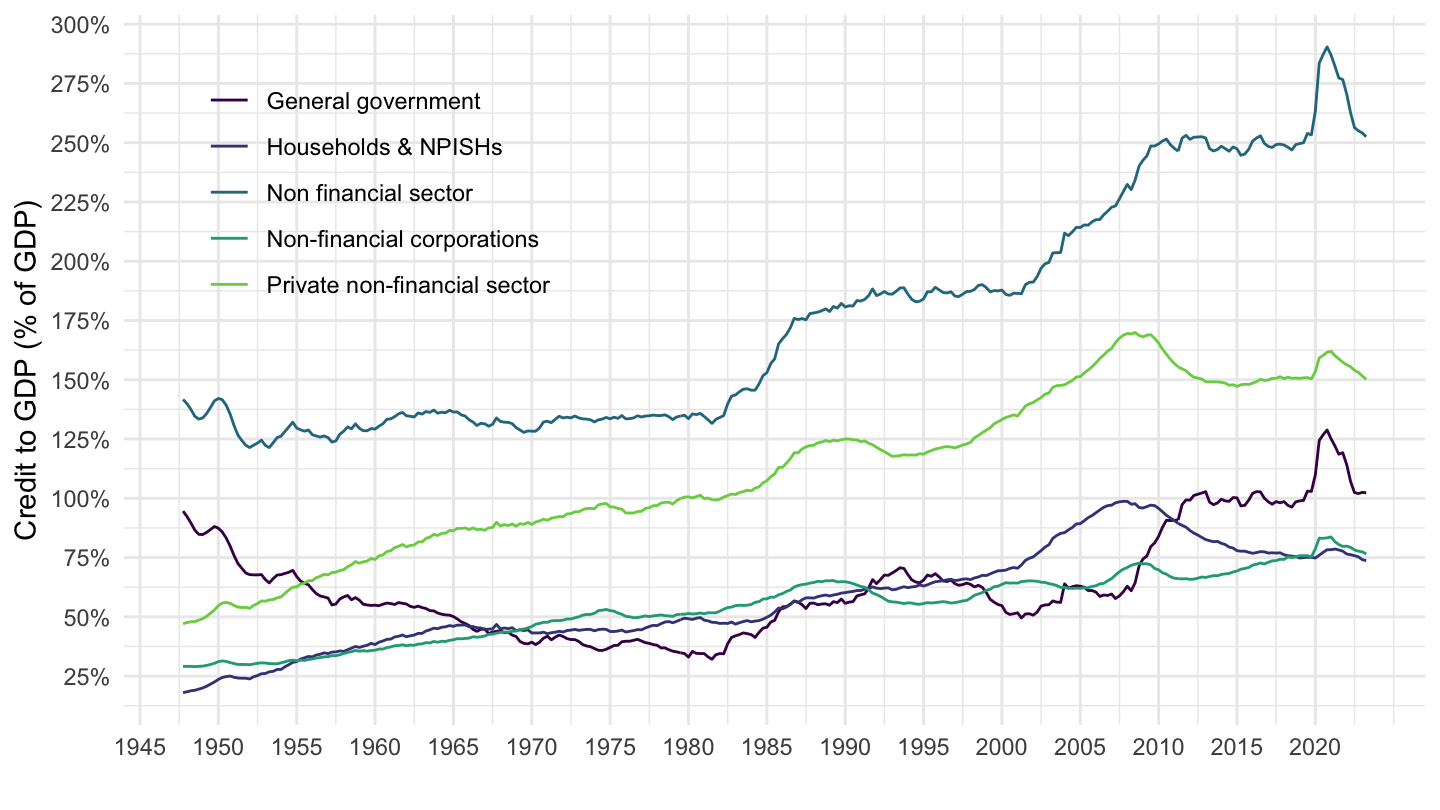
Korea
All
Code
TOTAL_CREDIT %>%
  filter(iso2c %in% c("KR"),
         UNIT_TYPE == "770",
         TC_LENDERS == "A",
         TC_BORROWERS %in% c("G", "H", "N"),
         VALUATION == "M",
         TC_ADJUST == "A") %>%
  left_join(tibble(TC_BORROWERS = c("G", "H", "N"),
                   Tc_borrowers = c("Dette publique", "Dette des ménages", "Dette des entreprises"))) %>%
  ggplot(.) + theme_minimal() + xlab("") + ylab("Dette / PIB en Corée du Sud (en % ou plutôt années de PIB)") +
  geom_line(aes(x = date, y = value/100, color = Tc_borrowers)) +
  scale_x_date(breaks = seq(1940, 2100, 5) %>% paste0("-01-01") %>% as.Date,
               labels = date_format("%Y")) +
  scale_color_manual(values = viridis(4)[1:3]) +
  scale_y_continuous(breaks = 0.01*seq(0, 700, 10),
                labels = percent_format(accuracy = 10, p = "")) +
  theme(legend.position = c(0.15, 0.85),
        legend.title = element_blank())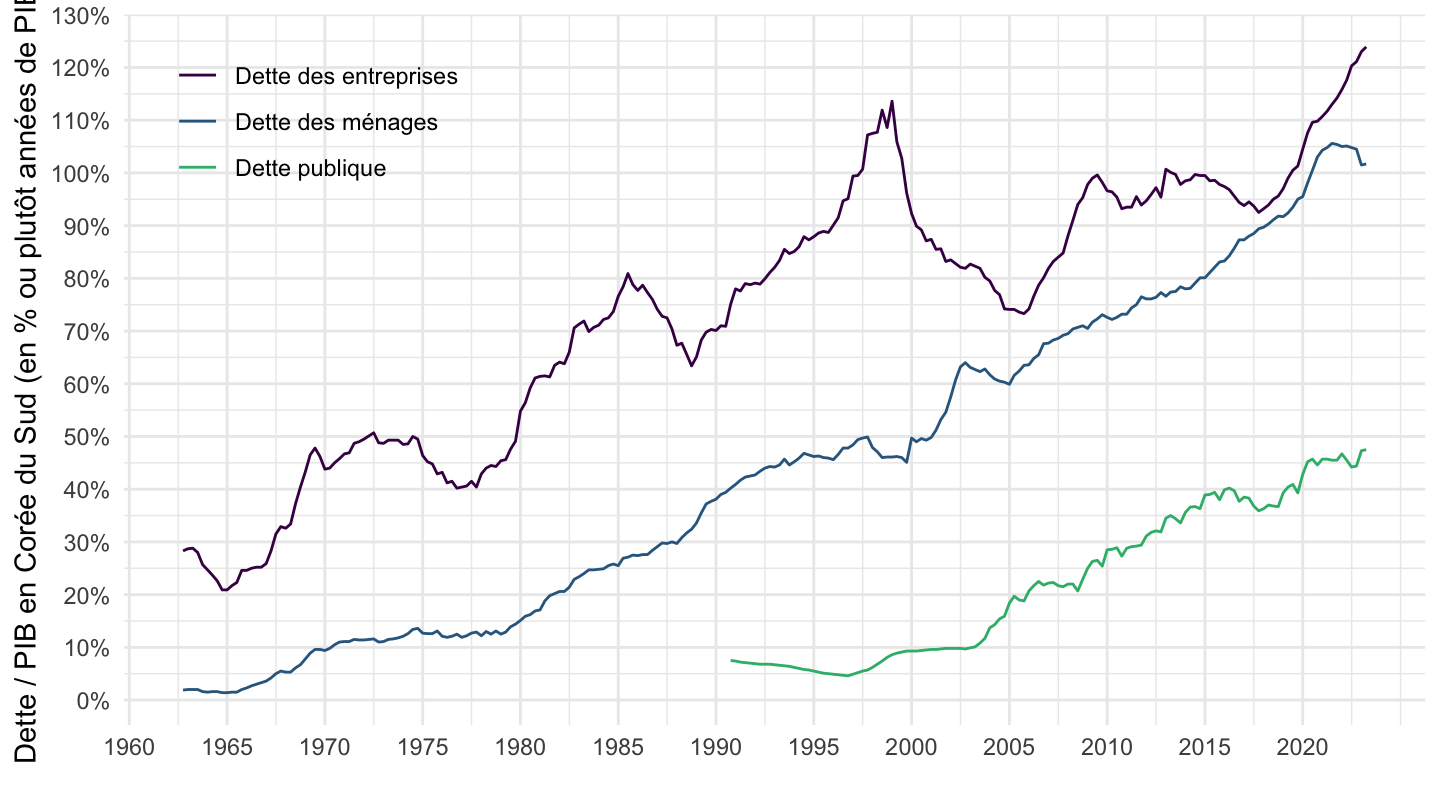
1990-
Code
TOTAL_CREDIT %>%
  filter(iso2c %in% c("KR"),
         UNIT_TYPE == "770",
         TC_LENDERS == "A",
         TC_BORROWERS %in% c("G", "H", "N"),
         date >= as.Date("1990-01-01"),
         VALUATION == "M",
         TC_ADJUST == "A") %>%
  left_join(tibble(TC_BORROWERS = c("G", "H", "N"),
                   Tc_borrowers = c("Dette publique", "Dette des ménages", "Dette des entreprises"))) %>%
  ggplot(.) + theme_minimal() + xlab("") + ylab("Dette / PIB en Corée du Sud (en % ou plutôt années de PIB)") +
  geom_line(aes(x = date, y = value/100, color = Tc_borrowers)) +
  scale_x_date(breaks = seq(1940, 2100, 5) %>% paste0("-01-01") %>% as.Date,
               labels = date_format("%Y")) +
  scale_color_manual(values = viridis(4)[1:3]) +
  scale_y_continuous(breaks = 0.01*seq(0, 700, 10),
                labels = percent_format(accuracy = 10, p = "")) +
  theme(legend.position = c(0.15, 0.85),
        legend.title = element_blank())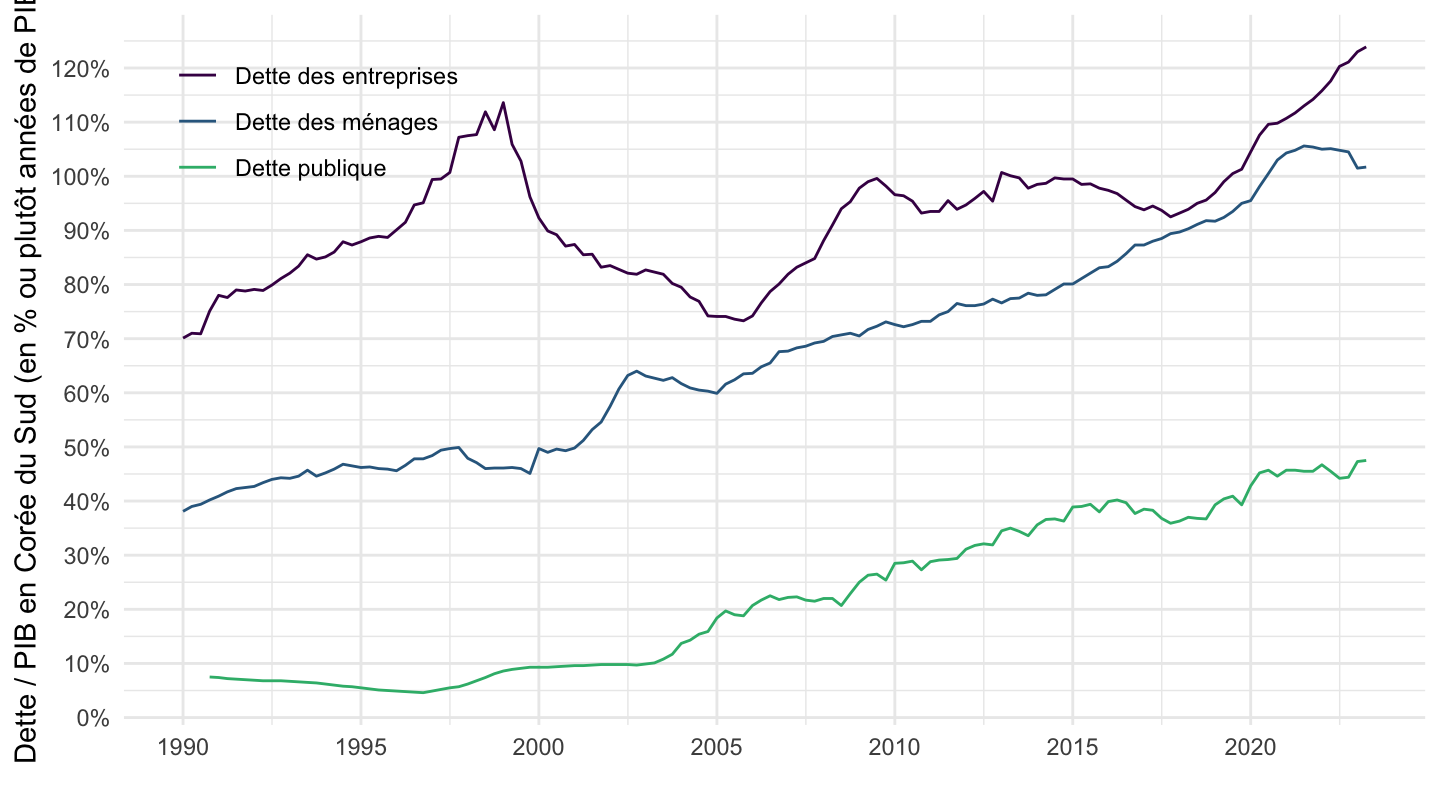
2005-
Code
TOTAL_CREDIT %>%
  filter(iso2c %in% c("KR"),
         UNIT_TYPE == "770",
         TC_LENDERS == "A",
         TC_BORROWERS %in% c("G", "H", "N"),
         date >= as.Date("2005-01-01"),
         VALUATION == "M",
         TC_ADJUST == "A") %>%
  left_join(tibble(TC_BORROWERS = c("G", "H", "N"),
                   Tc_borrowers = c("Dette publique", "Dette des ménages", "Dette des entreprises"))) %>%
  ggplot(.) + theme_minimal() + xlab("") + ylab("Dette / PIB en Corée du Sud (en % ou plutôt années de PIB)") +
  geom_line(aes(x = date, y = value/100, color = Tc_borrowers)) +
  scale_x_date(breaks = seq(1940, 2100, 2) %>% paste0("-01-01") %>% as.Date,
               labels = date_format("%Y")) +
  scale_color_manual(values = viridis(4)[1:3]) +
  scale_y_continuous(breaks = 0.01*seq(0, 700, 10),
                labels = percent_format(accuracy = 10, p = "")) +
  theme(legend.position = c(0.15, 0.85),
        legend.title = element_blank())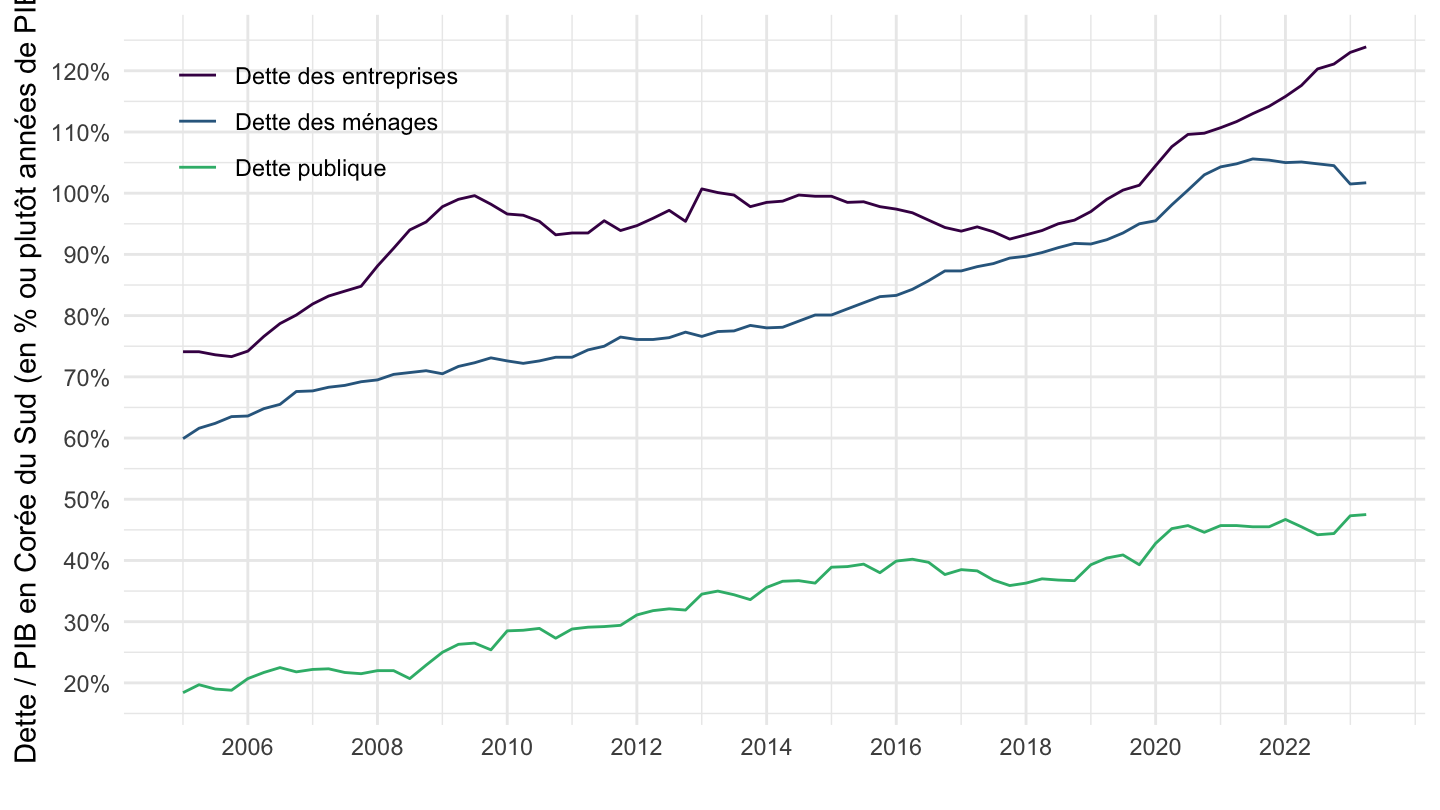
Spain
Code
TOTAL_CREDIT %>%
  filter(iso2c %in% c("ES"),
         UNIT_TYPE == "770",
         TC_LENDERS == "A",
         VALUATION == "M",
         TC_ADJUST == "A") %>%
  ggplot(.) + theme_minimal() + xlab("") + ylab("Credit to GDP (% of GDP)") +
  geom_line(aes(x = date, y = value/100, color = `Borrowing sector`)) +
  scale_x_date(breaks = seq(1940, 2100, 5) %>% paste0("-01-01") %>% as.Date,
               labels = date_format("%Y")) +
  scale_y_continuous(breaks = 0.01*seq(0, 700, 25),
                labels = percent_format(accuracy = 1)) +
  scale_color_manual(values = viridis(6)[1:5]) +
  theme(legend.position = c(0.2, 0.75),
        legend.title = element_blank())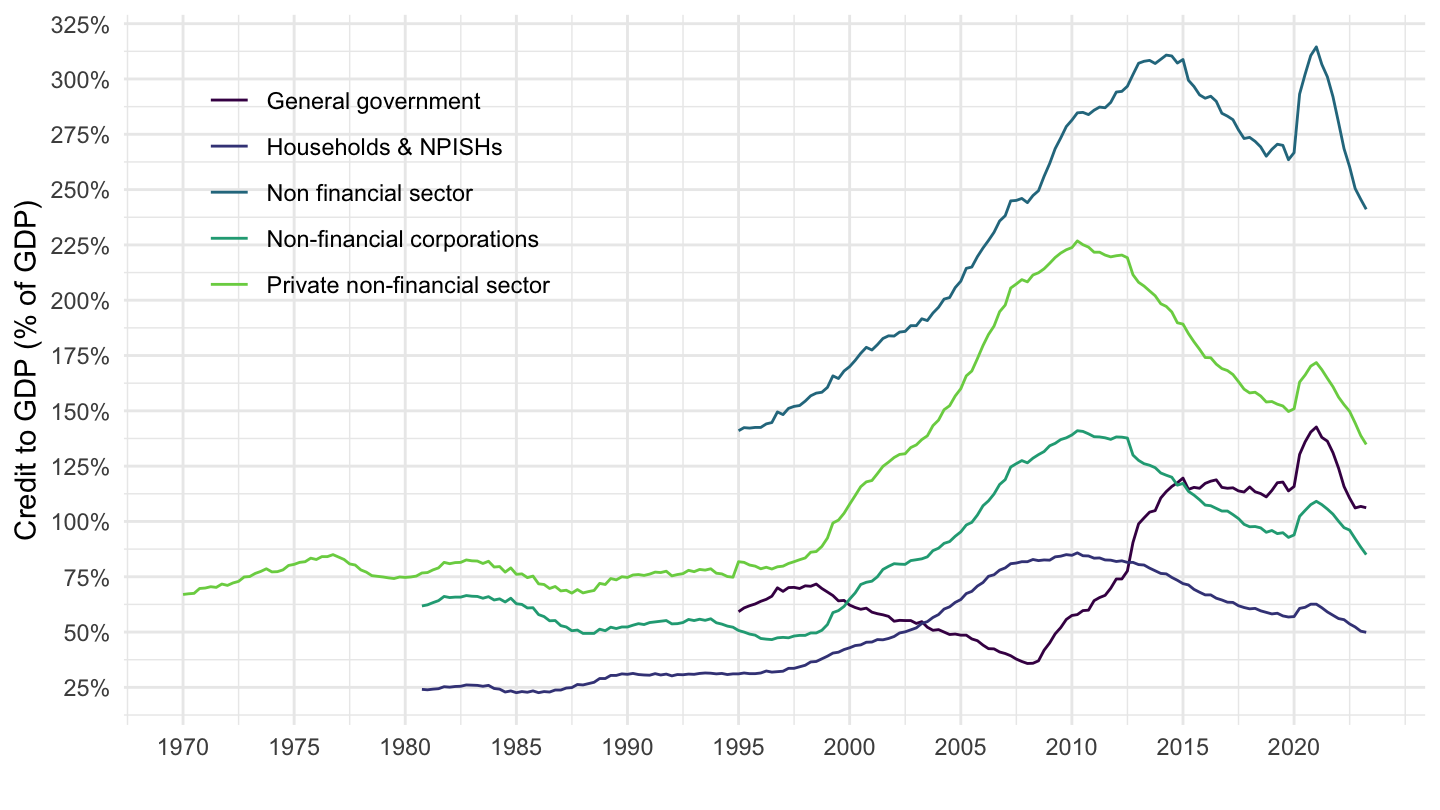
All but Non financial sector
Eurozone
Code
TOTAL_CREDIT %>%
  filter(iso2c %in% c("XM", "US"),
         UNIT_TYPE == "770",
         TC_LENDERS == "A",
         VALUATION == "M",
         TC_ADJUST == "A",
         TC_BORROWERS %in% c("P", "H", "N")) %>%
  filter(date >= as.Date("2000-01-01")) %>%
  ggplot(.) + theme_minimal() + xlab("") + ylab("Credit to GDP (% of GDP)") +
  geom_line(aes(x = date, y = value/100, color = `Borrowing sector`, linetype = iso2c)) +
  scale_x_date(breaks = seq(1940, 2100, 2) %>% paste0("-01-01") %>% as.Date,
               labels = date_format("%Y")) +
  scale_y_continuous(breaks = 0.01*seq(0, 700, 25),
                labels = percent_format(accuracy = 1)) +
  theme(legend.position = c(0.2, 0.75),
        legend.title = element_blank())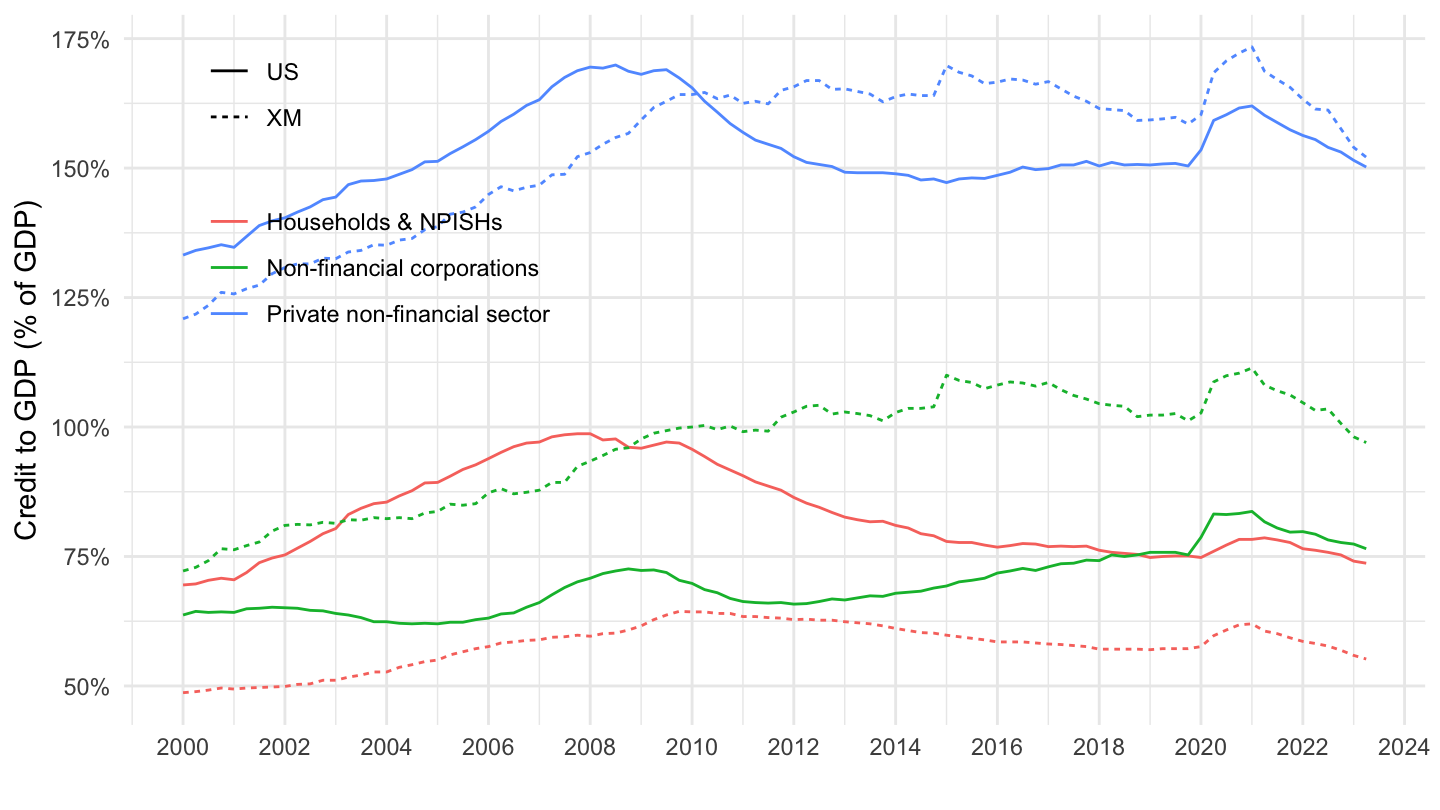
United States
Code
TOTAL_CREDIT %>%
  filter(iso2c == "US",
         UNIT_TYPE == "770",
         TC_LENDERS == "A",
         VALUATION == "M",
         TC_ADJUST == "A",
         TC_BORROWERS %in% c("P", "H", "N")) %>%
  ggplot(.) + theme_minimal() + xlab("") + ylab("Credit to GDP (% of GDP)") +
  geom_line(aes(x = date, y = value/100, color = `Borrowing sector`)) +
  scale_x_date(breaks = seq(1940, 2100, 5) %>% paste0("-01-01") %>% as.Date,
               labels = date_format("%Y")) +
  scale_y_continuous(breaks = 0.01*seq(0, 700, 25),
                labels = percent_format(accuracy = 1)) +
  scale_color_manual(values = viridis(4)[1:3]) +
  theme(legend.position = c(0.2, 0.75),
        legend.title = element_blank())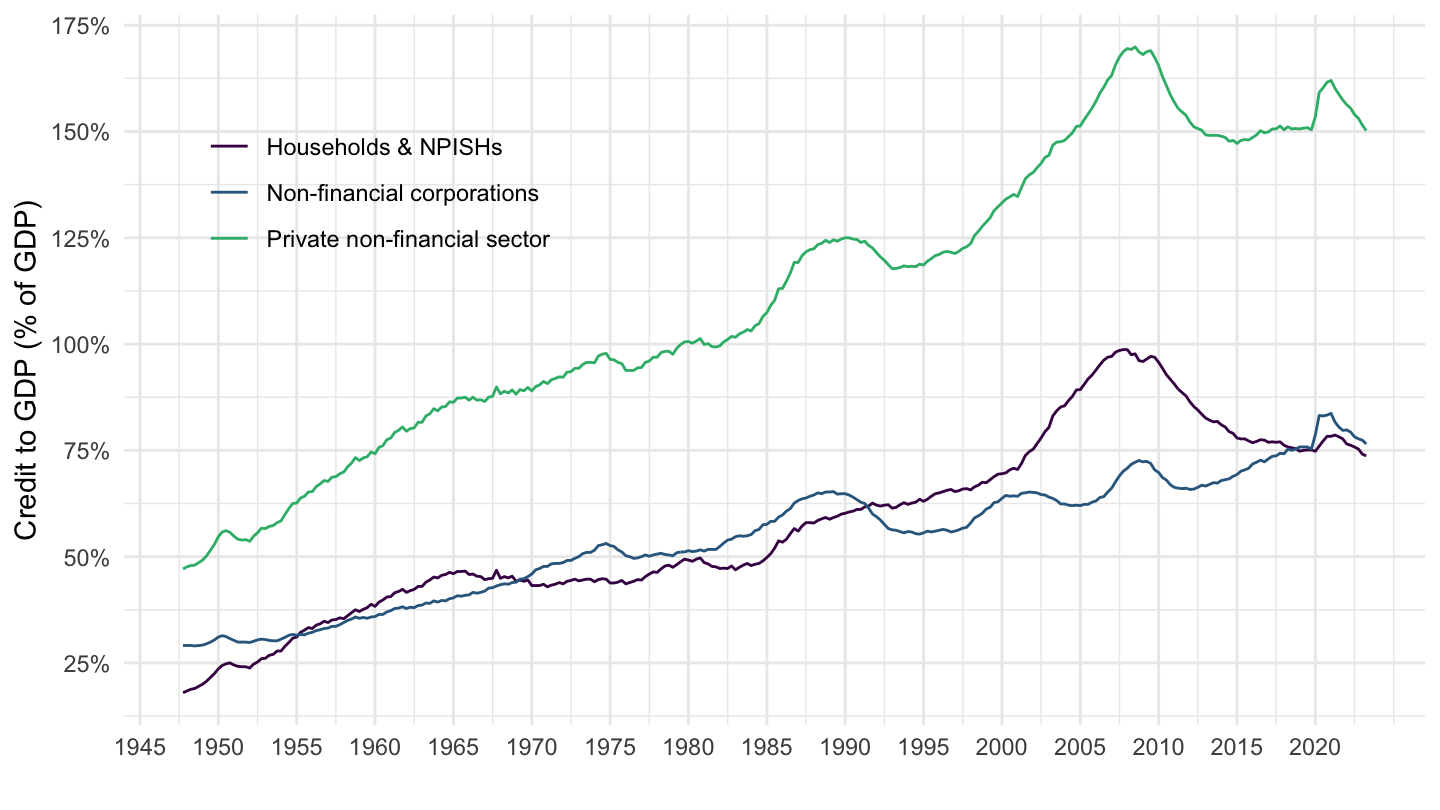
France
Code
TOTAL_CREDIT %>%
  filter(iso2c == "FR",
         UNIT_TYPE == "770",
         TC_LENDERS == "A",
         VALUATION == "M",
         TC_ADJUST == "A",
         TC_BORROWERS %in% c("P", "H", "N")) %>%
  ggplot(.) + theme_minimal() + xlab("") + ylab("Credit to GDP (% of GDP)") +
  geom_line(aes(x = date, y = value/100, color = `Borrowing sector`)) +
  scale_x_date(breaks = seq(1940, 2100, 5) %>% paste0("-01-01") %>% as.Date,
               labels = date_format("%Y")) +
  scale_y_continuous(breaks = 0.01*seq(0, 700, 25),
                labels = percent_format(accuracy = 1)) +
  scale_color_manual(values = viridis(4)[1:3]) +
  theme(legend.position = c(0.2, 0.75),
        legend.title = element_blank())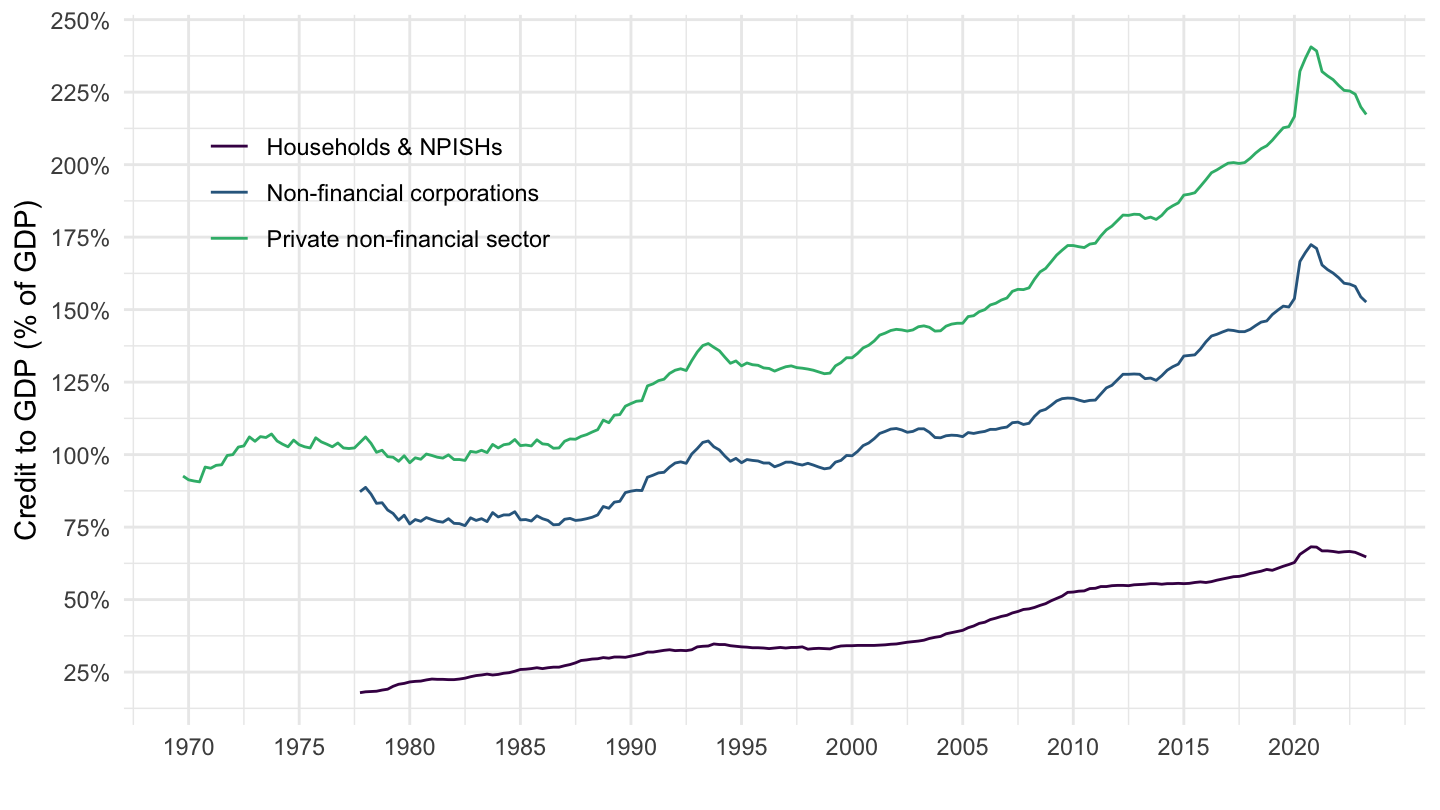
Germany
Code
TOTAL_CREDIT %>%
  filter(iso2c == "DE",
         UNIT_TYPE == "770",
         TC_LENDERS == "A",
         VALUATION == "M",
         TC_ADJUST == "A",
         TC_BORROWERS %in% c("P", "H", "N")) %>%
  ggplot(.) + theme_minimal() + xlab("") + ylab("Credit to GDP (% of GDP)") +
  geom_line(aes(x = date, y = value/100, color = `Borrowing sector`)) +
  scale_x_date(breaks = seq(1940, 2100, 5) %>% paste0("-01-01") %>% as.Date,
               labels = date_format("%Y")) +
  scale_y_continuous(breaks = 0.01*seq(0, 700, 20),
                labels = percent_format(accuracy = 1)) +
  scale_color_manual(values = viridis(4)[1:3]) +
  theme(legend.position = c(0.2, 0.75),
        legend.title = element_blank())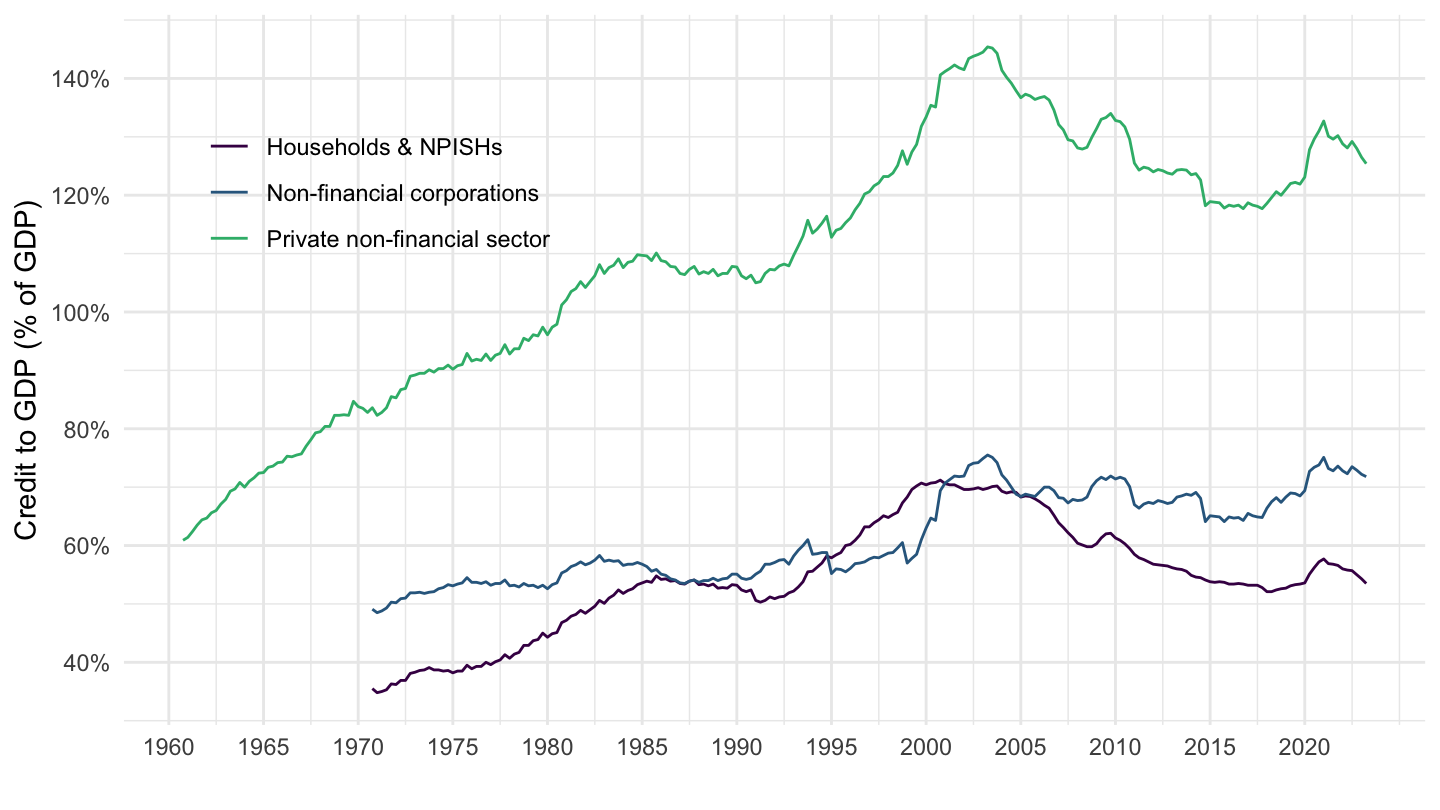
Non-financial corporations
Table
Code
TOTAL_CREDIT %>%
  filter(UNIT_TYPE == "770",
         TC_BORROWERS %in% c("N"),
         TC_LENDERS == "A",
         VALUATION == "M") %>%
  group_by(iso2c, `Borrowers' country`) %>%
  arrange(date) %>%
  summarise(date = last(date),
            value = last(value)) %>%
  arrange(-value) %>%
  mutate(Flag = gsub(" ", "-", str_to_lower(`Borrowers' country`)),
         Flag = paste0('<img src="../../bib/flags/vsmall/', Flag, '.png" alt="Flag">')) %>%
  select(Flag, everything()) %>%
  {if (is_html_output()) datatable(., filter = 'top', rownames = F, escape = F) else .}
France, Germany, Italy
Code
TOTAL_CREDIT %>%
  filter(iso2c %in% c("FR", "DE", "IT"),
         UNIT_TYPE == "770",
         TC_BORROWERS %in% c("N"),
         TC_LENDERS == "A",
         VALUATION == "M") %>%
  left_join(colors, by = c("Borrowers' country" = "country")) %>%
  rename(`Reference area` = `Borrowers' country`) %>%
  mutate(value = value/100) %>%
  group_by(date) %>%
  filter(n() == 3) %>%
  ggplot(.) + theme_minimal() + xlab("") + ylab("Debt to GDP (% of GDP)") +
  geom_line(aes(x = date, y = value, color = color)) +
  scale_color_identity() + add_flags +
  scale_x_date(breaks = seq(1940, 2100, 5) %>% paste0("-01-01") %>% as.Date,
               labels = date_format("%Y")) +
  scale_y_continuous(breaks = 0.01*seq(0, 700, 10),
                labels = percent_format(accuracy = 1)) +
  theme(legend.position = c(0.15, 0.75),
        legend.title = element_blank())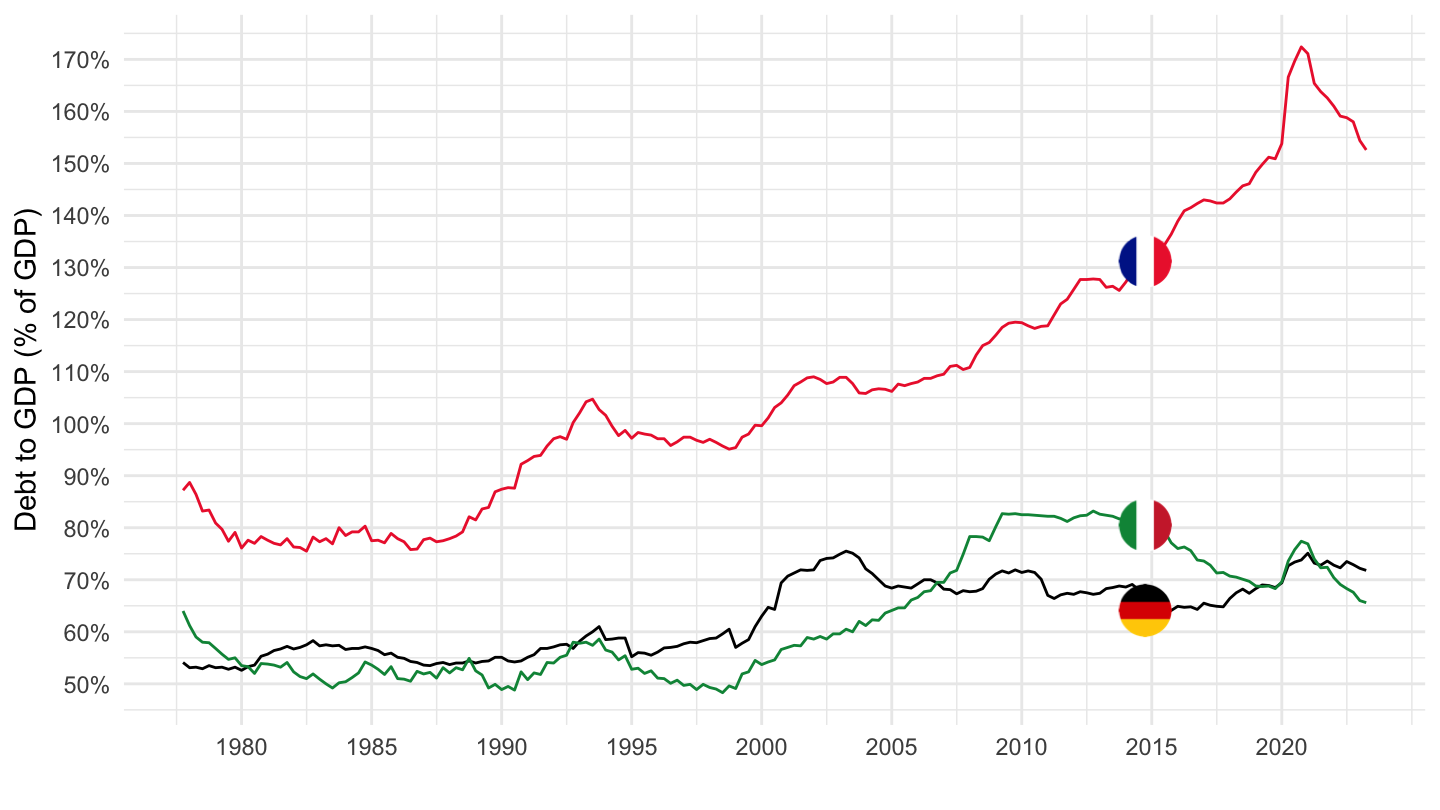
Private non-financial sector (% of GDP)
Table
Code
TOTAL_CREDIT %>%
  filter(UNIT_TYPE == "770",
         TC_BORROWERS %in% c("N"),
         TC_LENDERS == "A",
         VALUATION == "M") %>%
  group_by(iso2c, `Borrowers' country`) %>%
  arrange(date) %>%
  summarise(date = last(date),
            value = last(value)) %>%
  arrange(-value) %>%
  mutate(Flag = gsub(" ", "-", str_to_lower(`Borrowers' country`)),
         Flag = paste0('<img src="../../bib/flags/vsmall/', Flag, '.png" alt="Flag">')) %>%
  select(Flag, everything()) %>%
  {if (is_html_output()) datatable(., filter = 'top', rownames = F, escape = F) else .}
Luxembourg, Honk Kong SAR, Sweden
Code
TOTAL_CREDIT %>%
  filter(iso2c %in% c("LU", "FI", "SE"),
         UNIT_TYPE == "770",
         TC_BORROWERS %in% c("N"),
         TC_LENDERS == "A",
         VALUATION == "M") %>%
  left_join(colors, by = c("Borrowers' country" = "country")) %>%
  rename(`Reference area` = `Borrowers' country`) %>%
  mutate(value = value/100) %>%
  group_by(date) %>%
  filter(n() == 3) %>%
  mutate(color = ifelse(iso2c == "HK", color2, color)) %>%
  ggplot(.) + theme_minimal() + xlab("") + ylab("Debt to GDP (% of GDP)") +
  geom_line(aes(x = date, y = value, color = color)) +
  scale_color_identity() + add_flags +
  scale_x_date(breaks = seq(1940, 2100, 5) %>% paste0("-01-01") %>% as.Date,
               labels = date_format("%Y")) +
  scale_y_continuous(breaks = 0.01*seq(0, 700, 10),
                labels = percent_format(accuracy = 1)) +
  theme(legend.position = c(0.15, 0.75),
        legend.title = element_blank())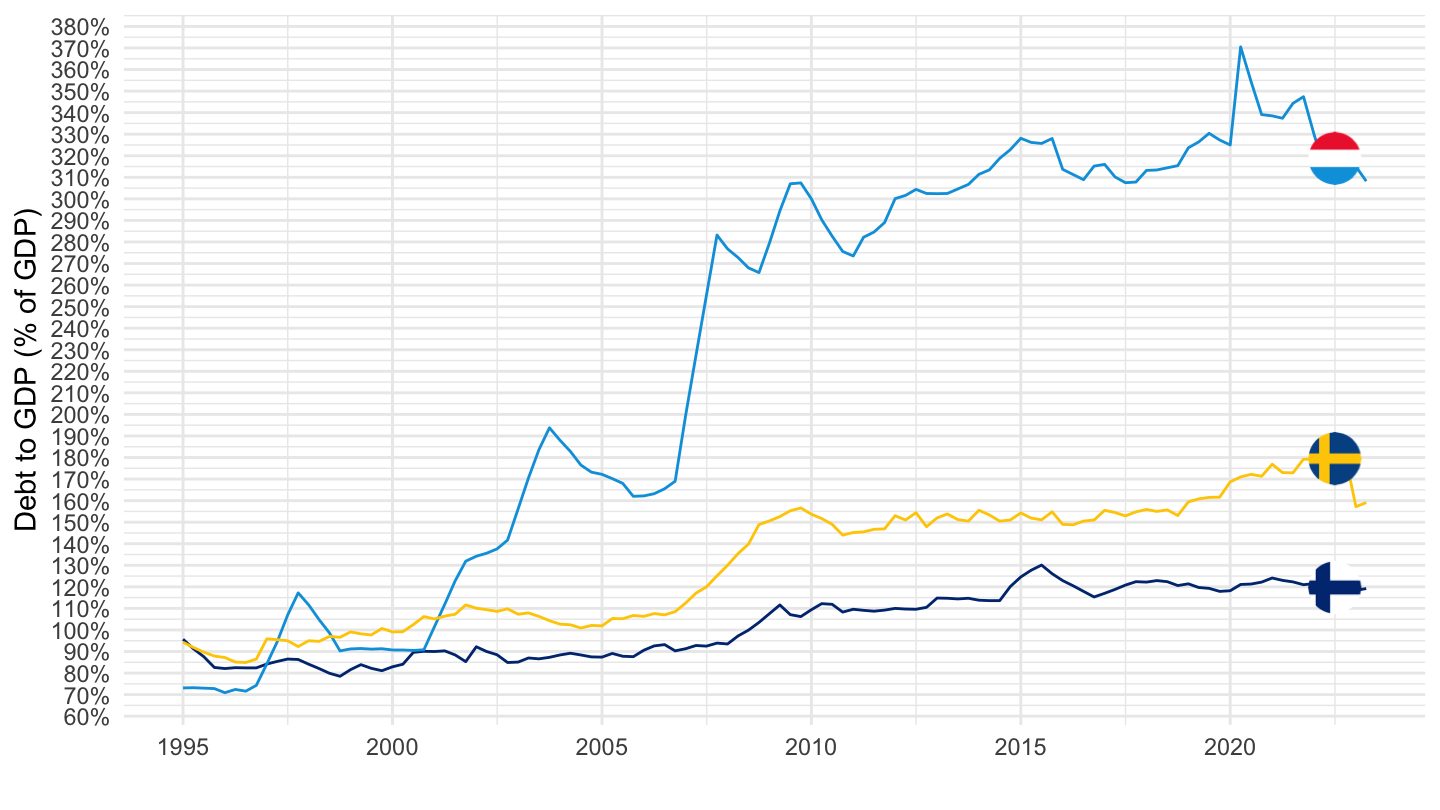
Spain, Ireland
Code
TOTAL_CREDIT %>%
  filter(iso2c %in% c("IE", "ES"),
         UNIT_TYPE == "770",
         TC_BORROWERS %in% c("N"),
         TC_LENDERS == "A",
         date >= as.Date("2000-01-01"),
         date <= as.Date("2012-01-01"),
         VALUATION == "M") %>%
  left_join(colors, by = c("Borrowers' country" = "country")) %>%
  rename(`Reference area` = `Borrowers' country`) %>%
  mutate(value = value/100) %>%
  ggplot(.) + theme_minimal() + xlab("") + ylab("Debt to GDP (% of GDP)") +
  geom_line(aes(x = date, y = value, color = color)) +
  scale_color_identity() + add_flags +
  scale_x_date(breaks = seq(1940, 2100, 1) %>% paste0("-01-01") %>% as.Date,
               labels = date_format("%Y")) +
  scale_y_continuous(breaks = 0.01*seq(0, 700, 10),
                labels = percent_format(accuracy = 1)) +
  theme(legend.position = c(0.15, 0.75),
        legend.title = element_blank())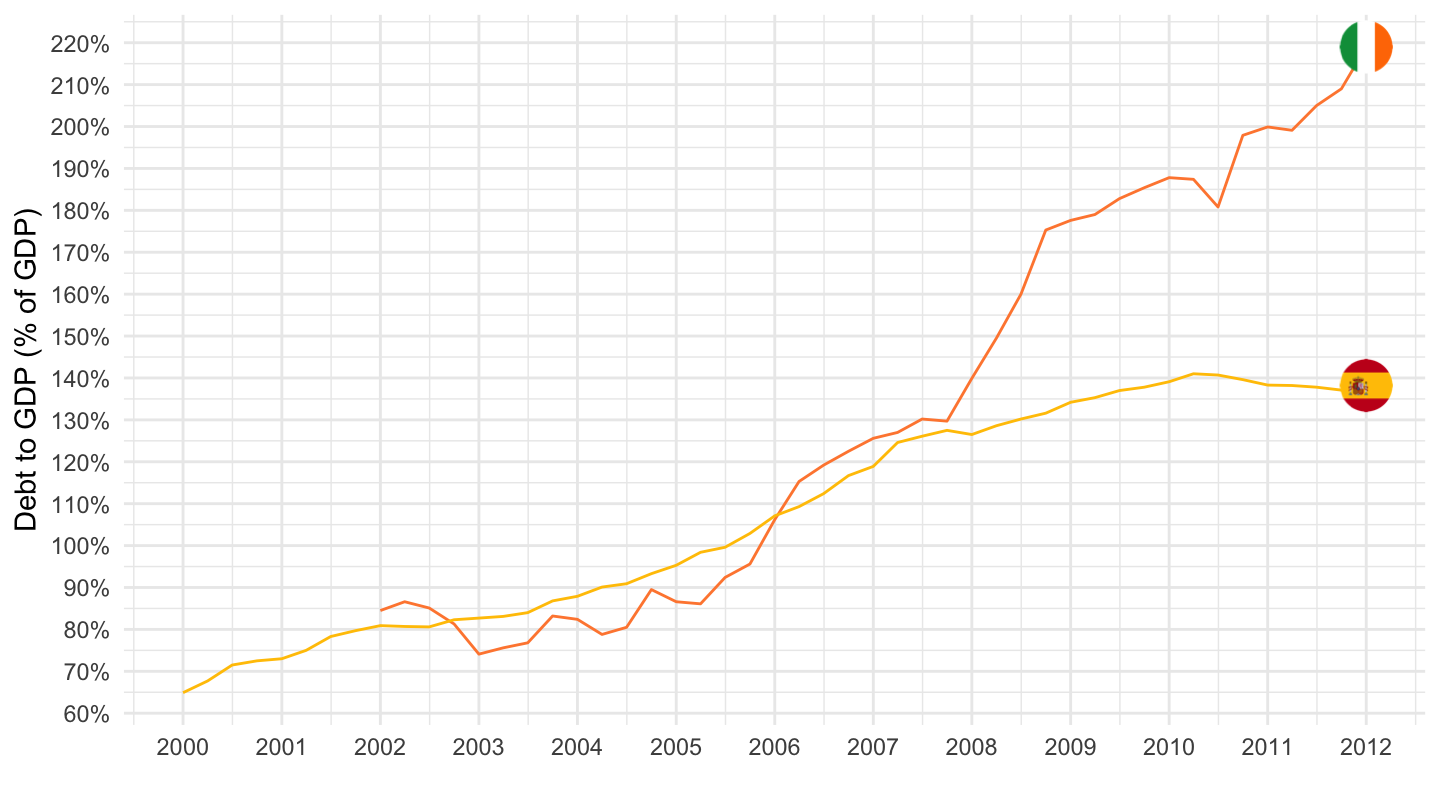
France, Germany, Italy, Spain, United States
Code
TOTAL_CREDIT %>%
  filter(iso2c %in% c("FR", "DE", "IT", "ES", "US"),
         UNIT_TYPE == "770",
         TC_BORROWERS %in% c("N"),
         TC_LENDERS == "A",
         VALUATION == "M") %>%
  left_join(colors, by = c("Borrowers' country" = "country")) %>%
  rename(`Reference area` = `Borrowers' country`) %>%
  mutate(value = value/100) %>%
  group_by(date) %>%
  filter(n() == 5) %>%
  ggplot(.) + theme_minimal() + xlab("") + ylab("Debt to GDP (% of GDP)") +
  geom_line(aes(x = date, y = value, color = color)) +
  scale_color_identity() + add_flags +
  scale_x_date(breaks = seq(1940, 2100, 5) %>% paste0("-01-01") %>% as.Date,
               labels = date_format("%Y")) +
  scale_y_continuous(breaks = 0.01*seq(0, 700, 10),
                labels = percent_format(accuracy = 1)) +
  theme(legend.position = c(0.15, 0.75),
        legend.title = element_blank())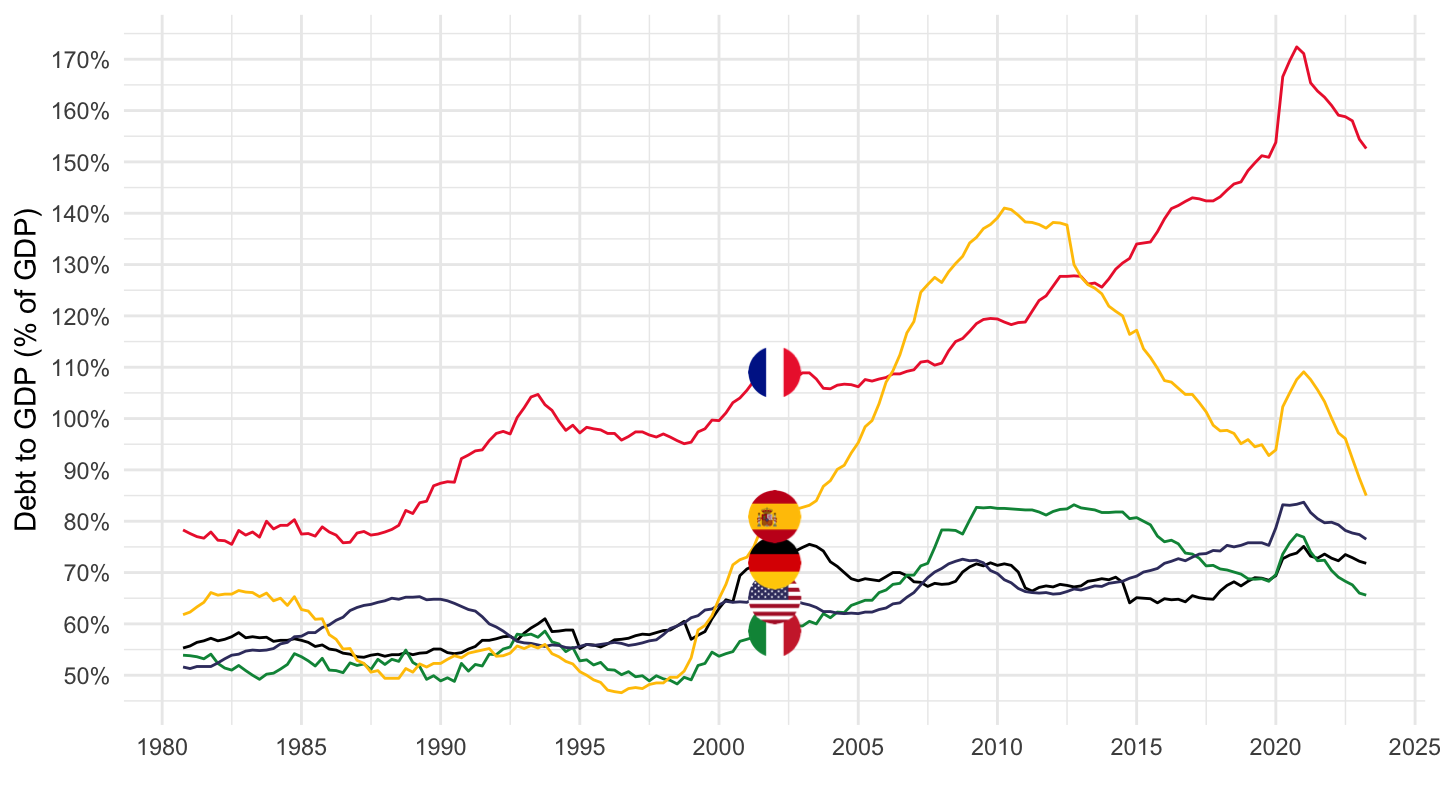
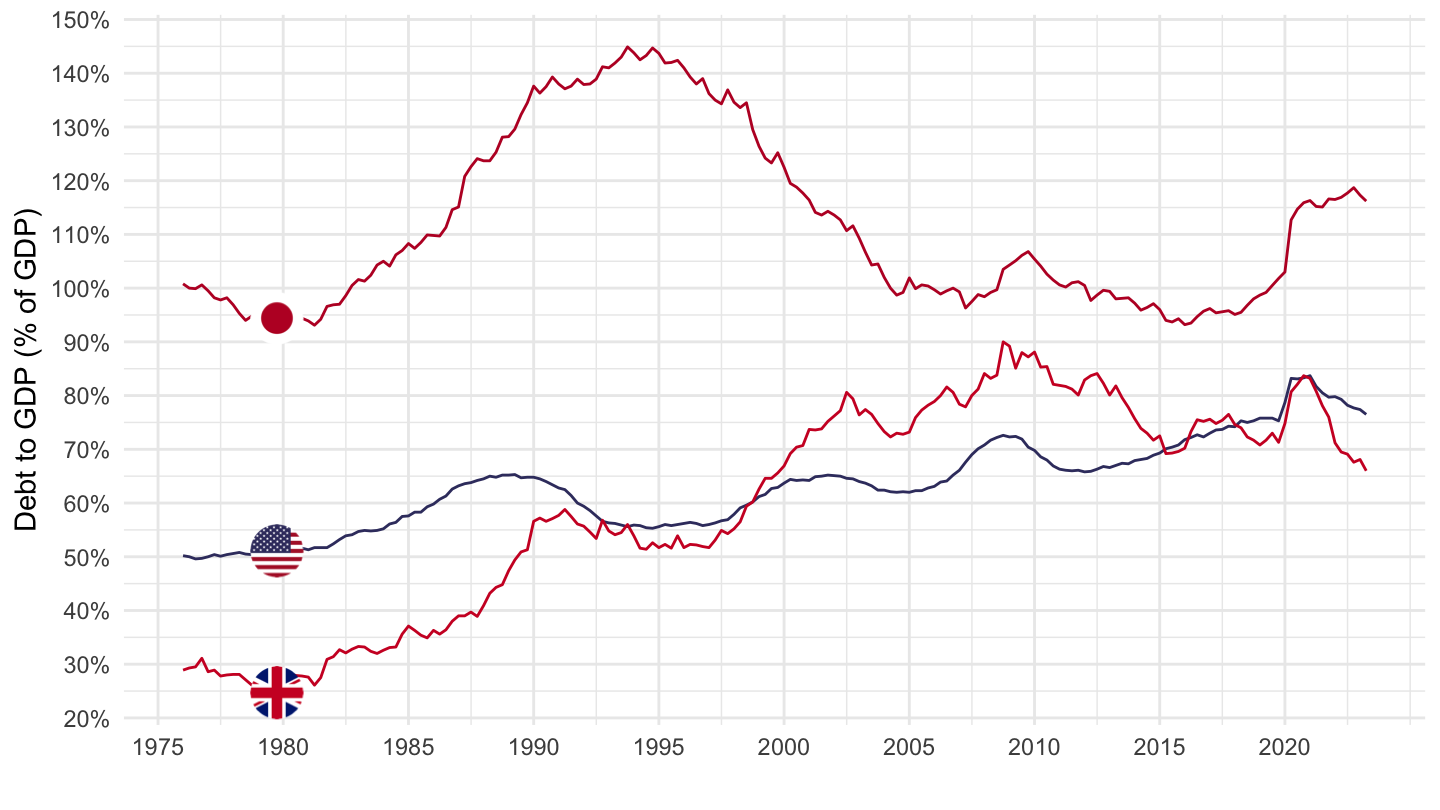
Japan, United Kingdom, United States
Code
TOTAL_CREDIT %>%
  filter(iso2c %in% c("JP", "GB", "US"),
         UNIT_TYPE == "770",
         TC_BORROWERS %in% c("N"),
         TC_LENDERS == "A",
         VALUATION == "M") %>%
  left_join(colors, by = c("Borrowers' country" = "country")) %>%
  rename(`Reference area` = `Borrowers' country`) %>%
  mutate(value = value/100) %>%
  group_by(date) %>%
  filter(n() == 3) %>%
  ggplot(.) + theme_minimal() + xlab("") + ylab("Debt to GDP (% of GDP)") +
  geom_line(aes(x = date, y = value, color = color)) +
  scale_color_identity() + add_flags +
  scale_x_date(breaks = seq(1940, 2100, 5) %>% paste0("-01-01") %>% as.Date,
               labels = date_format("%Y")) +
  scale_y_continuous(breaks = 0.01*seq(0, 700, 10),
                labels = percent_format(accuracy = 1)) +
  theme(legend.position = c(0.15, 0.75),
        legend.title = element_blank())