Last observation: août 2026 (N = 84) · 2025 (N = 126)
First observation: 1661 (N = 1) · janv. 1913 (N = 1)
Last data update: 06 oct. 2026, 23:21
Last compile: 06 oct. 2026, 23:33
LONG_CPI |>
  left_join(REF_AREA, by = "REF_AREA") |>
  group_by(REF_AREA, Ref_area) |>
  summarise(Nobs = n()) |>
  arrange(-Nobs) |>
  mutate(Flag = gsub(" ", "-", str_to_lower(Ref_area)),
         Flag = paste0('<img src="../../icon/flag/vsmall/', Flag, '.png" alt="Flag">')) |>
  select(Flag, everything()) %>%
{if (is_html_output()) datatable(., filter = 'top', rownames = F, escape = F) else .}LONG_CPI |>
group_by(UNIT_MEASURE) |>
summarise(Nobs = n()) |>
arrange(-Nobs) |>
print_table_conditional()| UNIT_MEASURE | Nobs |
|---|---|
| 628 | 53456 |
| 771 | 52637 |
LONG_CPI |>
  left_join(FREQ, by = "FREQ") |>
  group_by(FREQ, Freq) |>
  summarise(Nobs = n()) |>
  arrange(-Nobs) |>
print_table_conditional()| FREQ | Freq | Nobs |
|---|---|---|
| M | Monthly | 96544 |
| A | Annual | 9549 |
LONG_CPI |>
  filter(REF_AREA %in% c("GB"),
         UNIT_MEASURE == 771,
         FREQ == "A") |>
  year_to_date() |>
  ggplot() + geom_line() + theme_minimal() +
  aes(x = date, y = OBS_VALUE/100) + xlab("") + ylab("Inflation") +
  scale_x_date(breaks = seq(1600, 2100, 50) |> paste0("-01-01") |> as.Date(),
               labels = date_format("%Y")) +
  scale_y_continuous(breaks = 0.01*seq(-100, 200, 5),
                     labels = percent_format(a = 1)) +
  geom_hline(yintercept = 0, linetype = "dashed", color = "grey")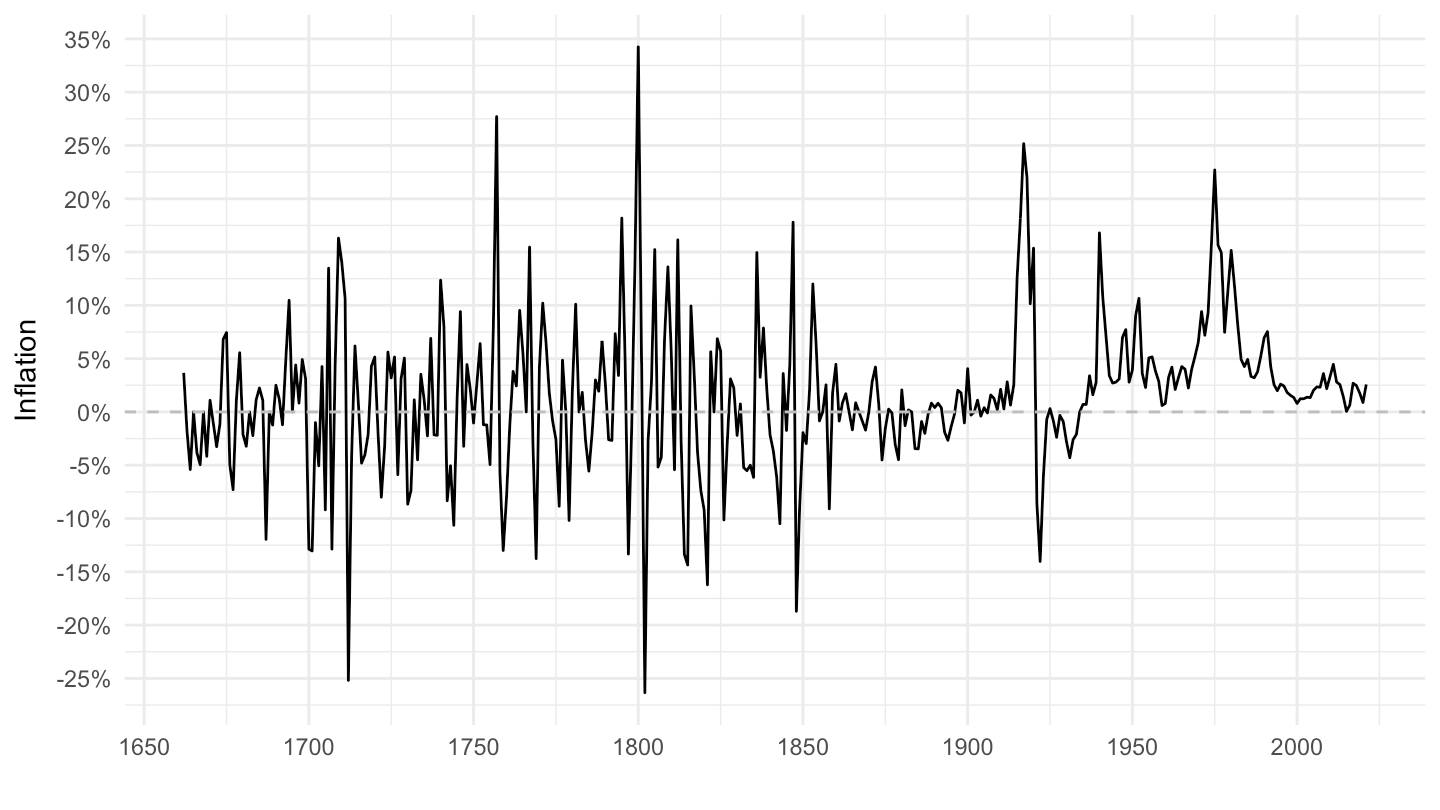
LONG_CPI |>
  filter(FREQ == "A",
         REF_AREA %in% c("GB"),
         UNIT_MEASURE == 771) |>
  year_to_date() |>
  filter(date >= as.Date("1952-01-01")) |>
  ggplot() + geom_line() + theme_minimal() +
  aes(x = date, y = OBS_VALUE/100) + xlab("") + ylab("Inflation") +
  scale_x_date(breaks = seq(1900, 2100, 5) |> paste0("-01-01") |> as.Date(),
               labels = date_format("%Y")) +
  scale_y_continuous(breaks = 0.01*seq(-10, 200, 2),
                     labels = percent_format(a = 1)) +
  geom_hline(yintercept = 0, linetype = "dashed", color = "grey")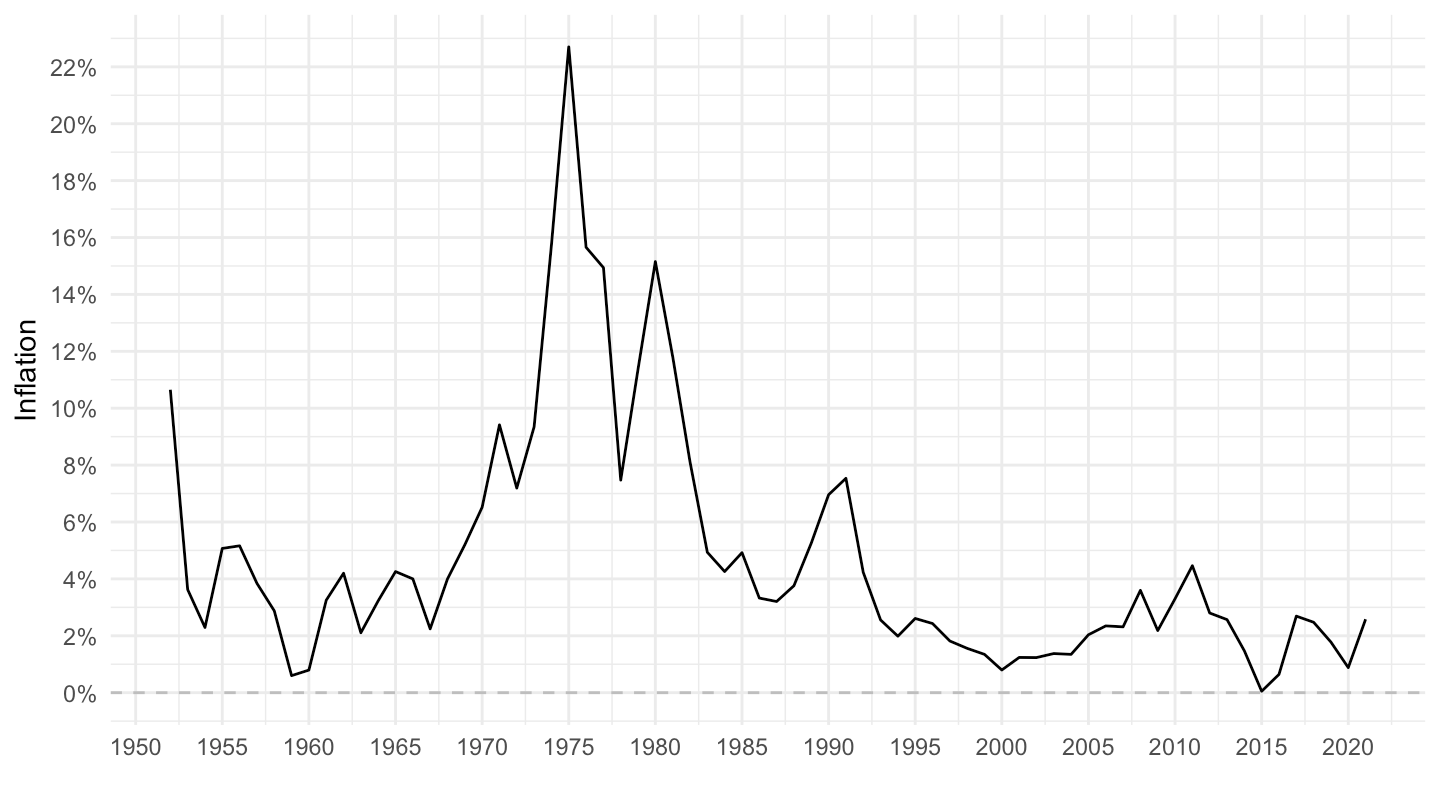
LONG_CPI |>
  filter(REF_AREA %in% c("US"),
         UNIT_MEASURE == 771,
         FREQ == "A") |>
  year_to_date() |>
  ggplot() + geom_line() + theme_minimal() +
  aes(x = date, y = OBS_VALUE/100) + xlab("") + ylab("Inflation") +
  scale_x_date(breaks = seq(1900, 2100, 10) |> paste0("-01-01") |> as.Date(),
               labels = date_format("%Y")) +
  scale_y_continuous(breaks = 0.01*seq(-10, 200, 2),
                     labels = percent_format(a = 1)) +
  geom_hline(yintercept = 0, linetype = "dashed", color = "grey")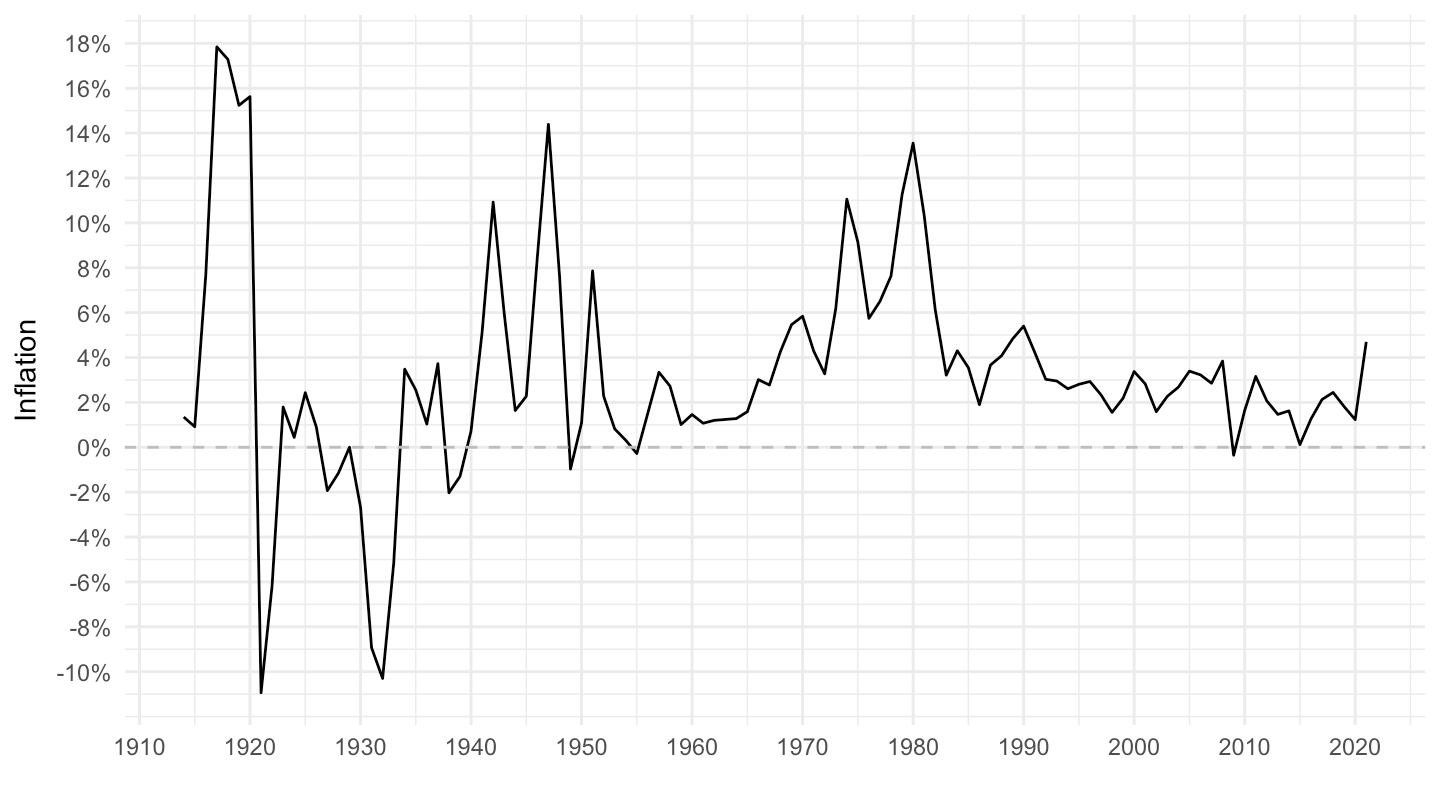
LONG_CPI |>
  filter(REF_AREA %in% c("US"),
         UNIT_MEASURE == 771,
         FREQ == "A") |>
  year_to_date() |>
  filter(date >= as.Date("1952-01-01")) |>
  ggplot() + geom_line() + theme_minimal() +
  aes(x = date, y = OBS_VALUE/100) + xlab("") + ylab("Inflation") +
  scale_x_date(breaks = seq(1900, 2100, 5) |> paste0("-01-01") |> as.Date(),
               labels = date_format("%Y")) +
  scale_y_continuous(breaks = 0.01*seq(-10, 200, 2),
                     labels = percent_format(a = 1)) +
  geom_hline(yintercept = 0, linetype = "dashed", color = "grey")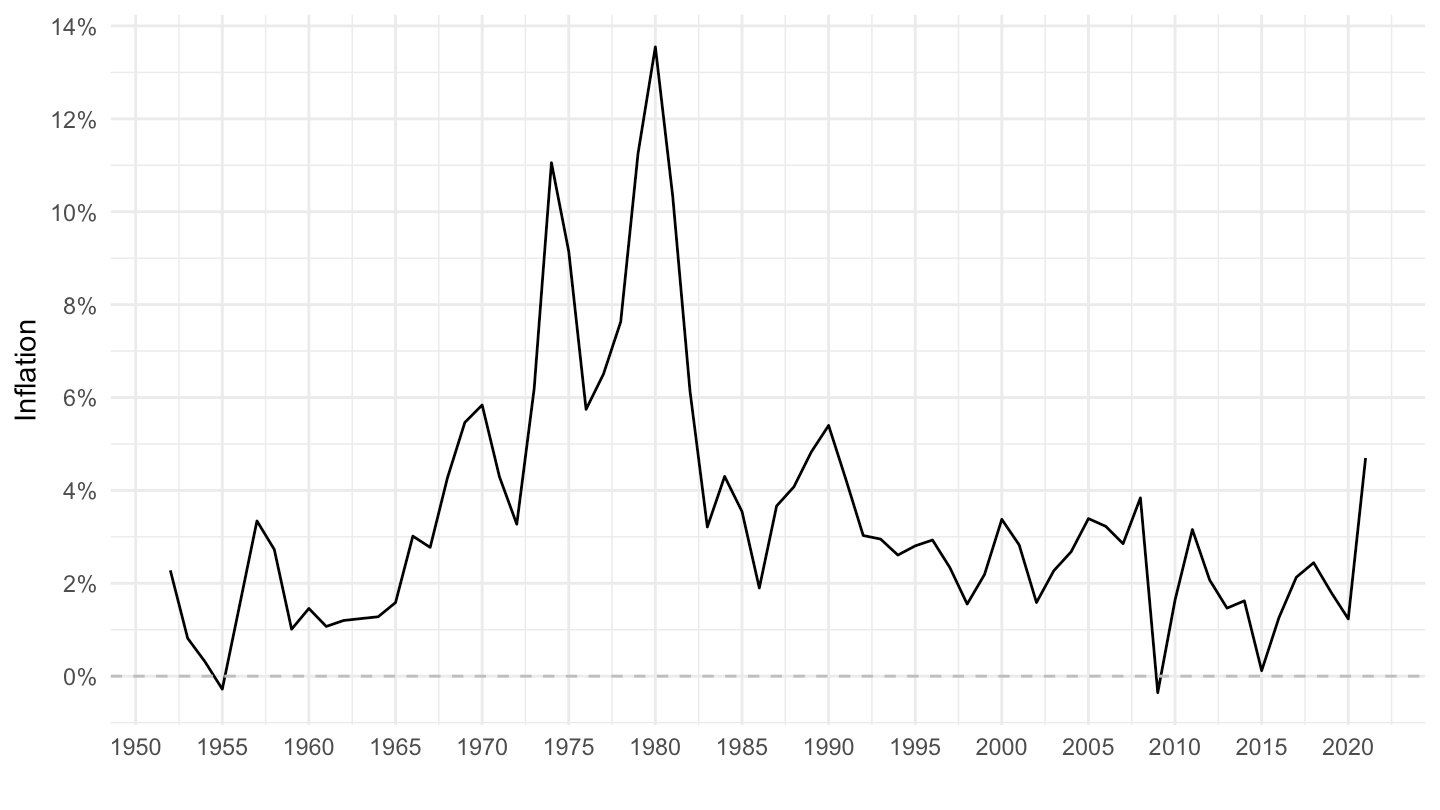
LONG_CPI |>
  filter(REF_AREA %in% c("CA"),
         UNIT_MEASURE == 771,
         FREQ == "A") |>
  year_to_date() |>
  ggplot() + geom_line() + theme_minimal() +
  aes(x = date, y = OBS_VALUE/100) + xlab("") + ylab("Inflation") +
  scale_x_date(breaks = seq(1900, 2100, 10) |> paste0("-01-01") |> as.Date(),
               labels = date_format("%Y")) +
  scale_y_continuous(breaks = 0.01*seq(-10, 200, 2),
                     labels = percent_format(a = 1)) +
  geom_hline(yintercept = 0, linetype = "dashed", color = "grey")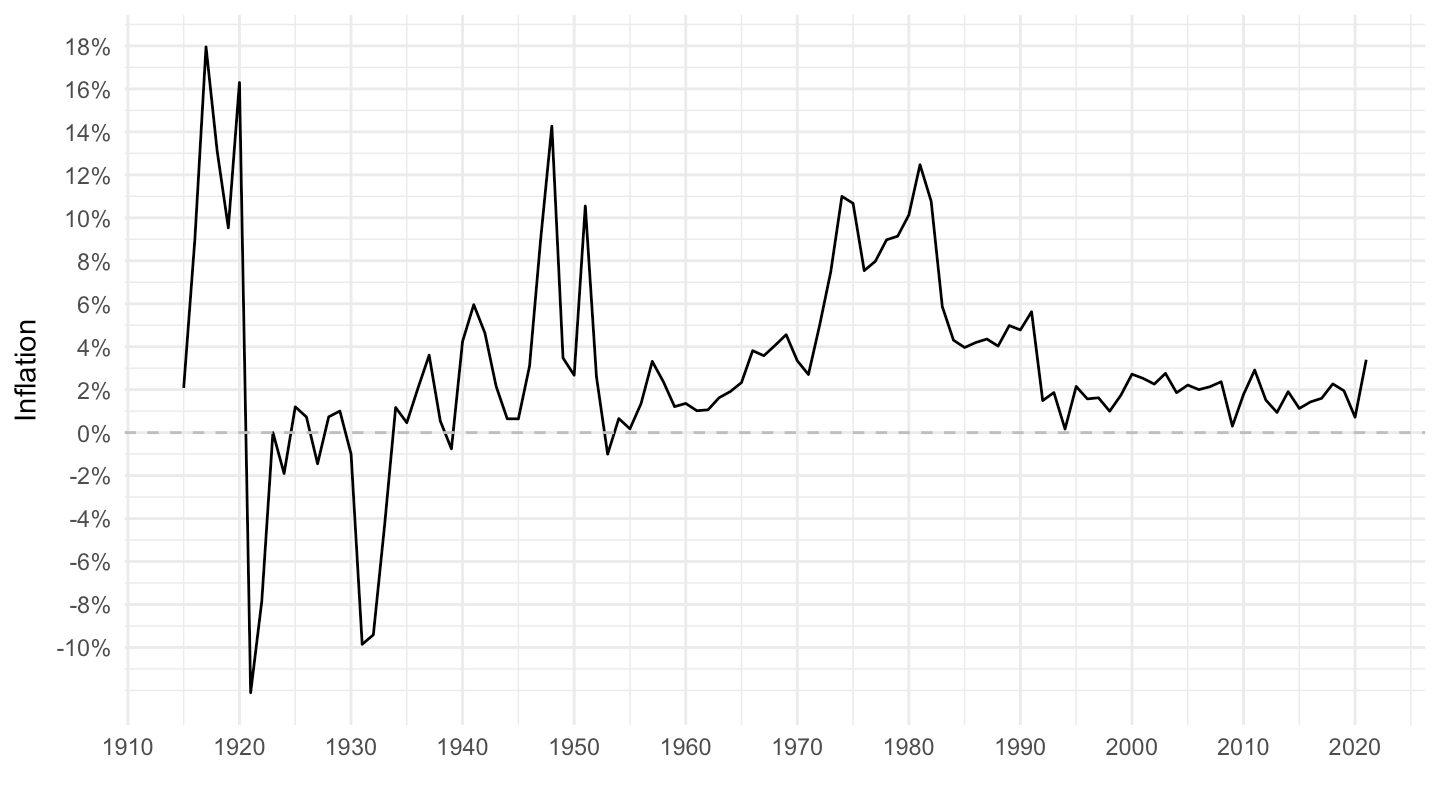
LONG_CPI |>
  filter(REF_AREA %in% c("CA"),
         UNIT_MEASURE == 771,
         FREQ == "A") |>
  year_to_date() |>
  filter(date >= as.Date("1952-01-01")) |>
  ggplot() + geom_line() + theme_minimal() +
  aes(x = date, y = OBS_VALUE/100) + xlab("") + ylab("Inflation") +
  scale_x_date(breaks = seq(1900, 2100, 5) |> paste0("-01-01") |> as.Date(),
               labels = date_format("%Y")) +
  scale_y_continuous(breaks = 0.01*seq(-10, 200, 2),
                     labels = percent_format(a = 1)) +
  geom_hline(yintercept = 0, linetype = "dashed", color = "grey")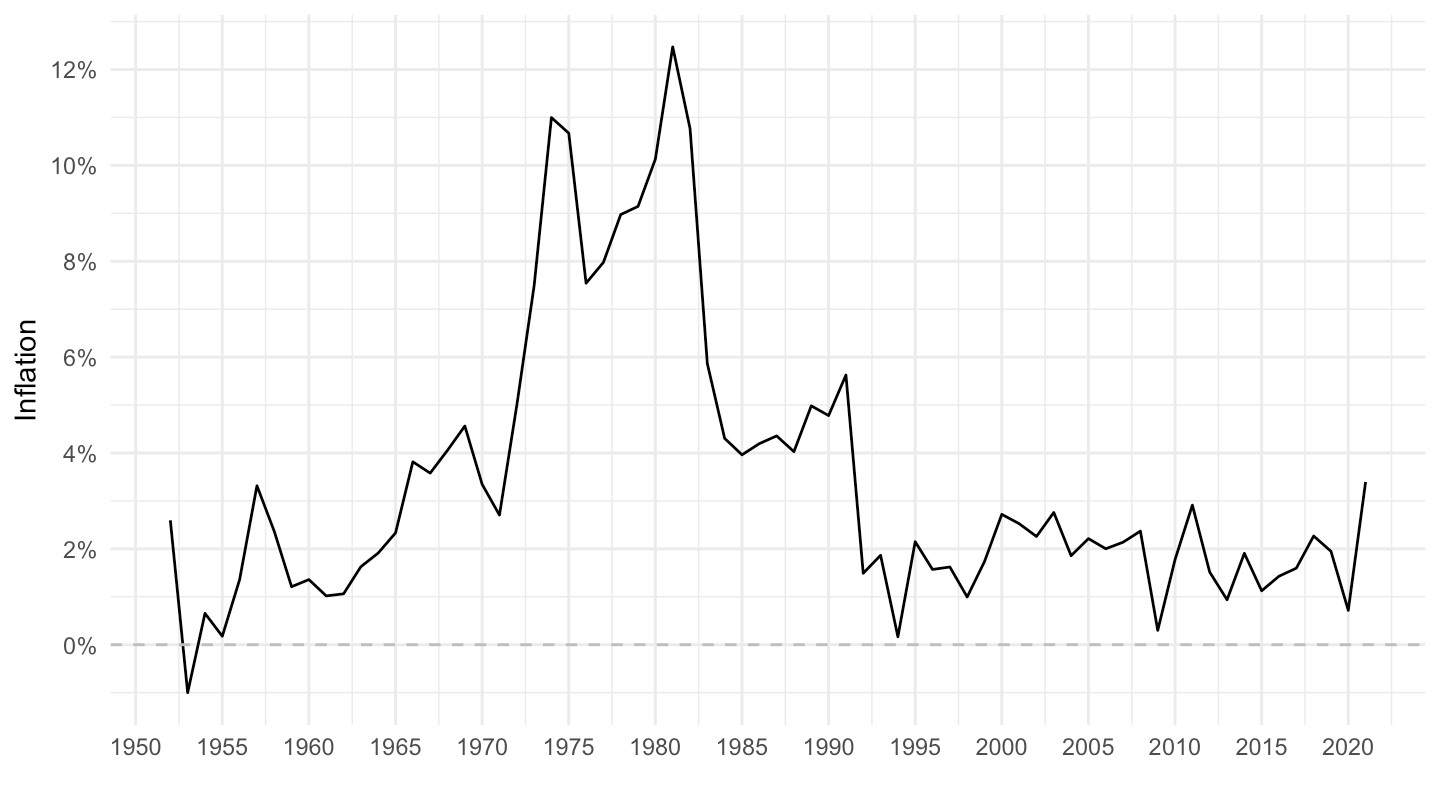
LONG_CPI |>
  filter(REF_AREA %in% c("NO"),
         UNIT_MEASURE == 771,
         FREQ == "A") |>
  year_to_date() |>
  ggplot() + geom_line() + theme_minimal() +
  aes(x = date, y = OBS_VALUE/100) + xlab("") + ylab("Inflation") +
  scale_x_date(breaks = seq(1800, 2100, 20) |> paste0("-01-01") |> as.Date(),
               labels = date_format("%Y")) +
  scale_y_continuous(breaks = 0.01*seq(-100, 200, 5),
                     labels = percent_format(a = 1)) +
  geom_hline(yintercept = 0, linetype = "dashed", color = "grey")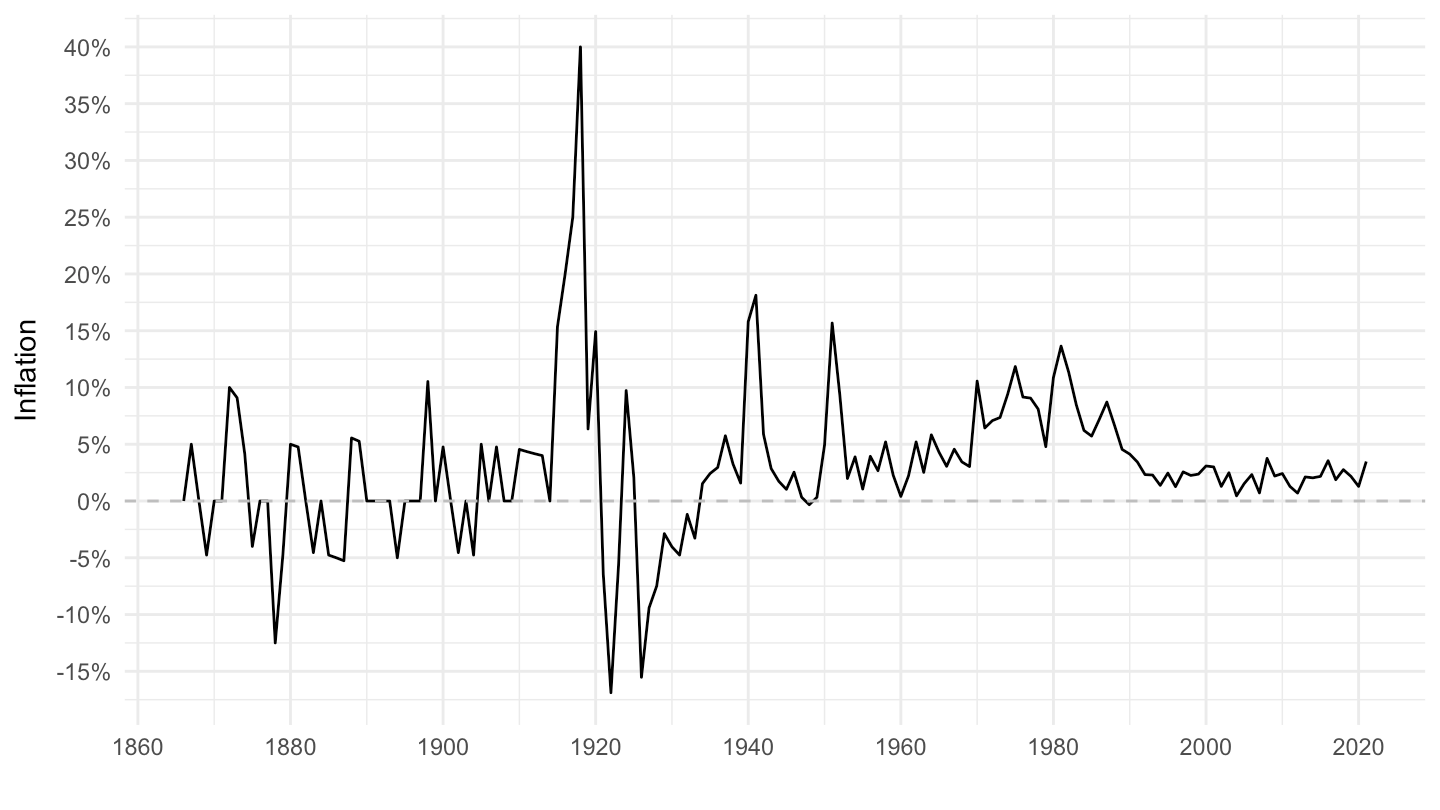
LONG_CPI |>
  filter(REF_AREA %in% c("NO"),
         UNIT_MEASURE == 771,
         FREQ == "A") |>
  year_to_date() |>
  filter(date >= as.Date("1952-01-01")) |>
  ggplot() + geom_line() + theme_minimal() +
  aes(x = date, y = OBS_VALUE/100) + xlab("") + ylab("Inflation") +
  scale_x_date(breaks = seq(1900, 2100, 5) |> paste0("-01-01") |> as.Date(),
               labels = date_format("%Y")) +
  scale_y_continuous(breaks = 0.01*seq(-10, 200, 2),
                     labels = percent_format(a = 1)) +
  geom_hline(yintercept = 0, linetype = "dashed", color = "grey")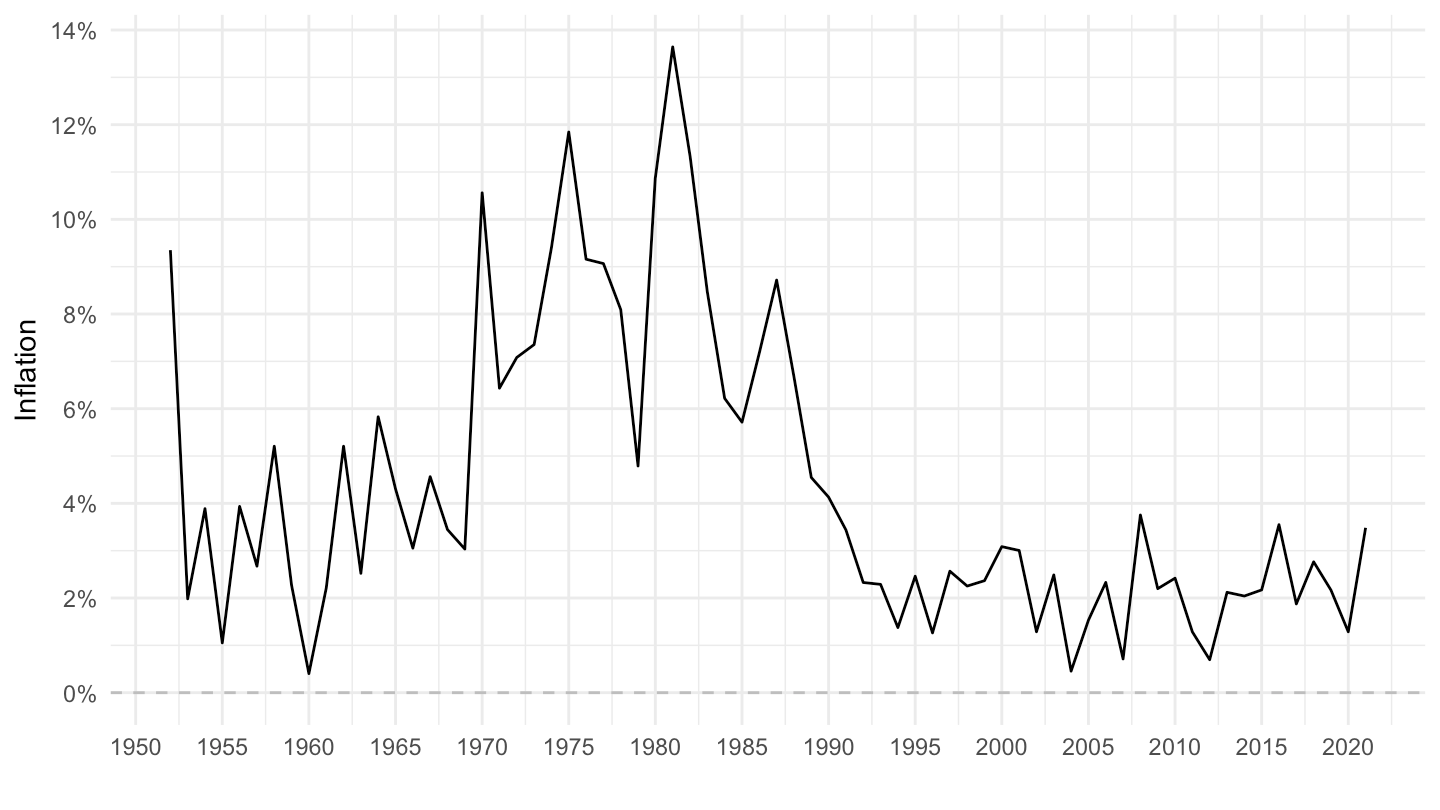
LONG_CPI |>
  filter(REF_AREA %in% c("CH"),
         UNIT_MEASURE == "771",
         FREQ == "A") |>
  year_to_date() |>
  ggplot() + geom_line() + theme_minimal() +
  aes(x = date, y = OBS_VALUE/100) + xlab("") + ylab("Inflation") +
  scale_x_date(breaks = seq(1800, 2100, 20) |> paste0("-01-01") |> as.Date(),
               labels = date_format("%Y")) +
  scale_y_continuous(breaks = 0.01*seq(-100, 200, 5),
                     labels = percent_format(a = 1)) +
  geom_hline(yintercept = 0, linetype = "dashed", color = "grey")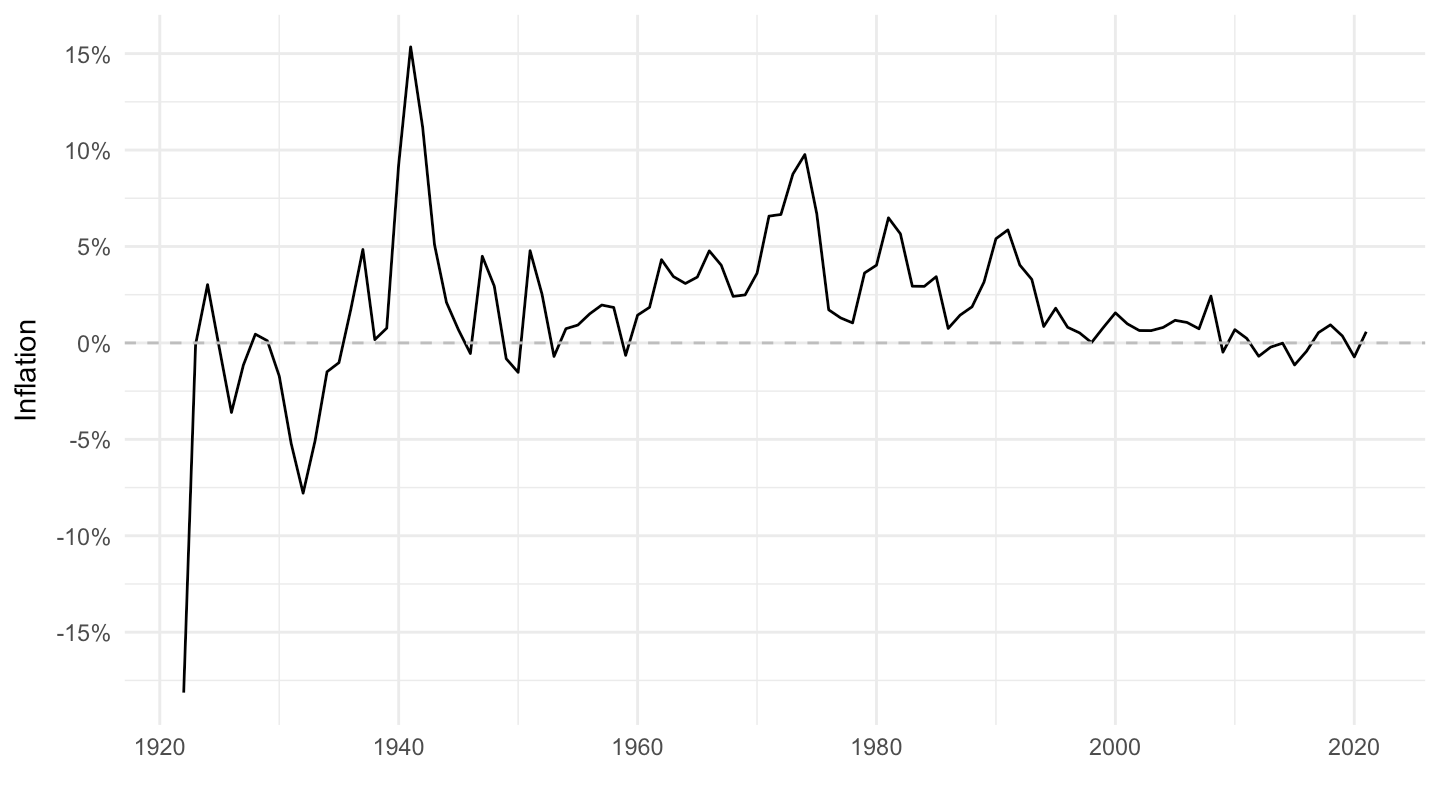
LONG_CPI |>
  filter(REF_AREA %in% c("CH"),
         UNIT_MEASURE == 771,
         FREQ == "A") |>
  year_to_date() |>
  ggplot() + geom_line() + theme_minimal() +
  aes(x = date, y = OBS_VALUE/100) + xlab("") + ylab("Inflation") +
  scale_x_date(breaks = seq(1900, 2100, 5) |> paste0("-01-01") |> as.Date(),
               labels = date_format("%Y")) +
  scale_y_continuous(breaks = 0.01*seq(-10, 200, 2),
                     labels = percent_format(a = 1)) +
  geom_hline(yintercept = 0, linetype = "dashed", color = "grey")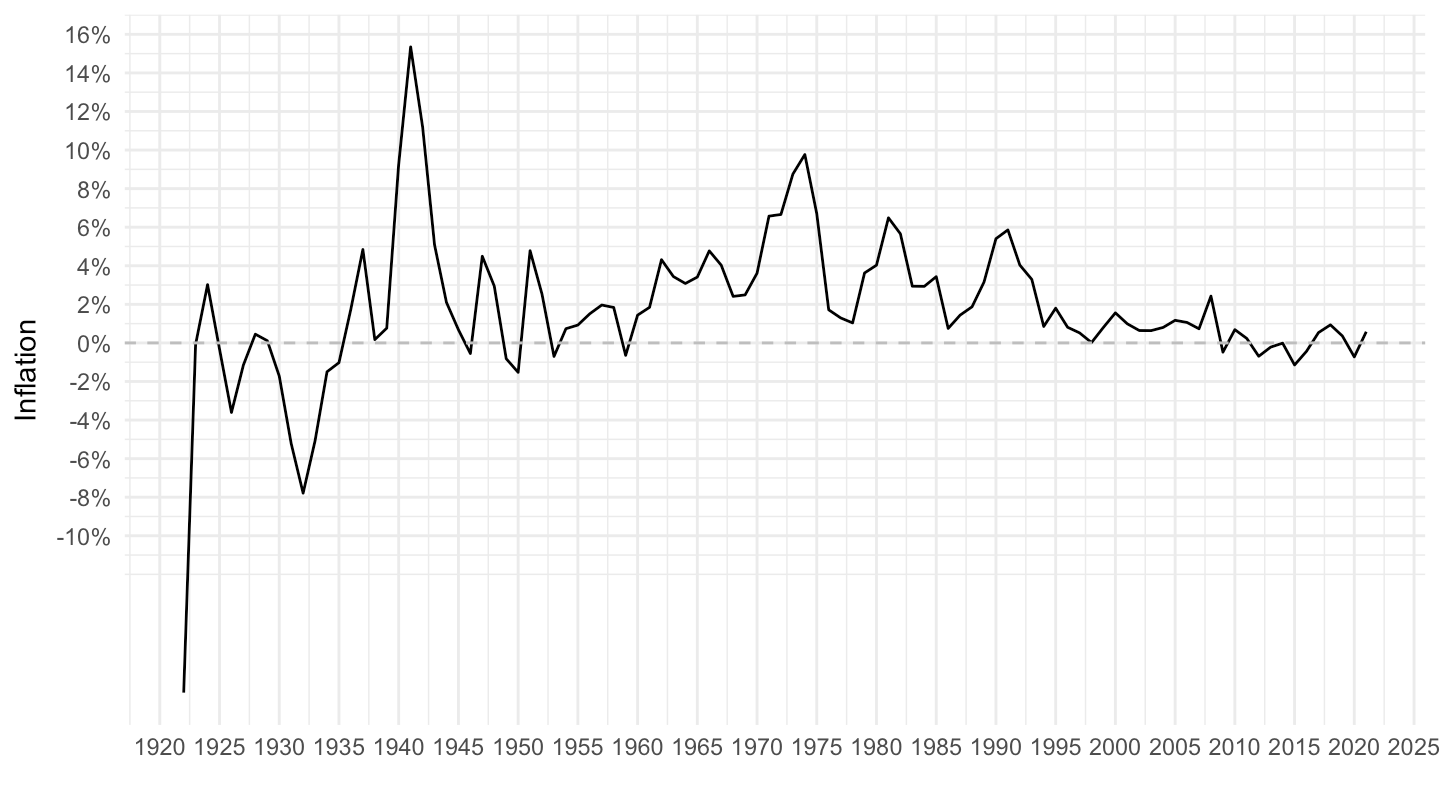
LONG_CPI |>
  filter(REF_AREA %in% c("CH"),
         UNIT_MEASURE == 771,
         FREQ == "A") |>
  year_to_date() |>
  filter(date >= as.Date("2010-01-01")) |>
  ggplot() + geom_line() + theme_minimal() +
  aes(x = date, y = OBS_VALUE/100) + xlab("") + ylab("Inflation") +
  scale_x_date(breaks = seq(1900, 2100, 1) |> paste0("-01-01") |> as.Date(),
               labels = date_format("%Y")) +
  scale_y_continuous(breaks = 0.01*seq(-10, 200, 0.2),
                     labels = percent_format(a = .2)) +
  geom_hline(yintercept = 0, linetype = "dashed", color = "grey")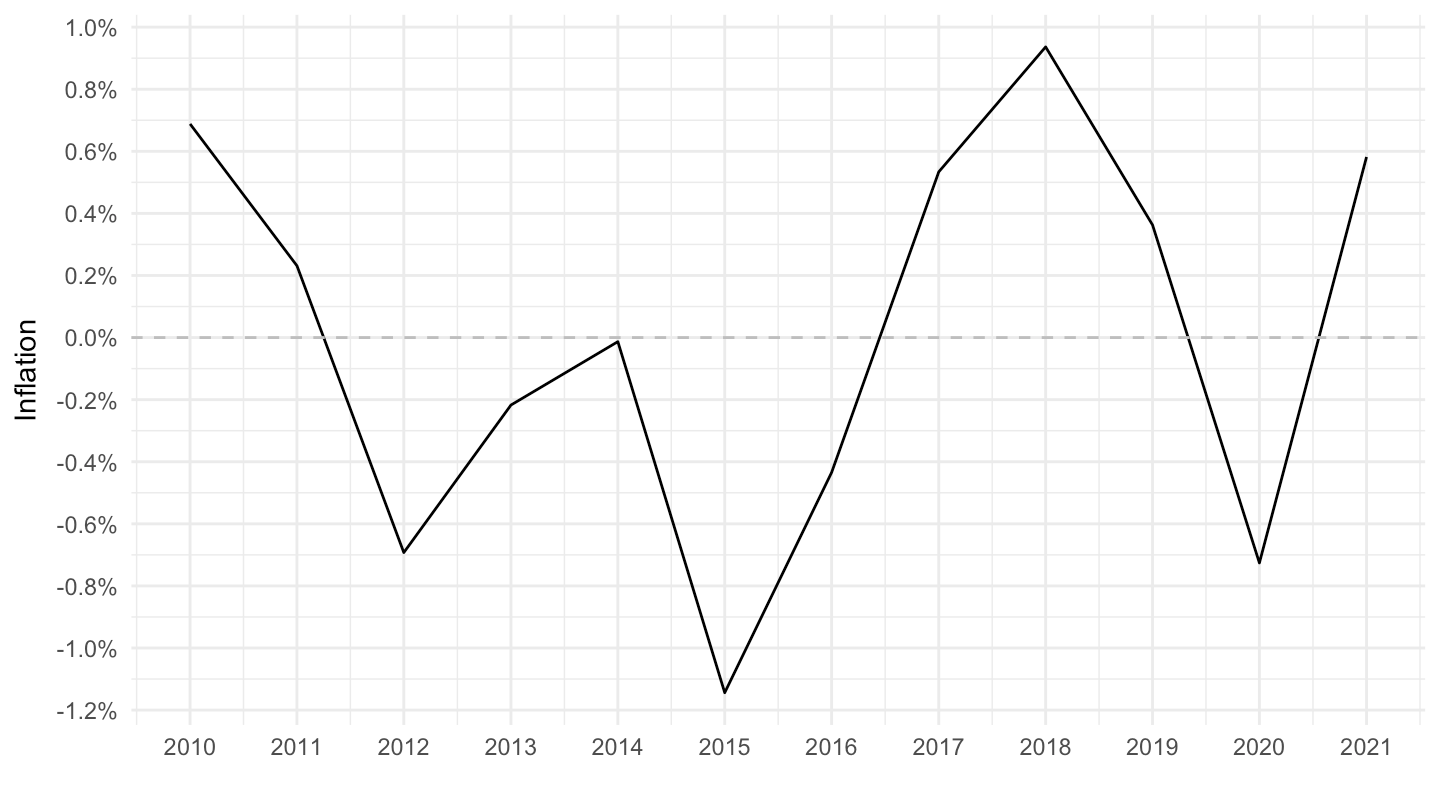
LONG_CPI |>
  filter(REF_AREA %in% c("DK"),
         UNIT_MEASURE == 771,
         FREQ == "A") |>
  year_to_date() |>
  ggplot() + geom_line() + theme_minimal() +
  aes(x = date, y = OBS_VALUE/100) + xlab("") + ylab("Inflation") +
  scale_x_date(breaks = seq(1800, 2100, 20) |> paste0("-01-01") |> as.Date(),
               labels = date_format("%Y")) +
  scale_y_continuous(breaks = 0.01*seq(-100, 200, 5),
                     labels = percent_format(a = 1)) +
  geom_hline(yintercept = 0, linetype = "dashed", color = "grey")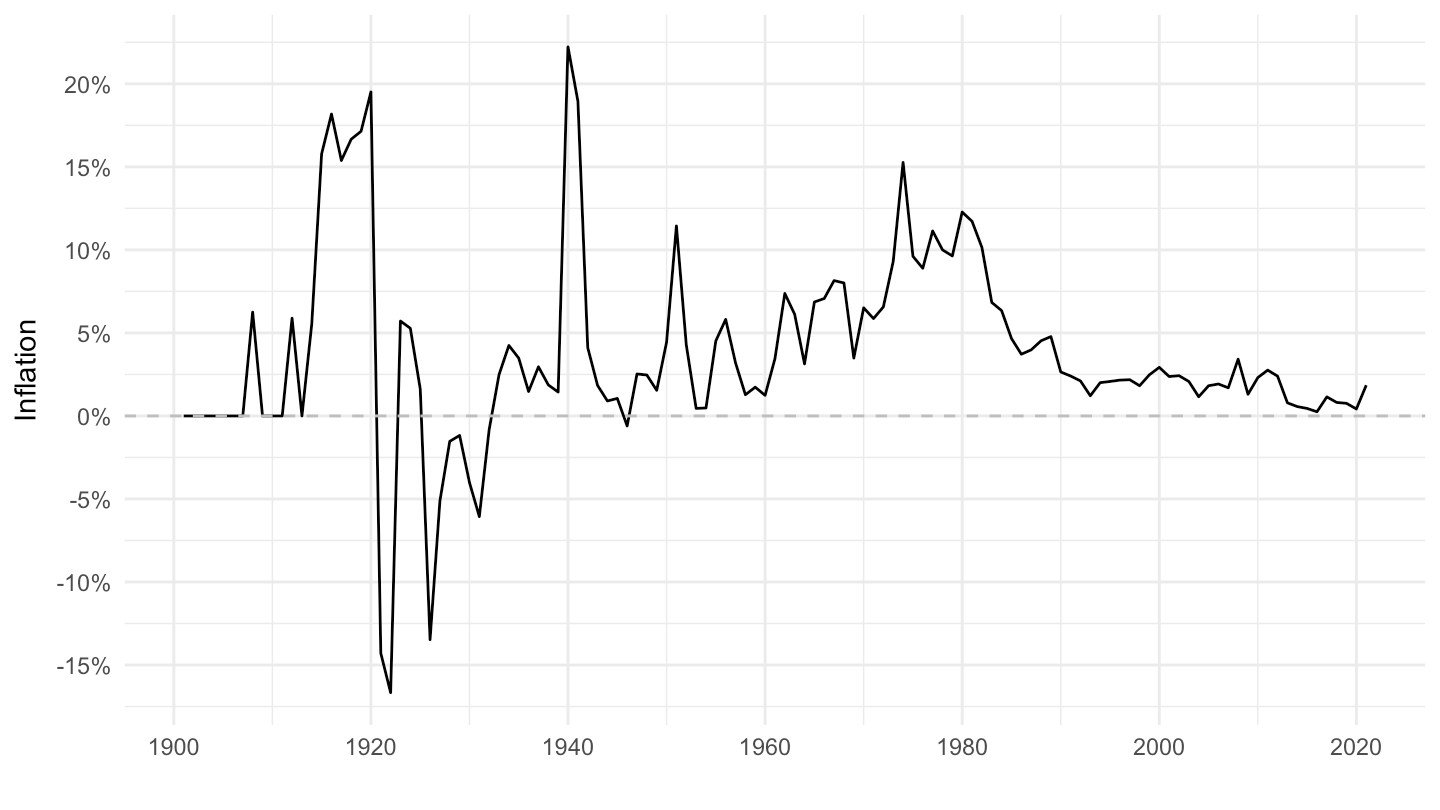
LONG_CPI |>
  filter(REF_AREA %in% c("DK"),
         UNIT_MEASURE == 771,
         FREQ == "A") |>
  year_to_date() |>
  filter(date >= as.Date("1952-01-01")) |>
  ggplot() + geom_line() + theme_minimal() +
  aes(x = date, y = OBS_VALUE/100) + xlab("") + ylab("Inflation") +
  scale_x_date(breaks = seq(1900, 2100, 5) |> paste0("-01-01") |> as.Date(),
               labels = date_format("%Y")) +
  scale_y_continuous(breaks = 0.01*seq(-10, 200, 2),
                     labels = percent_format(a = 1)) +
  geom_hline(yintercept = 0, linetype = "dashed", color = "grey")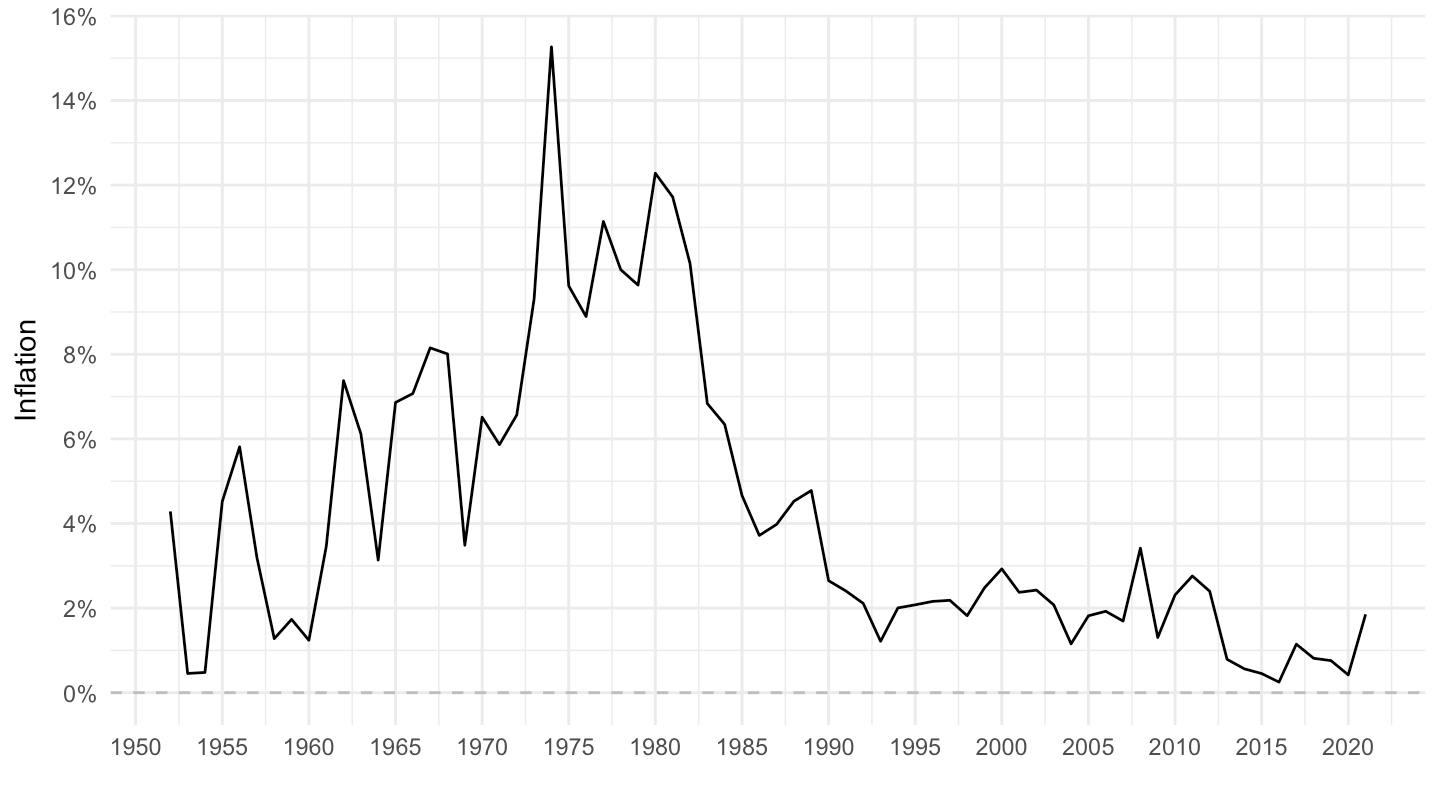
LONG_CPI |>
  filter(REF_AREA %in% c("ZA"),
         UNIT_MEASURE == 771,
         FREQ == "A") |>
  year_to_date() |>
  ggplot() + geom_line() + theme_minimal() +
  aes(x = date, y = OBS_VALUE/100) + xlab("") + ylab("Inflation") +
  scale_x_date(breaks = seq(1800, 2100, 20) |> paste0("-01-01") |> as.Date(),
               labels = date_format("%Y")) +
  scale_y_continuous(breaks = 0.01*seq(-100, 200, 5),
                     labels = percent_format(a = 1)) +
  geom_hline(yintercept = 0, linetype = "dashed", color = "grey")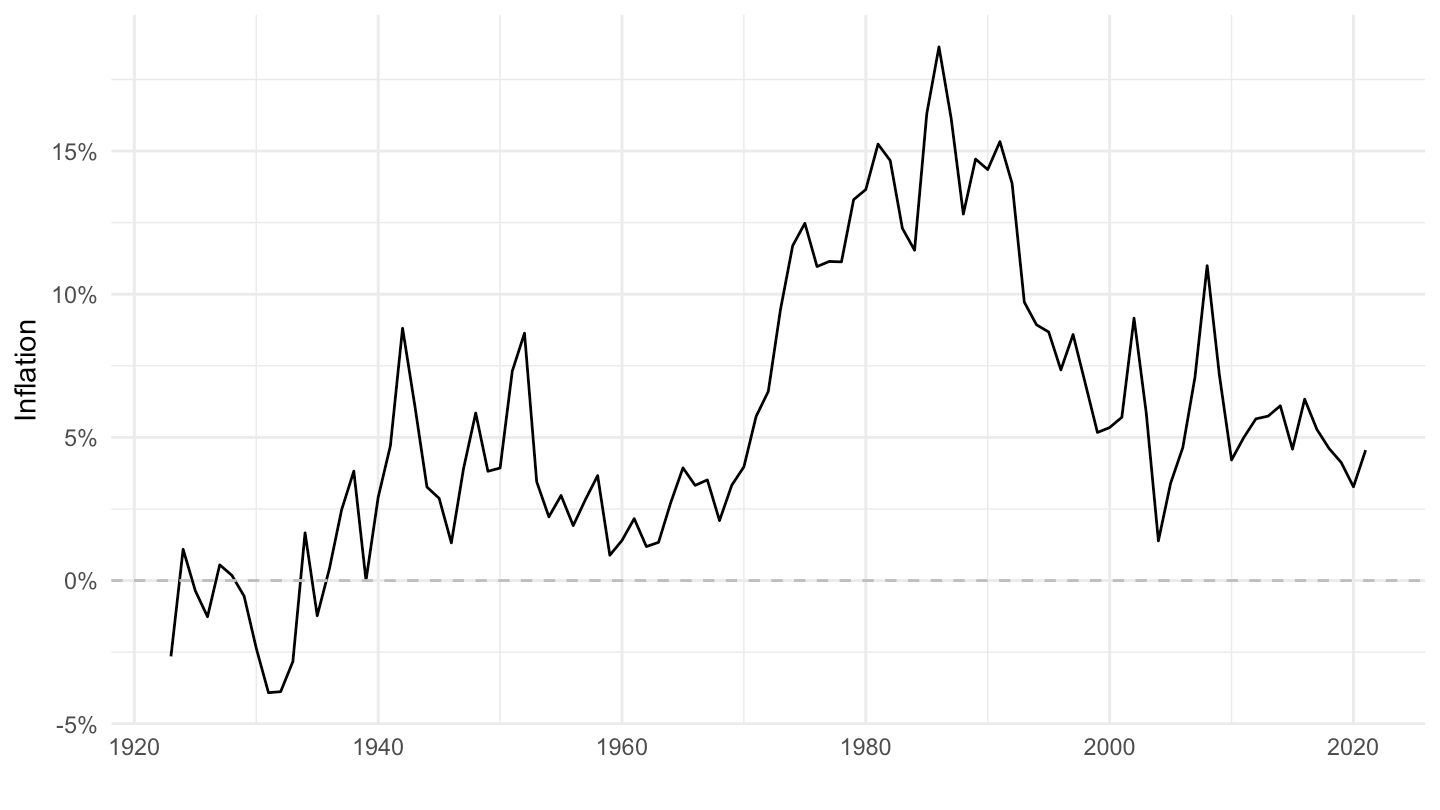
LONG_CPI |>
  filter(REF_AREA %in% c("ZA"),
         UNIT_MEASURE == 771,
         FREQ == "A") |>
  year_to_date() |>
  filter(date >= as.Date("1952-01-01")) |>
  ggplot() + geom_line() + theme_minimal() +
  aes(x = date, y = OBS_VALUE/100) + xlab("") + ylab("Inflation") +
  scale_x_date(breaks = seq(1900, 2100, 5) |> paste0("-01-01") |> as.Date(),
               labels = date_format("%Y")) +
  scale_y_continuous(breaks = 0.01*seq(-10, 200, 2),
                     labels = percent_format(a = 1)) +
  geom_hline(yintercept = 0, linetype = "dashed", color = "grey")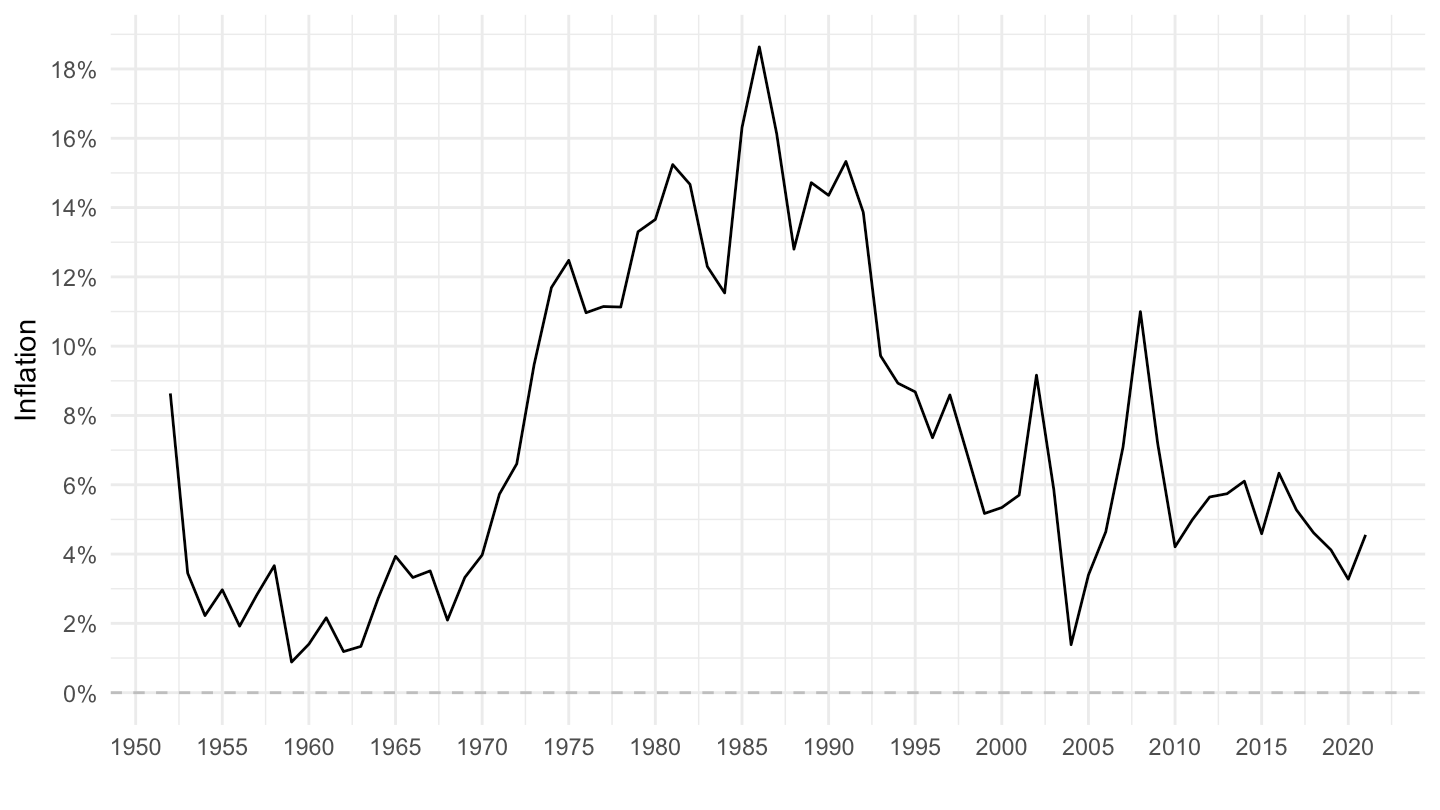
LONG_CPI |>
  filter(REF_AREA %in% c("BE"),
         UNIT_MEASURE == 771,
         FREQ == "A") |>
  year_to_date() |>
  ggplot() + geom_line() + theme_minimal() +
  aes(x = date, y = OBS_VALUE/100) + xlab("") + ylab("Inflation") +
  scale_x_date(breaks = seq(1800, 2100, 20) |> paste0("-01-01") |> as.Date(),
               labels = date_format("%Y")) +
  scale_y_continuous(breaks = 0.01*seq(-100, 200, 5),
                     labels = percent_format(a = 1)) +
  geom_hline(yintercept = 0, linetype = "dashed", color = "grey")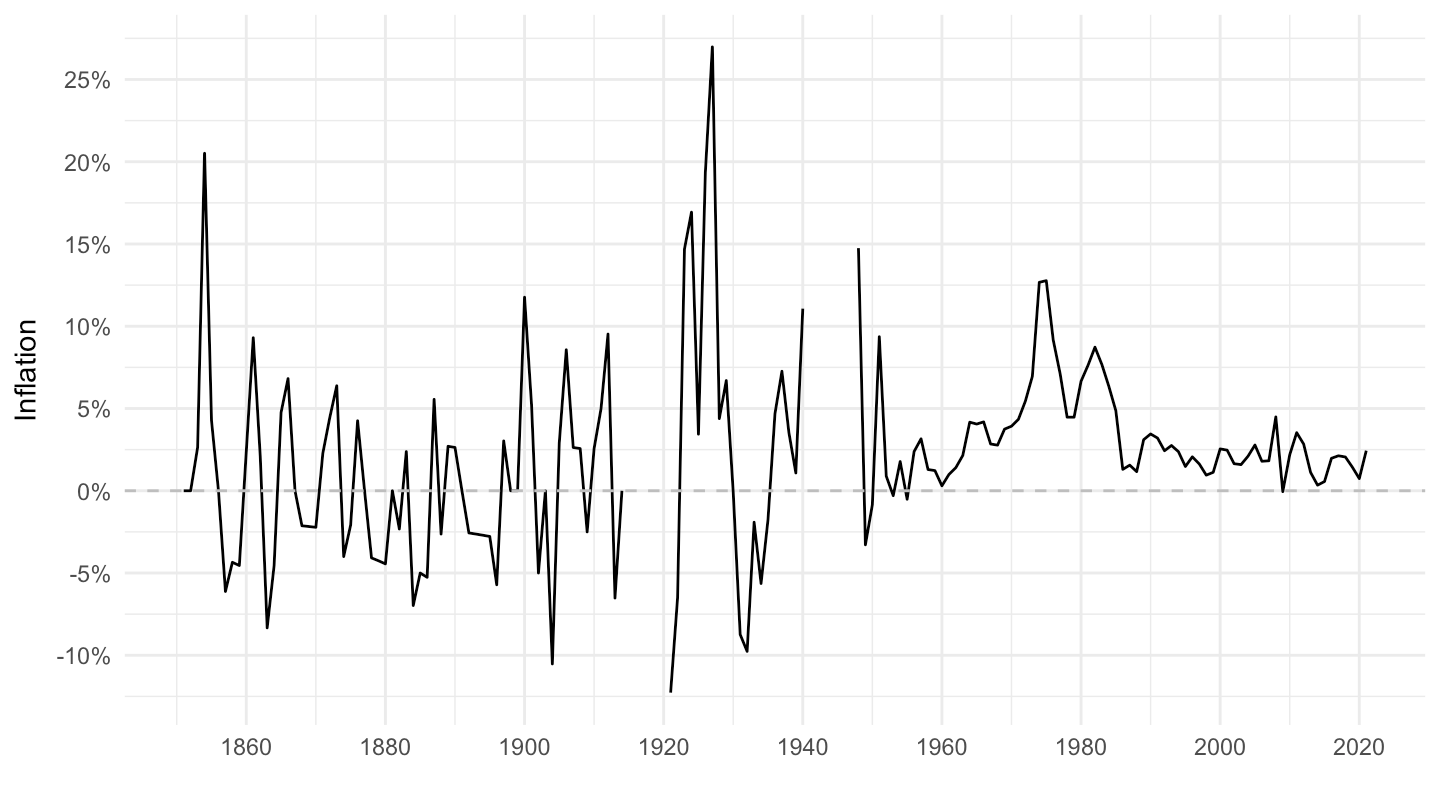
LONG_CPI |>
  filter(REF_AREA %in% c("BE"),
         UNIT_MEASURE == 771,
         FREQ == "A") |>
  year_to_date() |>
  filter(date >= as.Date("1952-01-01")) |>
  ggplot() + geom_line() + theme_minimal() +
  aes(x = date, y = OBS_VALUE/100) + xlab("") + ylab("Inflation") +
  scale_x_date(breaks = seq(1900, 2100, 5) |> paste0("-01-01") |> as.Date(),
               labels = date_format("%Y")) +
  scale_y_continuous(breaks = 0.01*seq(-10, 200, 2),
                     labels = percent_format(a = 1)) +
  geom_hline(yintercept = 0, linetype = "dashed", color = "grey")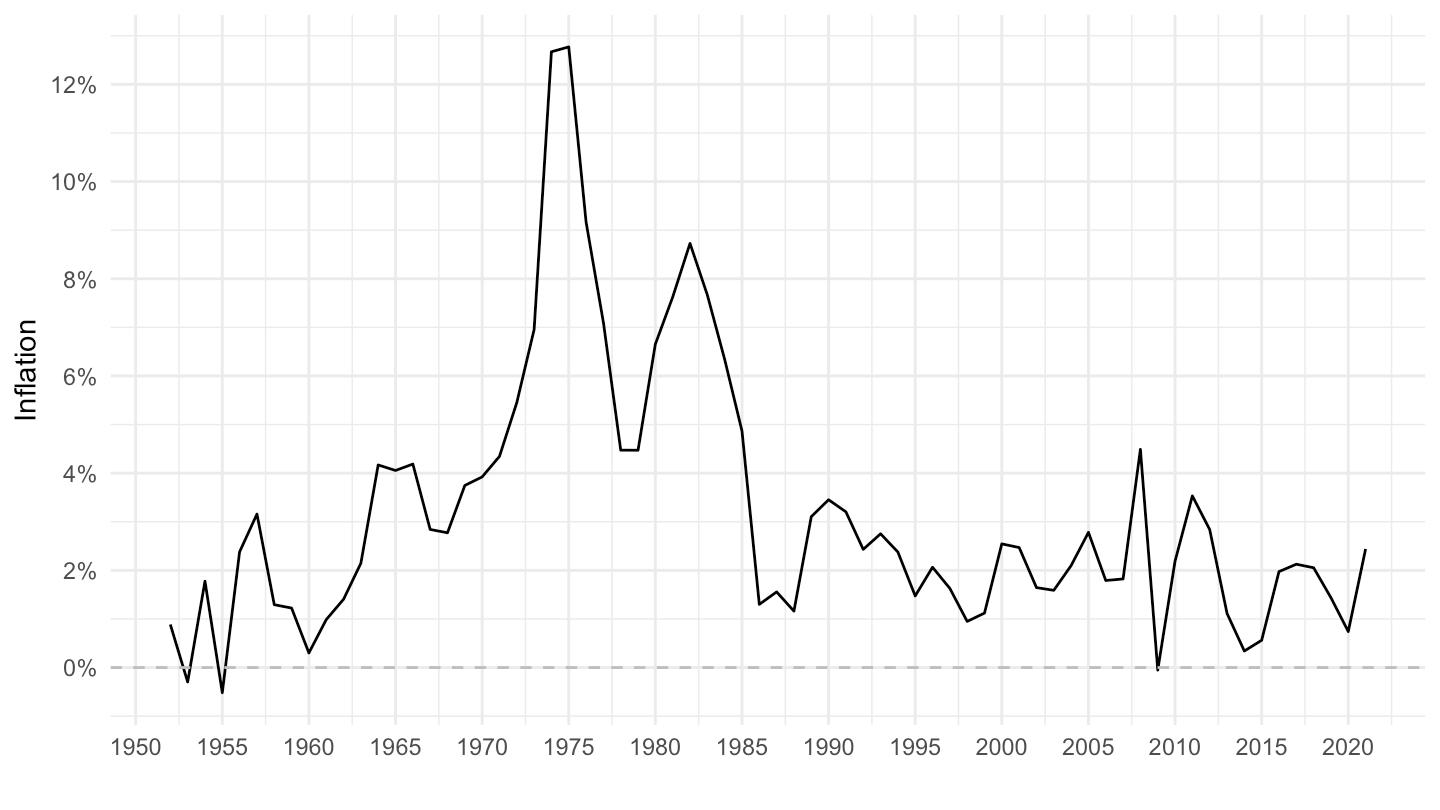
LONG_CPI |>
  filter(REF_AREA %in% c("AU"),
         UNIT_MEASURE == 771,
         FREQ == "A") |>
  year_to_date() |>
  ggplot() + geom_line() + theme_minimal() +
  aes(x = date, y = OBS_VALUE/100) + xlab("") + ylab("Inflation") +
  scale_x_date(breaks = seq(1800, 2100, 20) |> paste0("-01-01") |> as.Date(),
               labels = date_format("%Y")) +
  scale_y_continuous(breaks = 0.01*seq(-100, 200, 5),
                     labels = percent_format(a = 1)) +
  geom_hline(yintercept = 0, linetype = "dashed", color = "grey")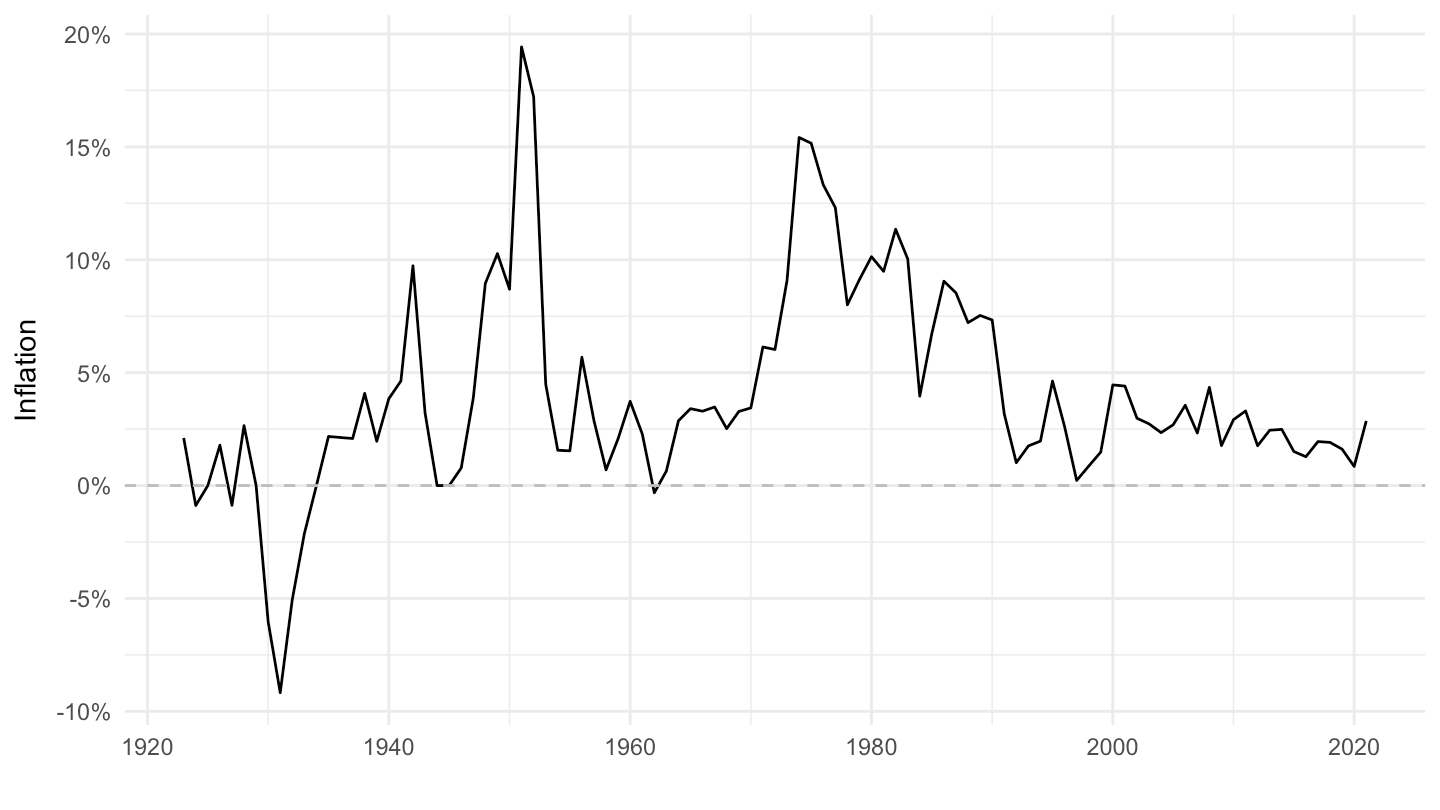
LONG_CPI |>
  filter(REF_AREA %in% c("AU"),
         UNIT_MEASURE == 771,
         FREQ == "A") |>
  year_to_date() |>
  filter(date >= as.Date("1952-01-01")) |>
  ggplot() + geom_line() + theme_minimal() +
  aes(x = date, y = OBS_VALUE/100) + xlab("") + ylab("Inflation") +
  scale_x_date(breaks = seq(1900, 2100, 5) |> paste0("-01-01") |> as.Date(),
               labels = date_format("%Y")) +
  scale_y_continuous(breaks = 0.01*seq(-10, 200, 2),
                     labels = percent_format(a = 1)) +
  geom_hline(yintercept = 0, linetype = "dashed", color = "grey")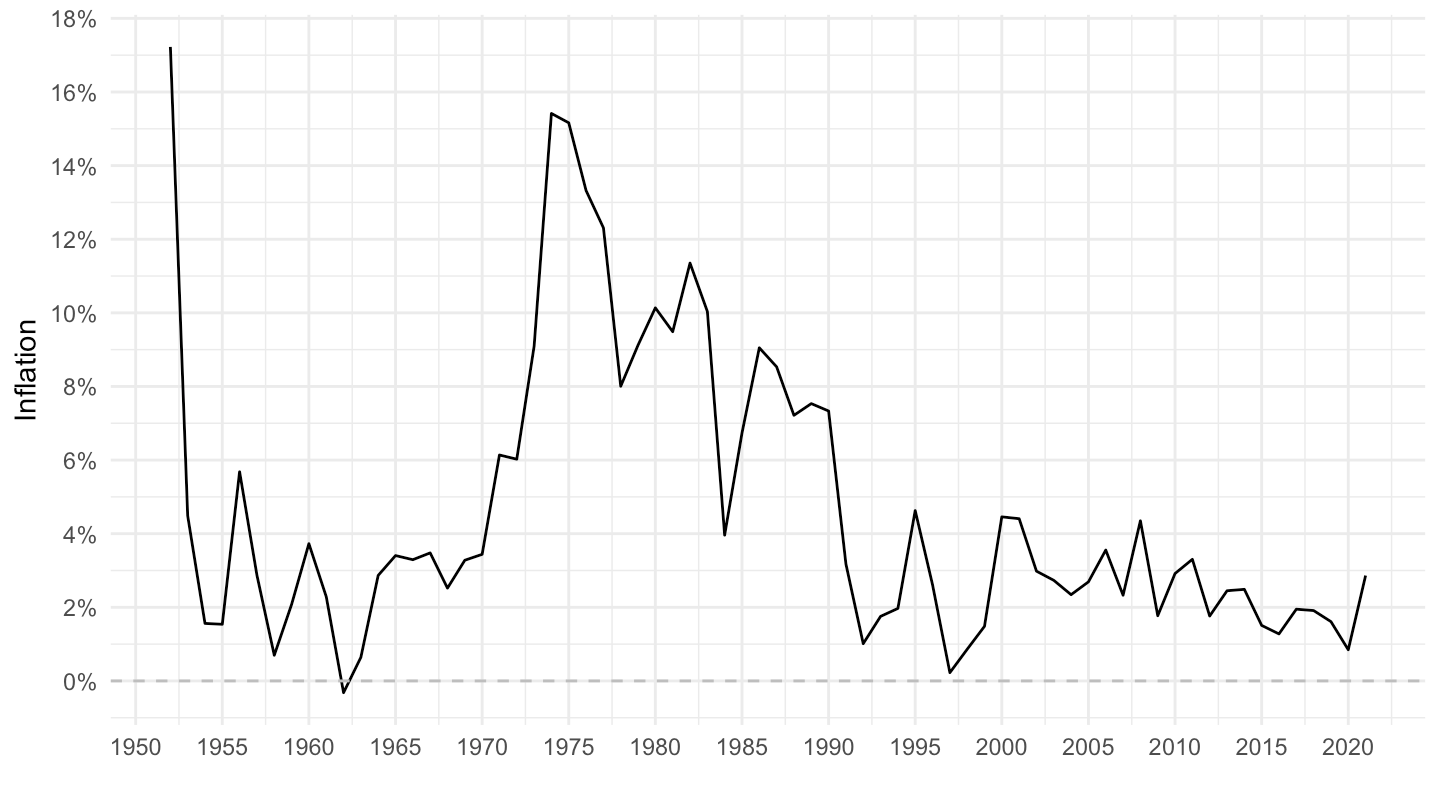
LONG_CPI |>
  filter(REF_AREA %in% c("NZ"),
         UNIT_MEASURE == 771,
         FREQ == "A") |>
  year_to_date() |>
  ggplot() + geom_line() + theme_minimal() +
  aes(x = date, y = OBS_VALUE/100) + xlab("") + ylab("Inflation") +
  scale_x_date(breaks = seq(1800, 2100, 20) |> paste0("-01-01") |> as.Date(),
               labels = date_format("%Y")) +
  scale_y_continuous(breaks = 0.01*seq(-100, 200, 5),
                     labels = percent_format(a = 1)) +
  geom_hline(yintercept = 0, linetype = "dashed", color = "grey")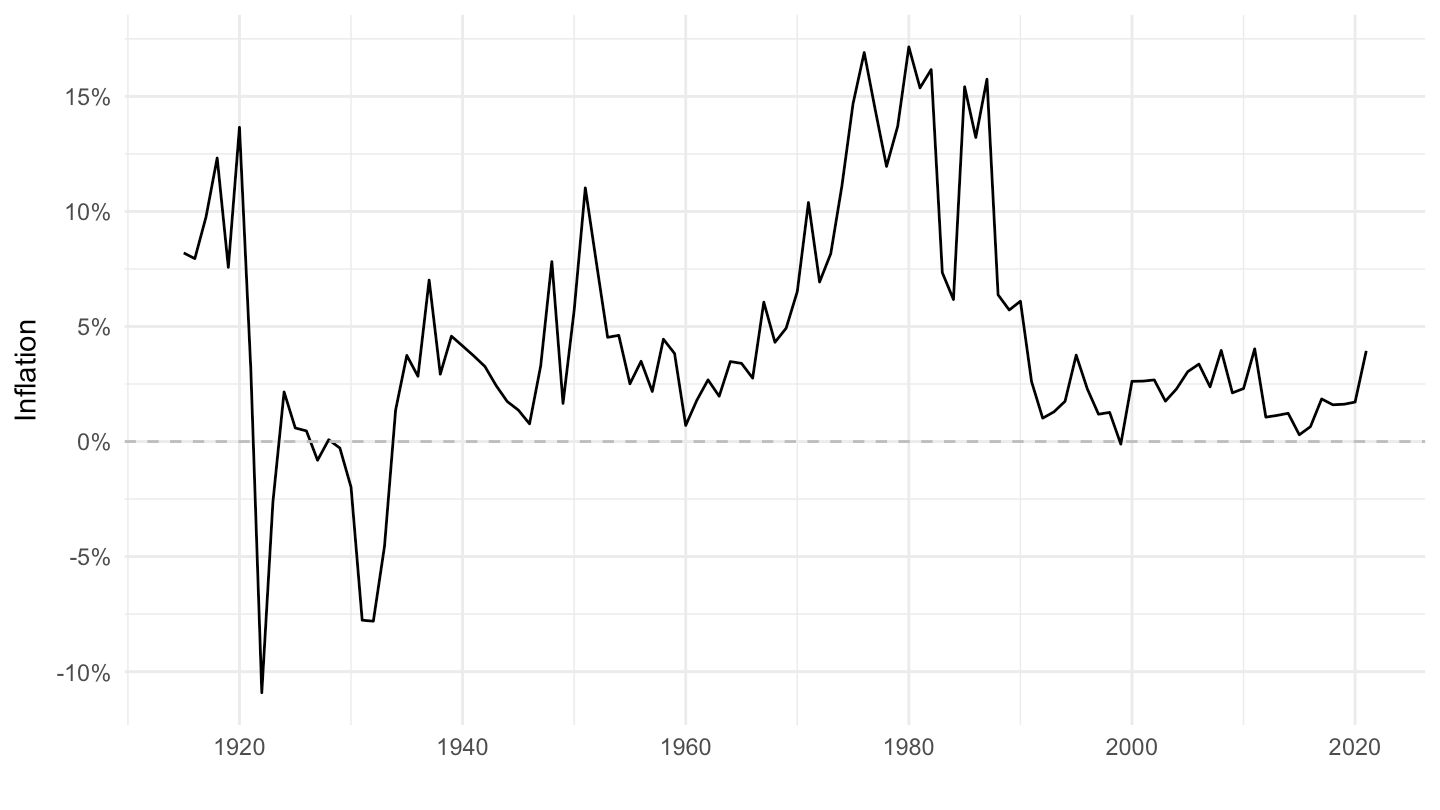
LONG_CPI |>
  filter(REF_AREA %in% c("NZ"),
         UNIT_MEASURE == 771,
         FREQ == "A") |>
  year_to_date() |>
  filter(date >= as.Date("1952-01-01")) |>
  ggplot() + geom_line() + theme_minimal() +
  aes(x = date, y = OBS_VALUE/100) + xlab("") + ylab("Inflation") +
  scale_x_date(breaks = seq(1900, 2100, 5) |> paste0("-01-01") |> as.Date(),
               labels = date_format("%Y")) +
  scale_y_continuous(breaks = 0.01*seq(-10, 200, 2),
                     labels = percent_format(a = 1)) +
  geom_hline(yintercept = 0, linetype = "dashed", color = "grey")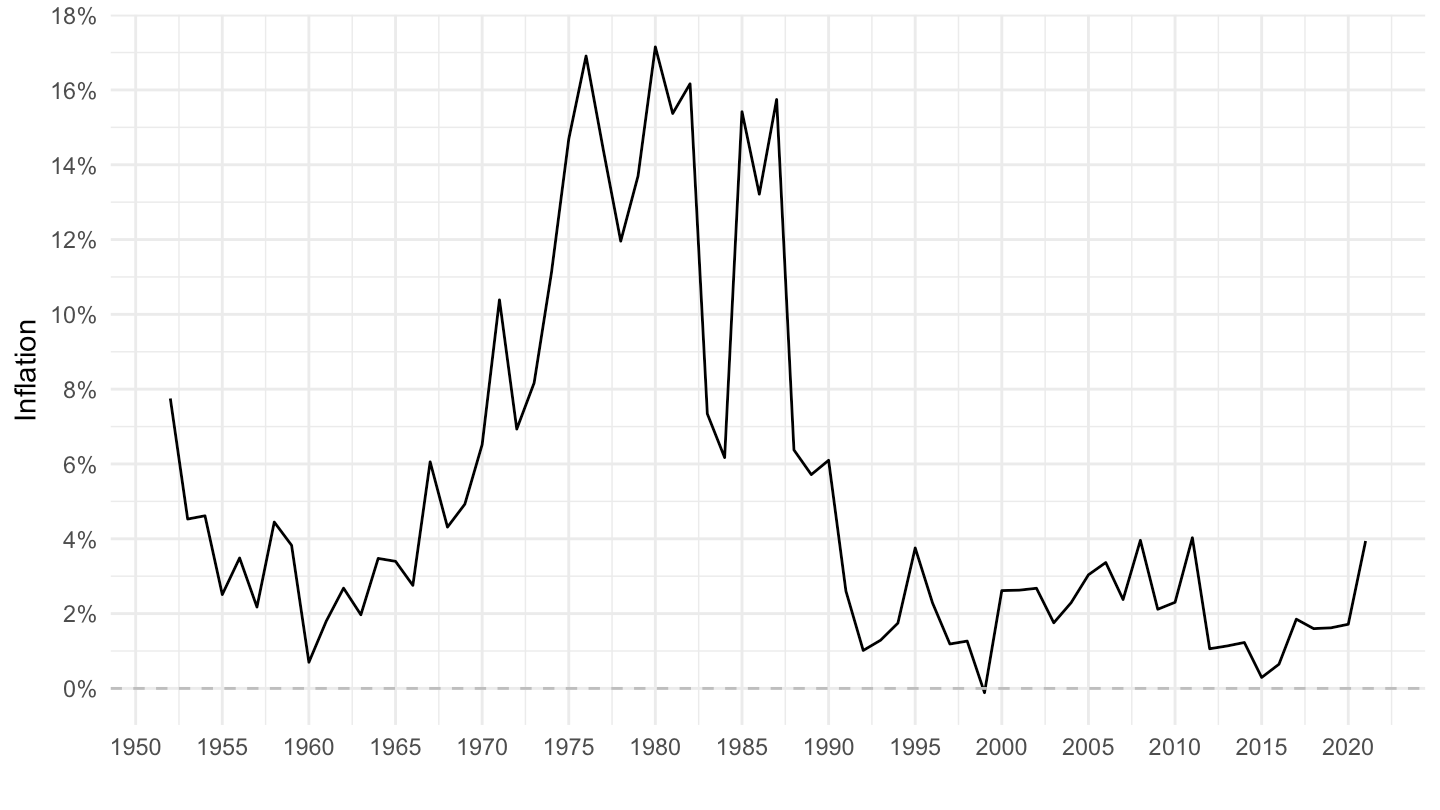
LONG_CPI |>
  filter(REF_AREA %in% c("IE"),
         UNIT_MEASURE == 771,
         FREQ == "A") |>
  year_to_date() |>
  ggplot() + geom_line() + theme_minimal() +
  aes(x = date, y = OBS_VALUE/100) + xlab("") + ylab("Inflation") +
  scale_x_date(breaks = seq(1800, 2100, 20) |> paste0("-01-01") |> as.Date(),
               labels = date_format("%Y")) +
  scale_y_continuous(breaks = 0.01*seq(-100, 200, 5),
                     labels = percent_format(a = 1)) +
  geom_hline(yintercept = 0, linetype = "dashed", color = "grey")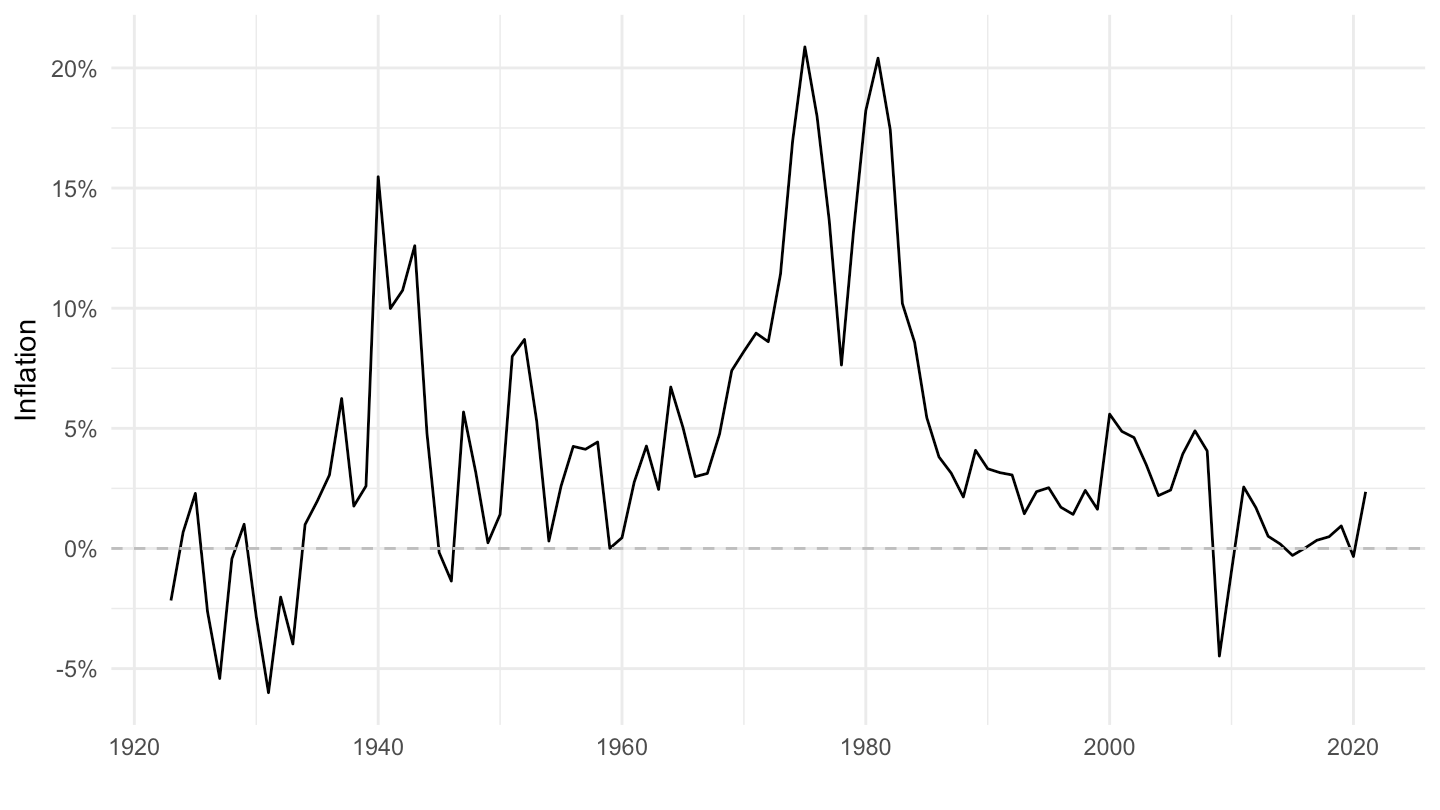
LONG_CPI |>
  filter(REF_AREA %in% c("IE"),
         UNIT_MEASURE == 771,
         FREQ == "A") |>
  year_to_date() |>
  filter(date >= as.Date("1952-01-01")) |>
  ggplot() + geom_line() + theme_minimal() +
  aes(x = date, y = OBS_VALUE/100) + xlab("") + ylab("Inflation") +
  scale_x_date(breaks = seq(1900, 2100, 5) |> paste0("-01-01") |> as.Date(),
               labels = date_format("%Y")) +
  scale_y_continuous(breaks = 0.01*seq(-10, 200, 2),
                     labels = percent_format(a = 1)) +
  geom_hline(yintercept = 0, linetype = "dashed", color = "grey")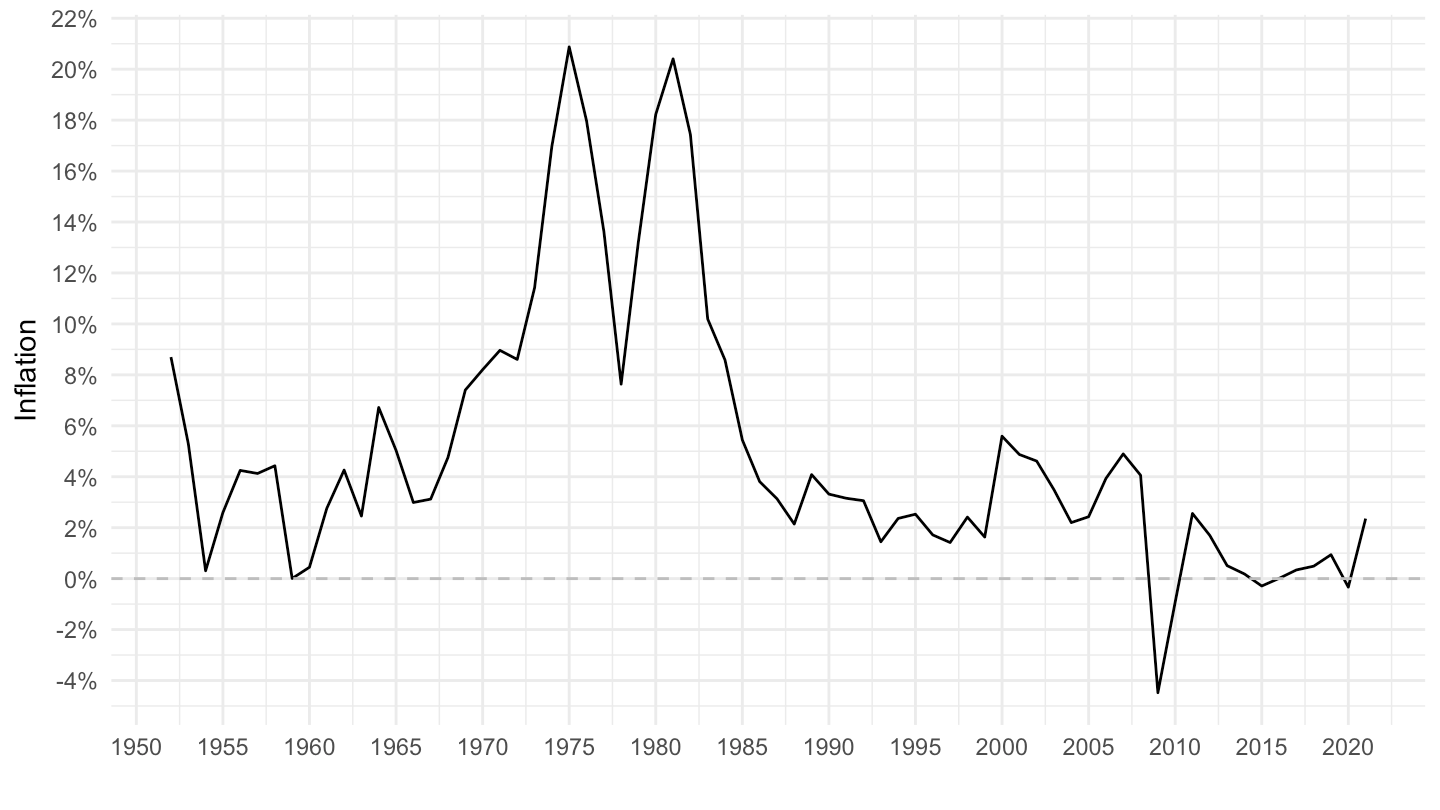
LONG_CPI |>
  filter(REF_AREA %in% c("IS"),
         UNIT_MEASURE == 771,
         FREQ == "A") |>
  year_to_date() |>
  ggplot() + geom_line() + theme_minimal() +
  aes(x = date, y = OBS_VALUE/100) + xlab("") + ylab("Inflation") +
  scale_x_date(breaks = seq(1800, 2100, 20) |> paste0("-01-01") |> as.Date(),
               labels = date_format("%Y")) +
  scale_y_continuous(breaks = 0.01*seq(-100, 600, 20),
                     labels = percent_format(a = 1)) +
  geom_hline(yintercept = 0, linetype = "dashed", color = "grey")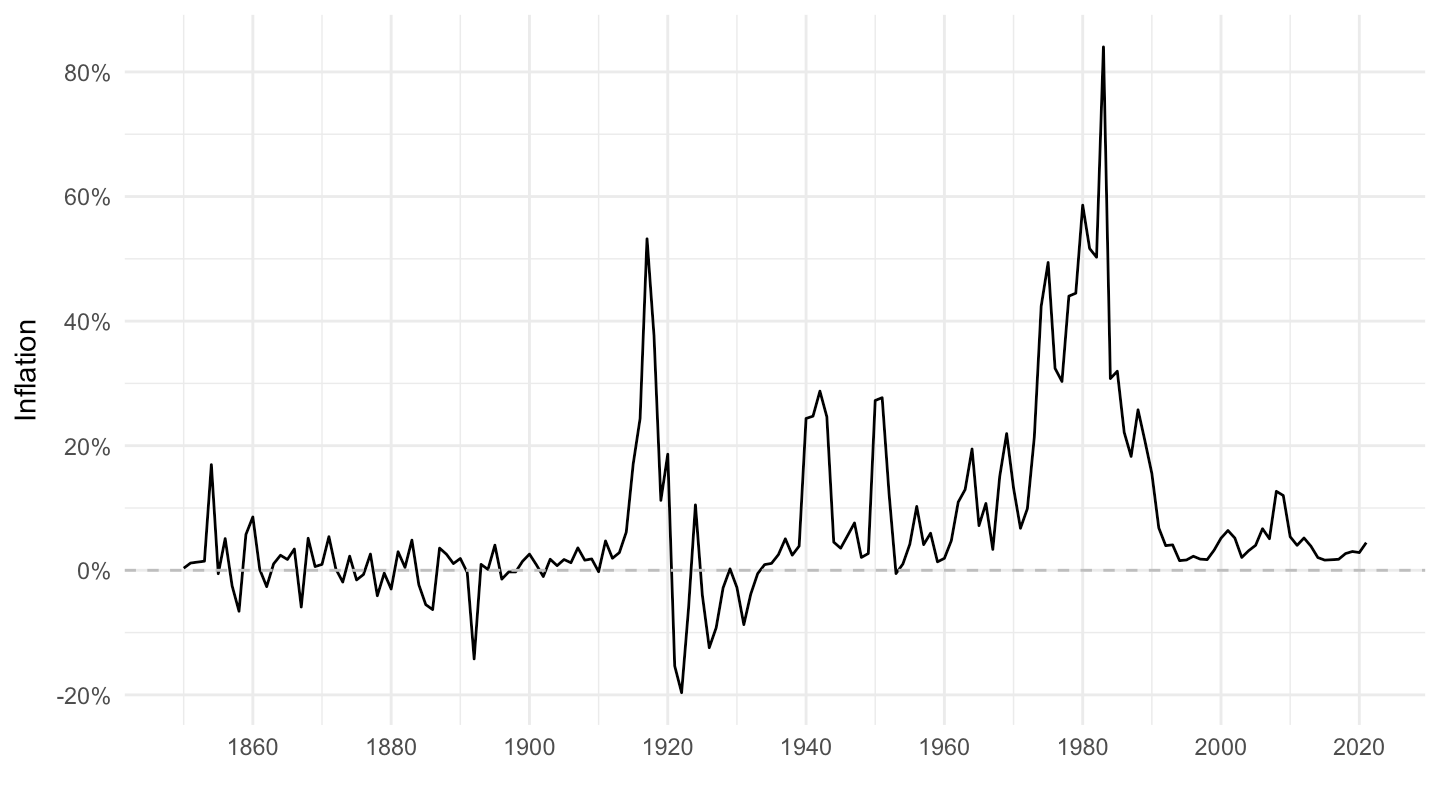
LONG_CPI |>
  filter(REF_AREA %in% c("CL"),
         UNIT_MEASURE == 771,
         FREQ == "A") |>
  year_to_date() |>
  filter(date >= as.Date("1952-01-01")) |>
  ggplot() + geom_line() + theme_minimal() +
  aes(x = date, y = OBS_VALUE/100) + xlab("") + ylab("Inflation") +
  scale_x_date(breaks = seq(1900, 2100, 5) |> paste0("-01-01") |> as.Date(),
               labels = date_format("%Y")) +
  scale_y_continuous(breaks = 0.01*seq(-100, 600, 20),
                     labels = percent_format(a = 1)) +
  geom_hline(yintercept = 0, linetype = "dashed", color = "grey")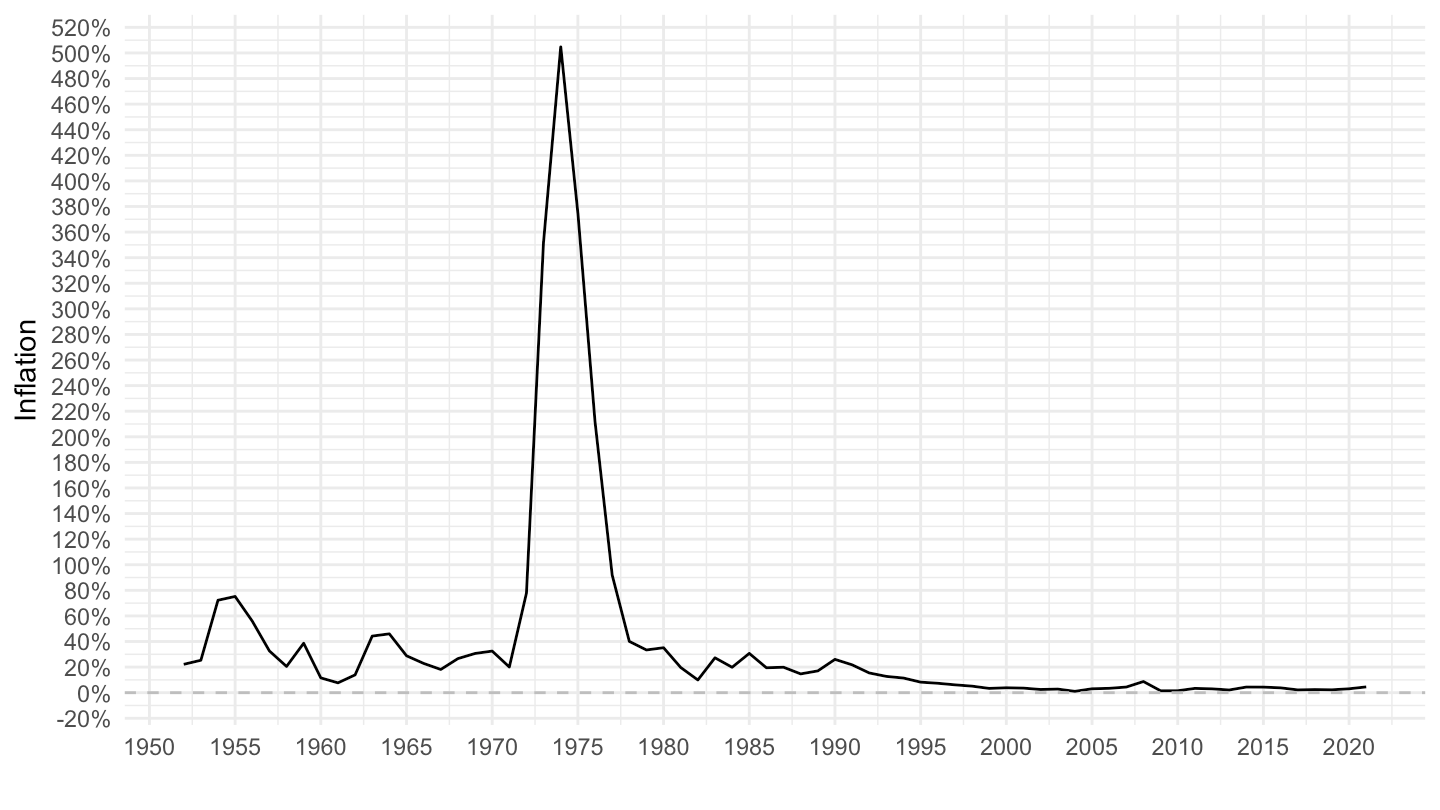
LONG_CPI |>
  filter(REF_AREA %in% c("IS"),
         UNIT_MEASURE == 771,
         FREQ == "A") |>
  year_to_date() |>
  ggplot() + geom_line() + theme_minimal() +
  aes(x = date, y = OBS_VALUE/100) + xlab("") + ylab("Inflation") +
  scale_x_date(breaks = seq(1800, 2100, 20) |> paste0("-01-01") |> as.Date(),
               labels = date_format("%Y")) +
  scale_y_continuous(breaks = 0.01*seq(-100, 600, 20),
                     labels = percent_format(a = 1)) +
  geom_hline(yintercept = 0, linetype = "dashed", color = "grey")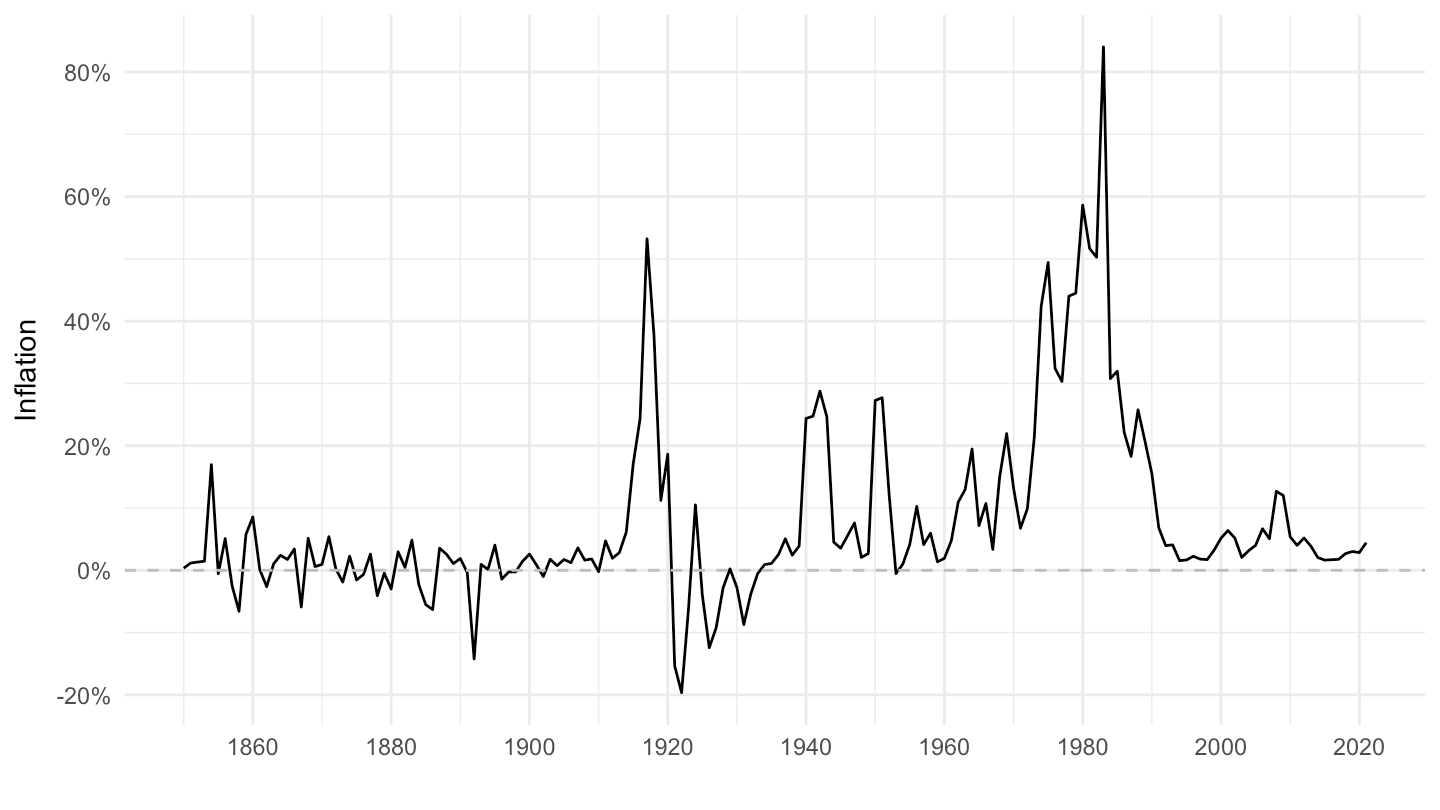
LONG_CPI |>
  filter(REF_AREA %in% c("IS"),
         UNIT_MEASURE == 771,
         FREQ == "A") |>
  year_to_date() |>
  filter(date >= as.Date("1952-01-01")) |>
  ggplot() + geom_line() + theme_minimal() +
  aes(x = date, y = OBS_VALUE/100) + xlab("") + ylab("Inflation") +
  scale_x_date(breaks = seq(1900, 2100, 5) |> paste0("-01-01") |> as.Date(),
               labels = date_format("%Y")) +
  scale_y_continuous(breaks = 0.01*seq(-100, 600, 20),
                     labels = percent_format(a = 1)) +
  geom_hline(yintercept = 0, linetype = "dashed", color = "grey")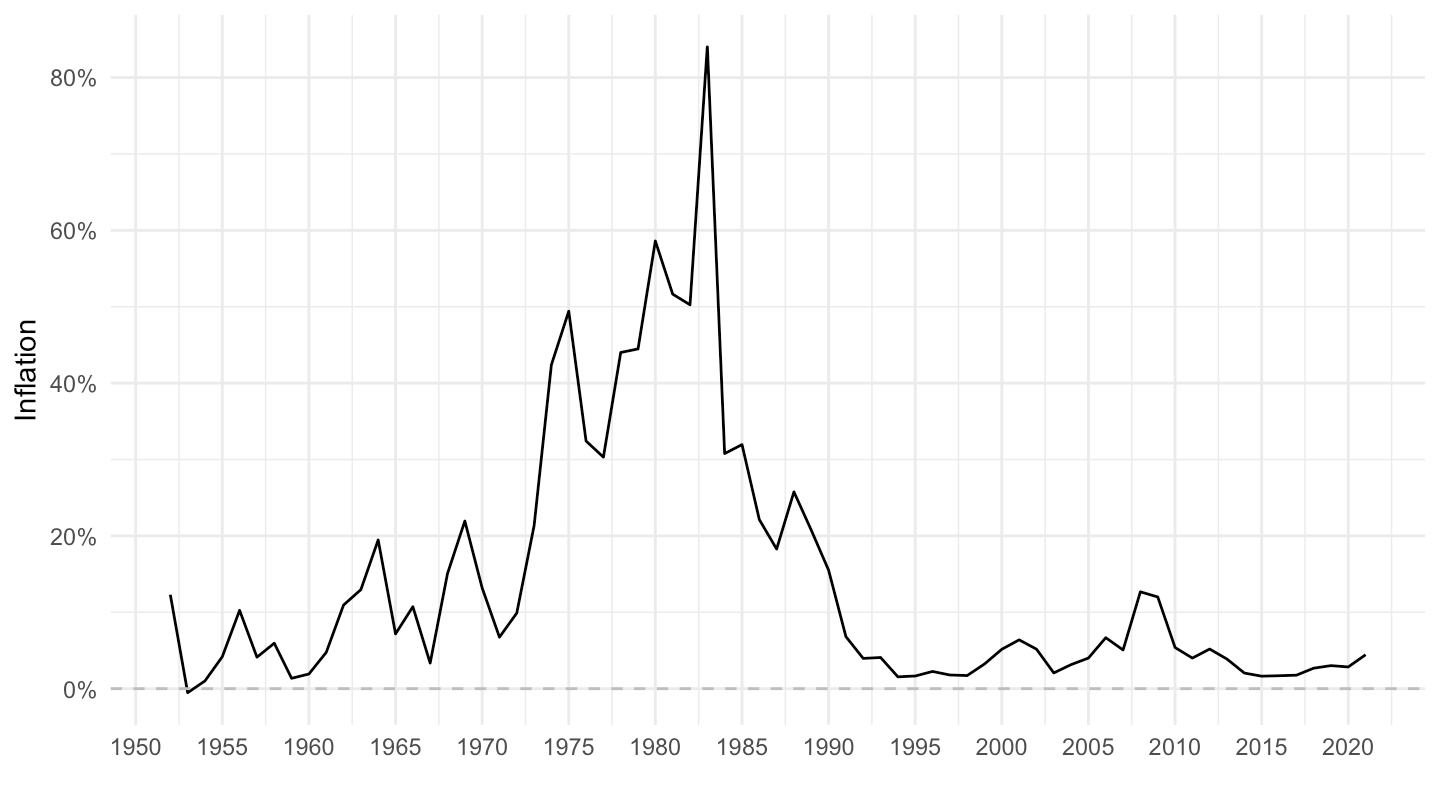
LONG_CPI |>
  filter(REF_AREA %in% c("SE"),
         UNIT_MEASURE == 771,
         FREQ == "A") |>
  year_to_date() |>
  ggplot() + geom_line() + theme_minimal() +
  aes(x = date, y = OBS_VALUE/100) + xlab("") + ylab("Inflation") +
  scale_x_date(breaks = seq(1800, 2100, 20) |> paste0("-01-01") |> as.Date(),
               labels = date_format("%Y")) +
  scale_y_continuous(breaks = 0.01*seq(-100, 600, 10),
                     labels = percent_format(a = 1)) +
  geom_hline(yintercept = 0, linetype = "dashed", color = "grey")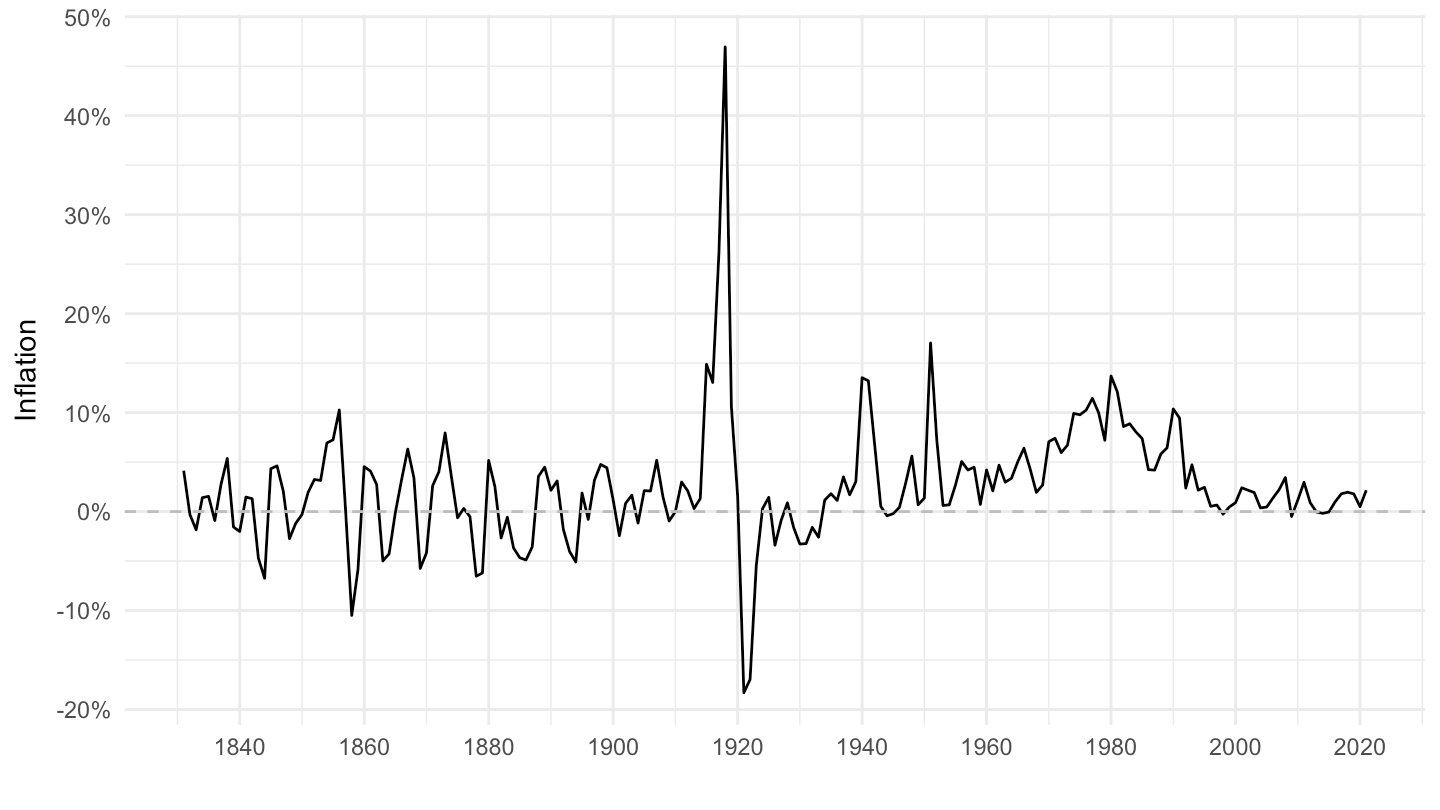
LONG_CPI |>
  filter(REF_AREA %in% c("SE"),
         UNIT_MEASURE == 771,
         FREQ == "A") |>
  year_to_date() |>
  filter(date >= as.Date("1952-01-01")) |>
  ggplot() + geom_line() + theme_minimal() +
  aes(x = date, y = OBS_VALUE/100) + xlab("") + ylab("Inflation") +
  scale_x_date(breaks = seq(1900, 2100, 5) |> paste0("-01-01") |> as.Date(),
               labels = date_format("%Y")) +
  scale_y_continuous(breaks = 0.01*seq(-100, 600, 2),
                     labels = percent_format(a = 1)) +
  geom_hline(yintercept = 0, linetype = "dashed", color = "grey")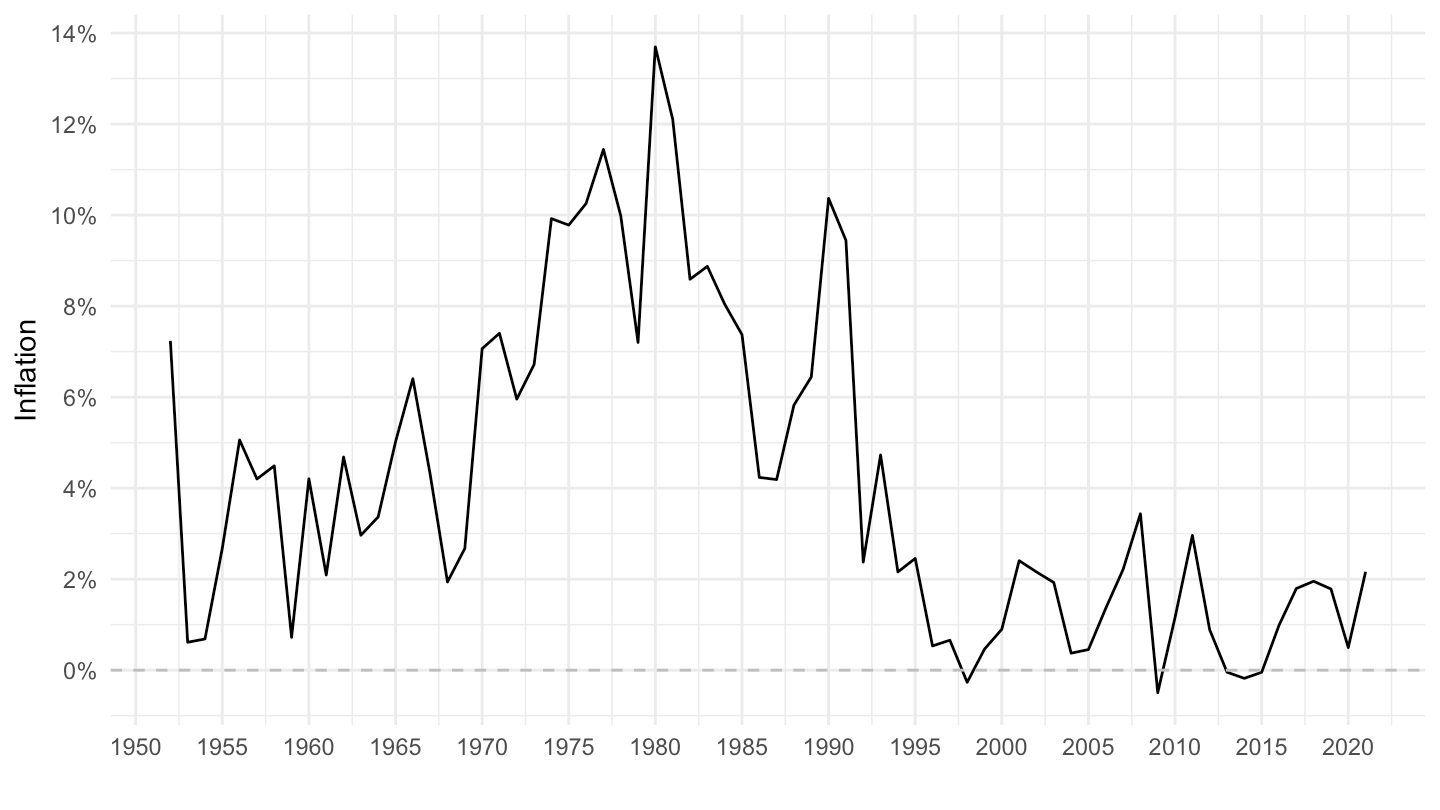
LONG_CPI |>
  filter(REF_AREA %in% c("AR"),
         UNIT_MEASURE == 771,
         FREQ == "A") |>
  year_to_date() |>
  ggplot() + geom_line() + theme_minimal() +
  aes(x = date, y = OBS_VALUE/100) + xlab("") + ylab("Inflation") +
  scale_x_date(breaks = seq(1800, 2100, 10) |> paste0("-01-01") |> as.Date(),
               labels = date_format("%Y")) +
  scale_y_continuous(breaks = 0.01*seq(-200, 10000, 200),
                     labels = percent_format(a = 1)) +
  geom_hline(yintercept = 0, linetype = "dashed", color = "grey")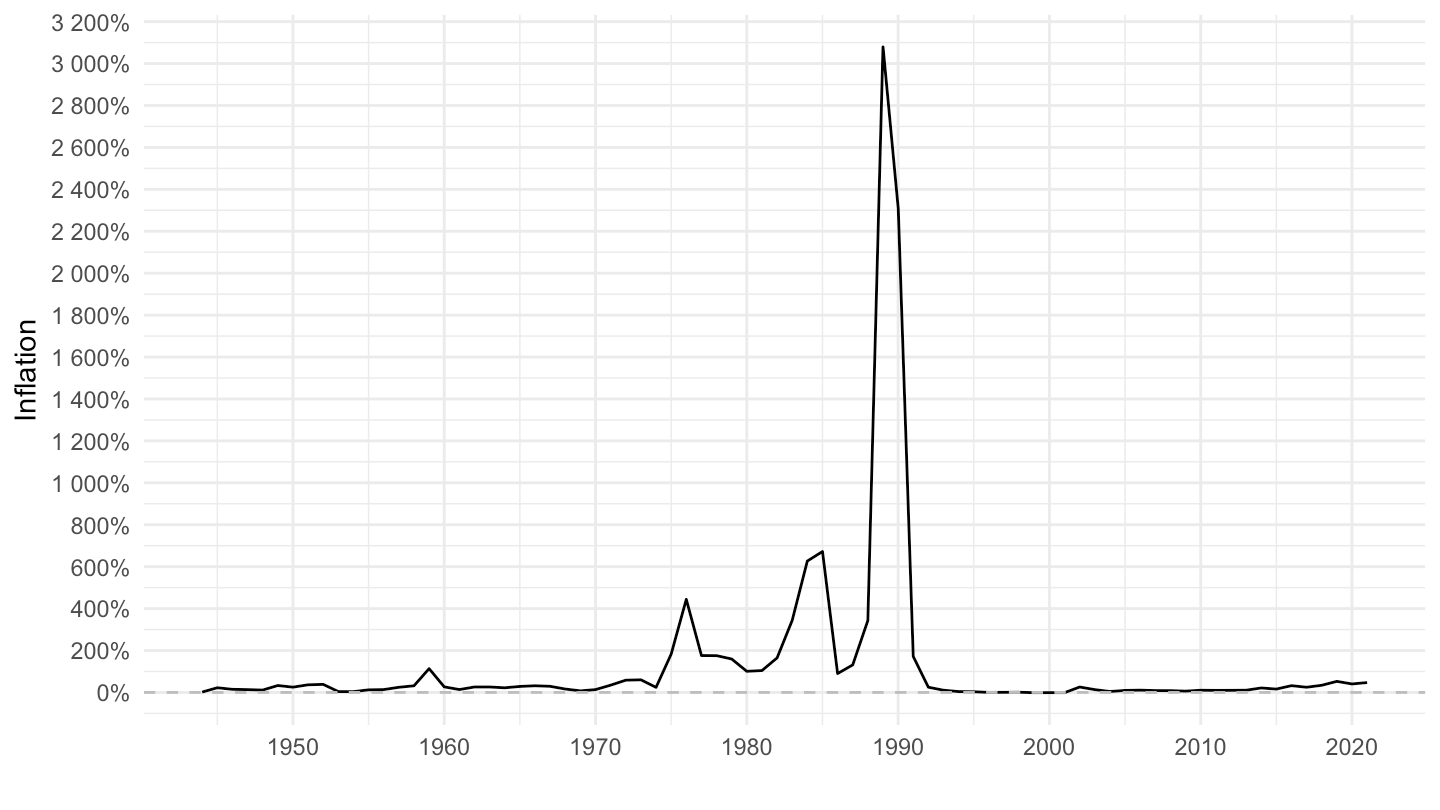
LONG_CPI |>
  filter(REF_AREA %in% c("AR"),
         UNIT_MEASURE == 771,
         FREQ == "A") |>
  year_to_date() |>
  filter(date >= as.Date("1952-01-01")) |>
  ggplot() + geom_line() + theme_minimal() +
  aes(x = date, y = OBS_VALUE/100) + xlab("") + ylab("Inflation") +
  scale_x_date(breaks = seq(1900, 2100, 5) |> paste0("-01-01") |> as.Date(),
               labels = date_format("%Y")) +
  scale_y_continuous(breaks = 0.01*seq(-200, 10000, 200),
                     labels = percent_format(a = 1)) +
  geom_hline(yintercept = 0, linetype = "dashed", color = "grey")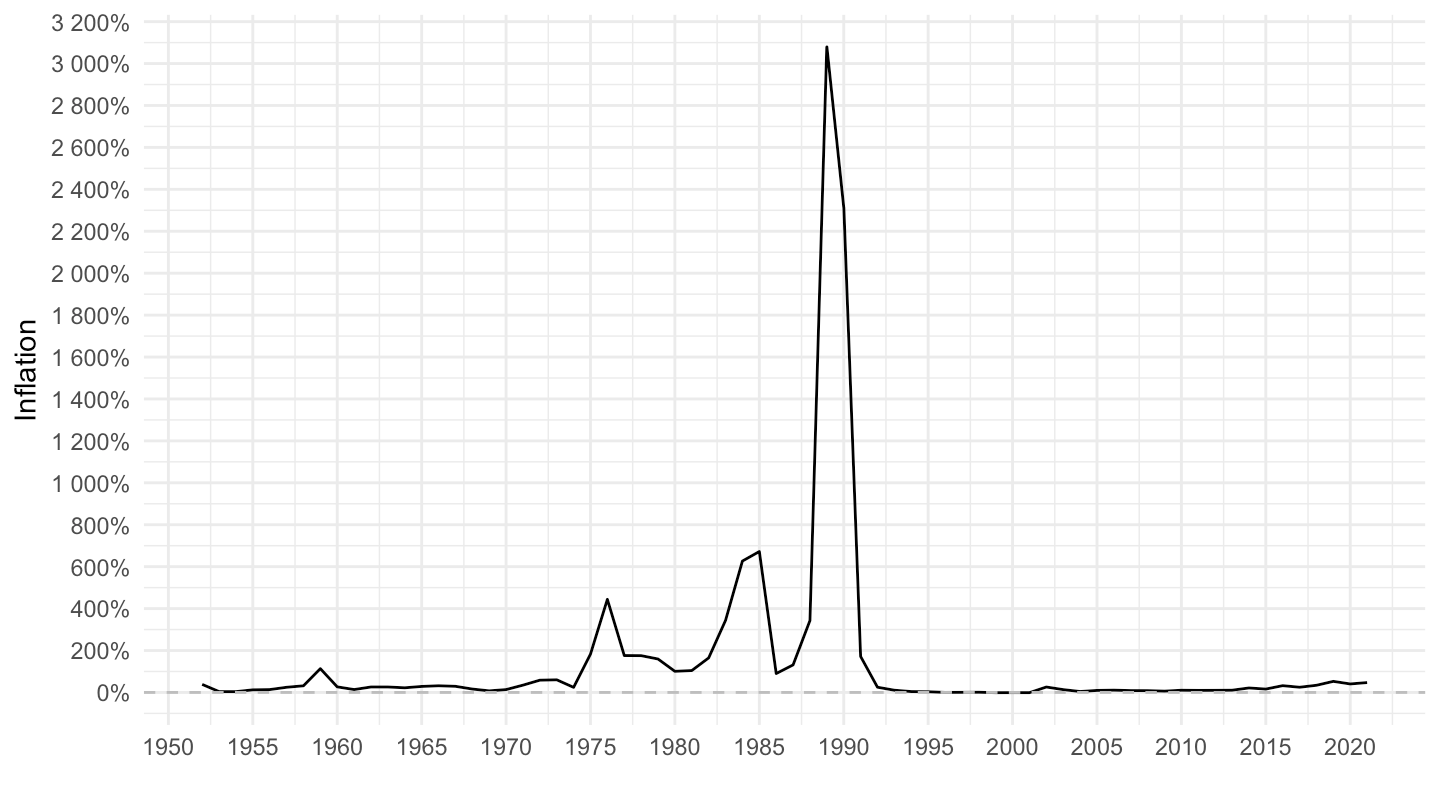
LONG_CPI |>
  filter(REF_AREA %in% c("AR"),
         UNIT_MEASURE == 771,
         FREQ == "A") |>
  year_to_date() |>
  filter(date >= as.Date("1992-01-01")) |>
  ggplot() + geom_line() + theme_minimal() +
  aes(x = date, y = OBS_VALUE/100) + xlab("") + ylab("Inflation") +
  scale_x_date(breaks = seq(1900, 2100, 2) |> paste0("-01-01") |> as.Date(),
               labels = date_format("%Y")) +
  scale_y_continuous(breaks = 0.01*seq(-10, 80, 5),
                     labels = percent_format(a = 1)) +
  geom_hline(yintercept = 0, linetype = "dashed", color = "grey")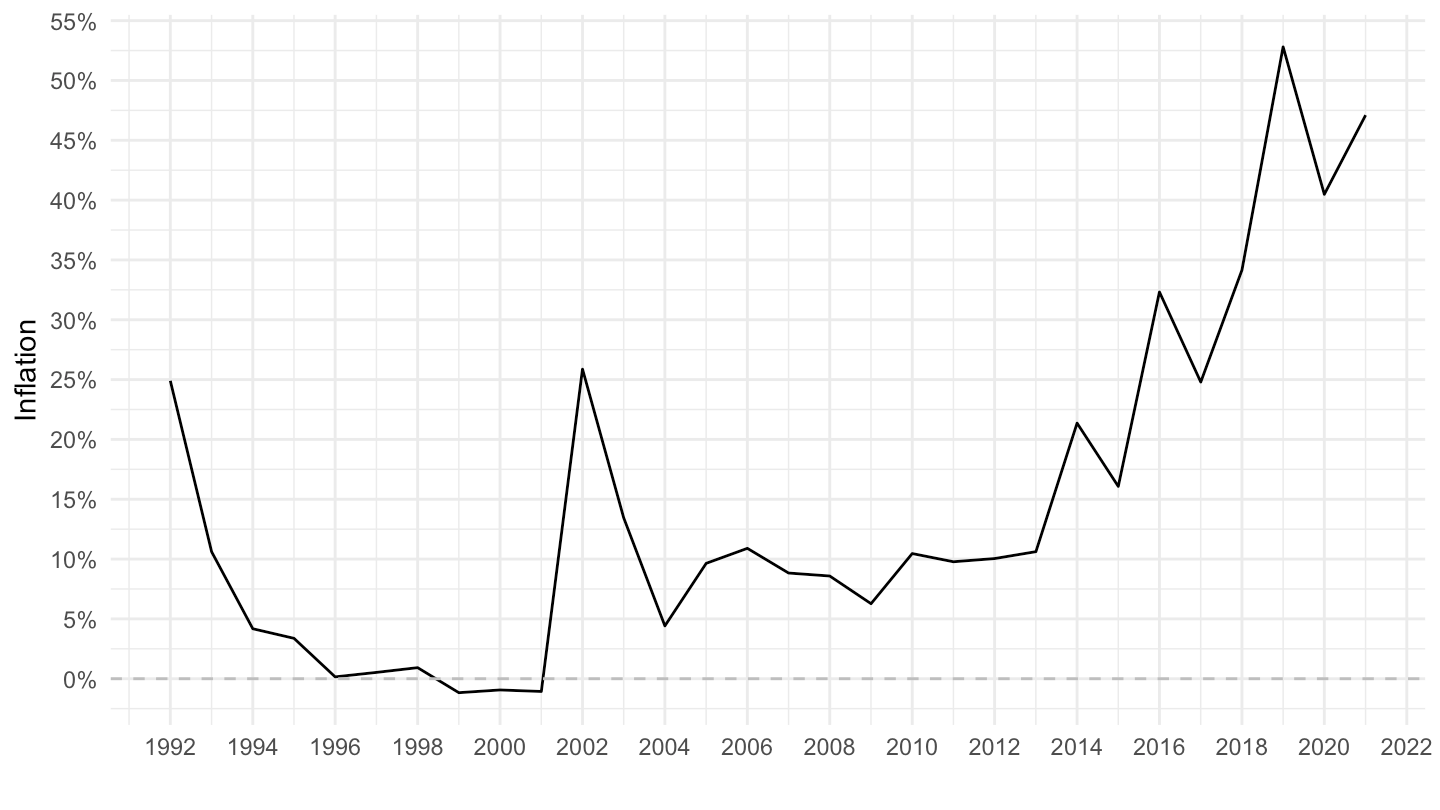
LONG_CPI |>
  filter(REF_AREA %in% c("AR"),
         UNIT_MEASURE == 771,
         FREQ == "A") |>
  year_to_date() |>
  filter(date >= as.Date("1996-01-01") & date <= as.Date("2005-01-01")) |>
  ggplot() + geom_line() + theme_minimal() +
  aes(x = date, y = OBS_VALUE/100) + xlab("") + ylab("Inflation") +
  scale_x_date(breaks = seq(1900, 2100, 1) |> paste0("-01-01") |> as.Date(),
               labels = date_format("%Y")) +
  scale_y_continuous(breaks = 0.01*seq(-10, 80, 5),
                     labels = percent_format(a = 1)) +
  geom_hline(yintercept = 0, linetype = "dashed", color = "grey")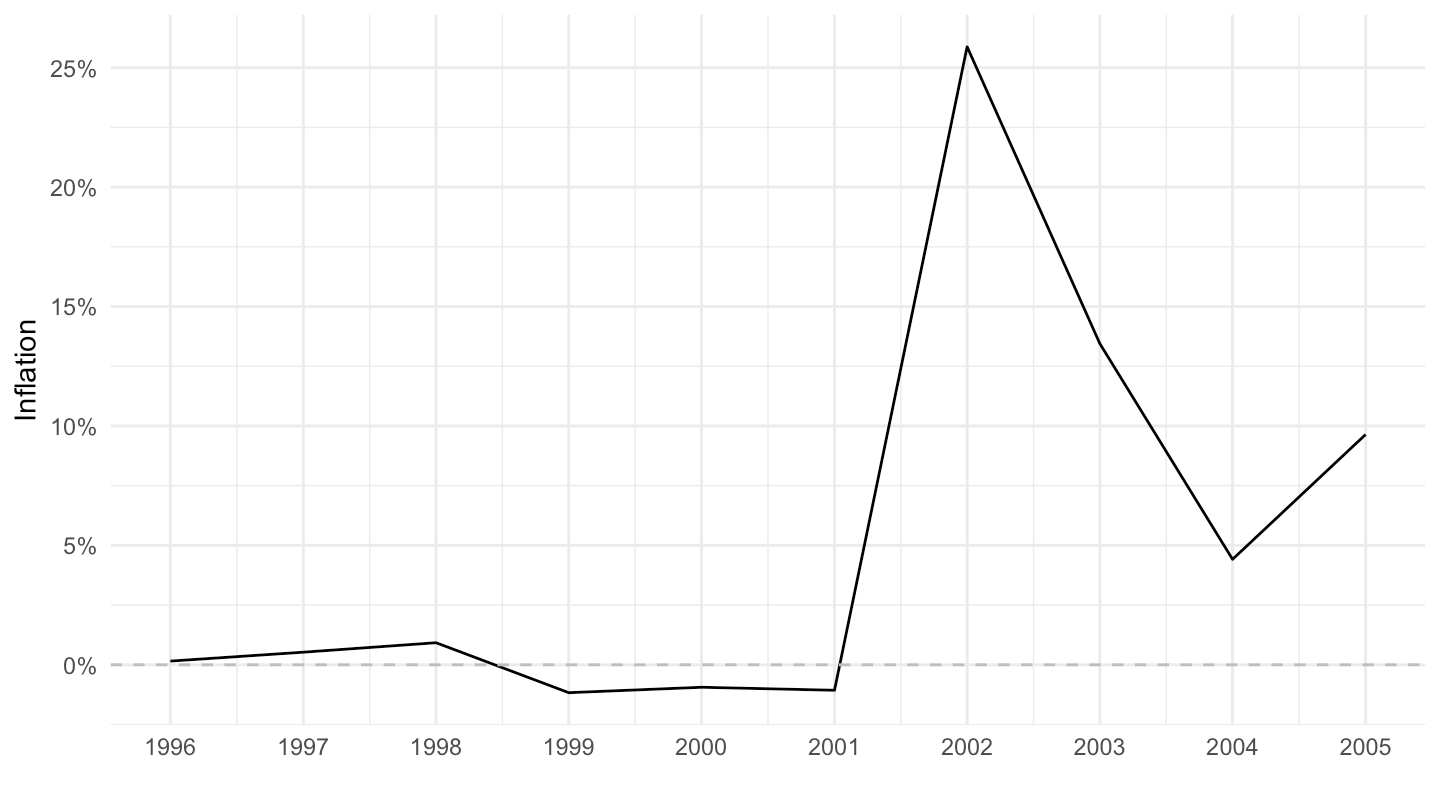
LONG_CPI |>
  filter(REF_AREA %in% c("AR"),
         UNIT_MEASURE == 771,
         FREQ == "A") |>
  year_to_date() |>
  filter(date >= as.Date("1992-01-01") & date <= as.Date("2005-01-01")) |>
  ggplot() + geom_line() + theme_minimal() +
  aes(x = date, y = OBS_VALUE/100) + xlab("") + ylab("Inflation") +
  scale_x_date(breaks = seq(1900, 2100, 1) |> paste0("-01-01") |> as.Date(),
               labels = date_format("%Y")) +
  scale_y_continuous(breaks = 0.01*seq(-100, 10000, 5),
                     labels = percent_format(a = 1)) +
  geom_hline(yintercept = 0, linetype = "dashed", color = "grey")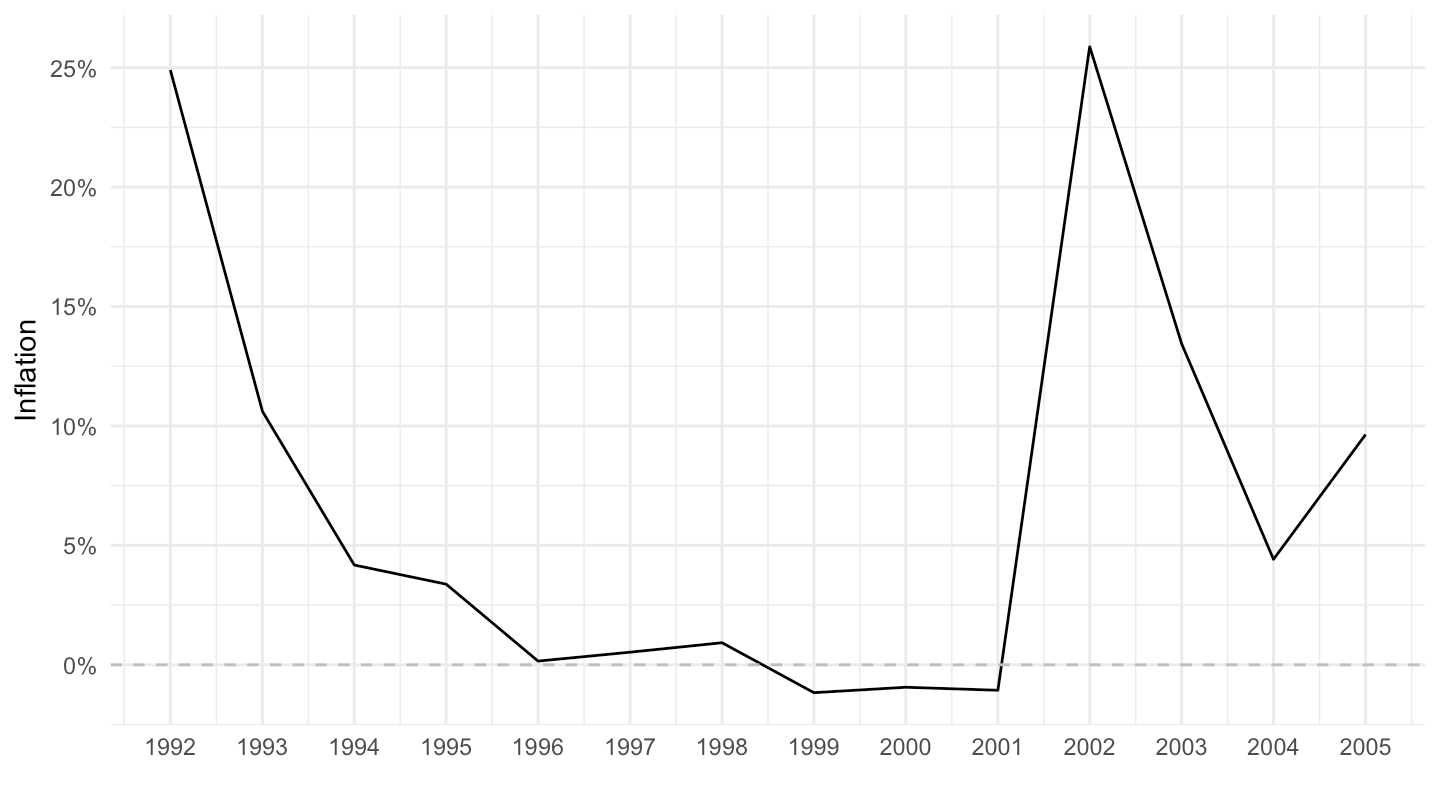
LONG_CPI |>
  filter(REF_AREA %in% c("JP"),
         UNIT_MEASURE == 771,
         FREQ == "A") |>
  year_to_date() |>
  filter(date >= as.Date("1952-01-01")) |>
  ggplot() + geom_line() + theme_minimal() +
  aes(x = date, y = OBS_VALUE/100) + xlab("") + ylab("Inflation") +
  scale_x_date(breaks = seq(1900, 2100, 5) |> paste0("-01-01") |> as.Date(),
               labels = date_format("%Y")) +
  scale_y_continuous(breaks = 0.01*seq(-10, 200, 2),
                     labels = percent_format(a = 1)) +
  geom_hline(yintercept = 0, linetype = "dashed", color = "grey")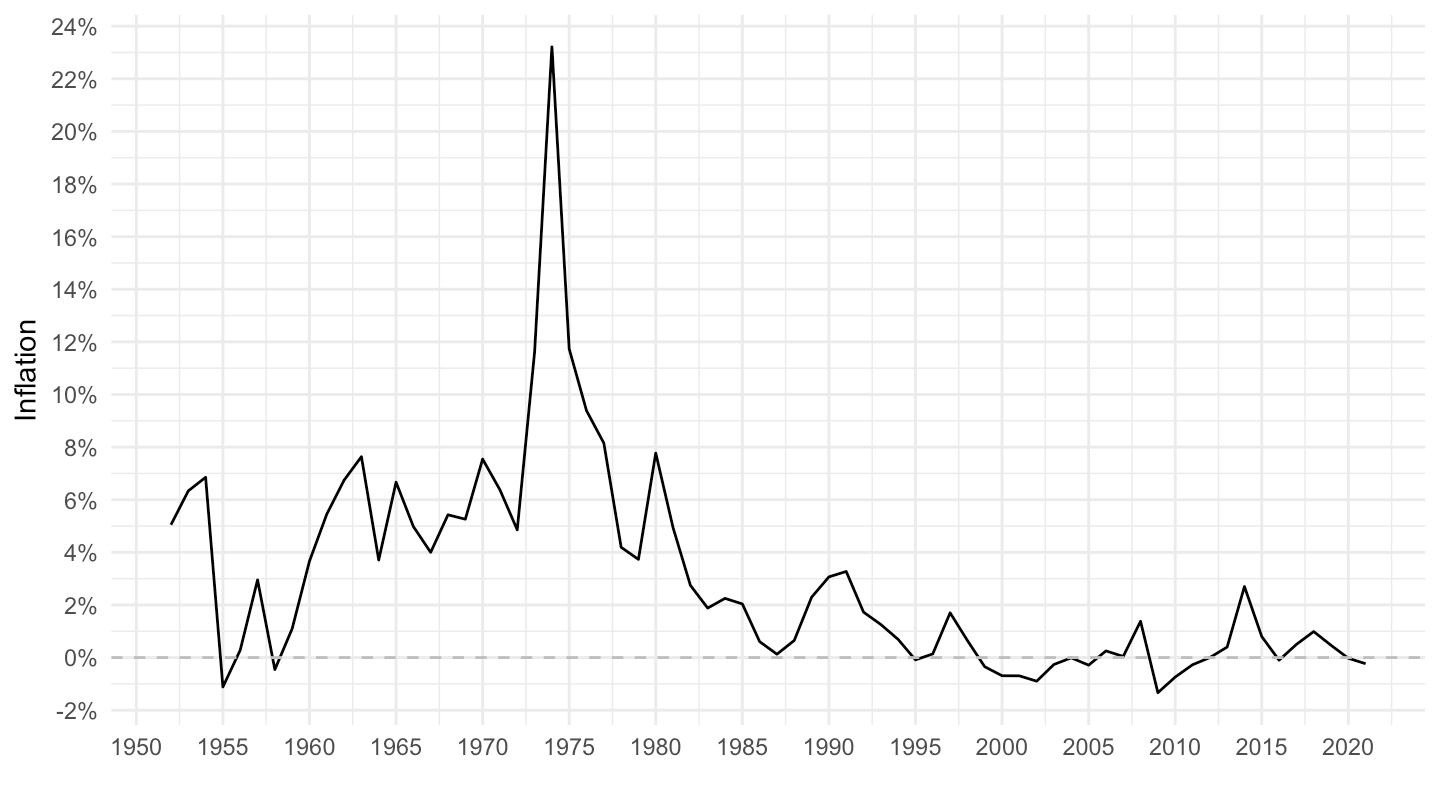
LONG_CPI |>
  filter(REF_AREA %in% c("JP"),
         UNIT_MEASURE == 771,
         FREQ == "A") |>
  year_to_date() |>
  filter(date >= as.Date("1952-01-01")) |>
  ggplot() + geom_line() + theme_minimal() +
  aes(x = date, y = OBS_VALUE/100) + xlab("") + ylab("Inflation") +
  scale_x_date(breaks = seq(1900, 2100, 5) |> paste0("-01-01") |> as.Date(),
               labels = date_format("%Y")) +
  scale_y_continuous(breaks = 0.01*seq(-10, 200, 1),
                     labels = percent_format(a = 1)) +
  geom_hline(yintercept = 0, linetype = "dashed", color = "grey")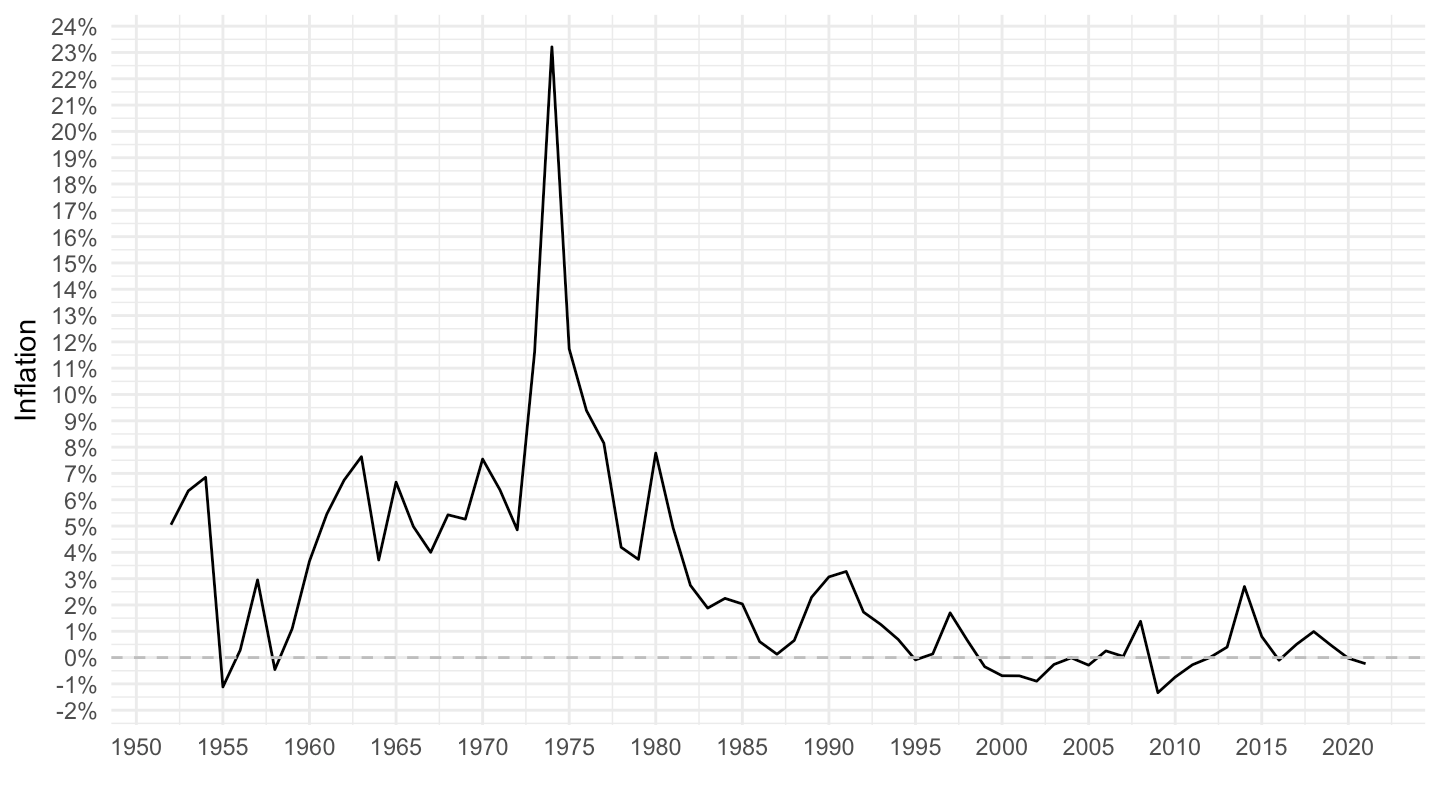
LONG_CPI |>
  filter(REF_AREA %in% c("JP"),
         UNIT_MEASURE == 771,
         FREQ == "A") |>
  year_to_date() |>
  filter(date >= as.Date("1980-01-01")) |>
  ggplot() + geom_line() + theme_minimal() +
  aes(x = date, y = OBS_VALUE/100) + xlab("") + ylab("Inflation") +
  scale_x_date(breaks = seq(1900, 2100, 2) |> paste0("-01-01") |> as.Date(),
               labels = date_format("%Y")) +
  scale_y_continuous(breaks = 0.01*seq(-10, 200, 1),
                     labels = percent_format(a = 1)) +
  geom_hline(yintercept = 0, linetype = "dashed", color = "grey")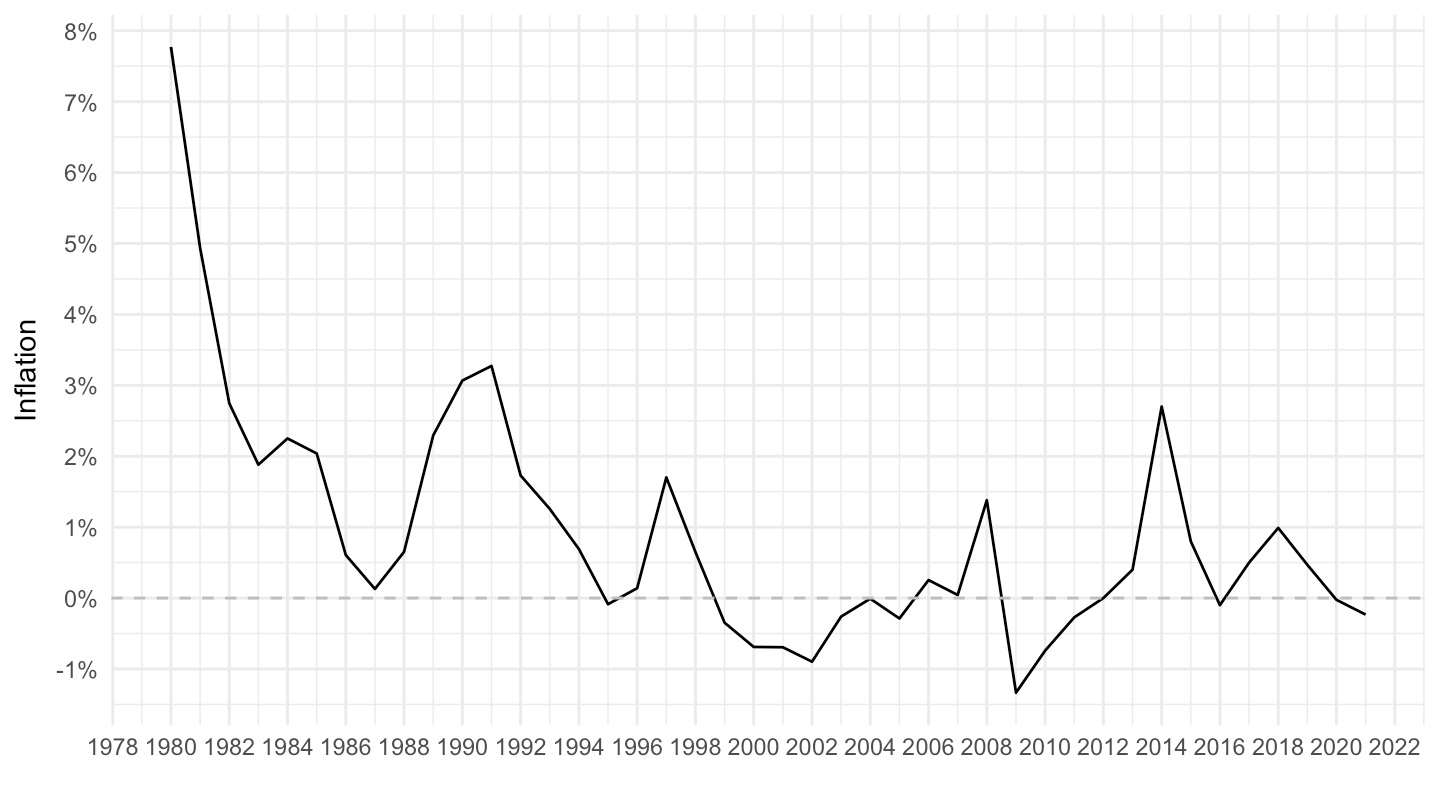
LONG_CPI |>
  filter(REF_AREA %in% c("JP"),
         UNIT_MEASURE == 771,
         FREQ == "A") |>
  year_to_date() |>
  filter(date >= as.Date("1986-01-01")) |>
  ggplot() + geom_line() + theme_minimal() +
  aes(x = date, y = OBS_VALUE/100) + xlab("") + ylab("Inflation") +
  scale_x_date(breaks = seq(1900, 2100, 2) |> paste0("-01-01") |> as.Date(),
               labels = date_format("%Y")) +
  scale_y_continuous(breaks = 0.01*seq(-10, 200, 1),
                     labels = percent_format(a = 1)) +
  geom_hline(yintercept = 0, linetype = "dashed", color = "grey")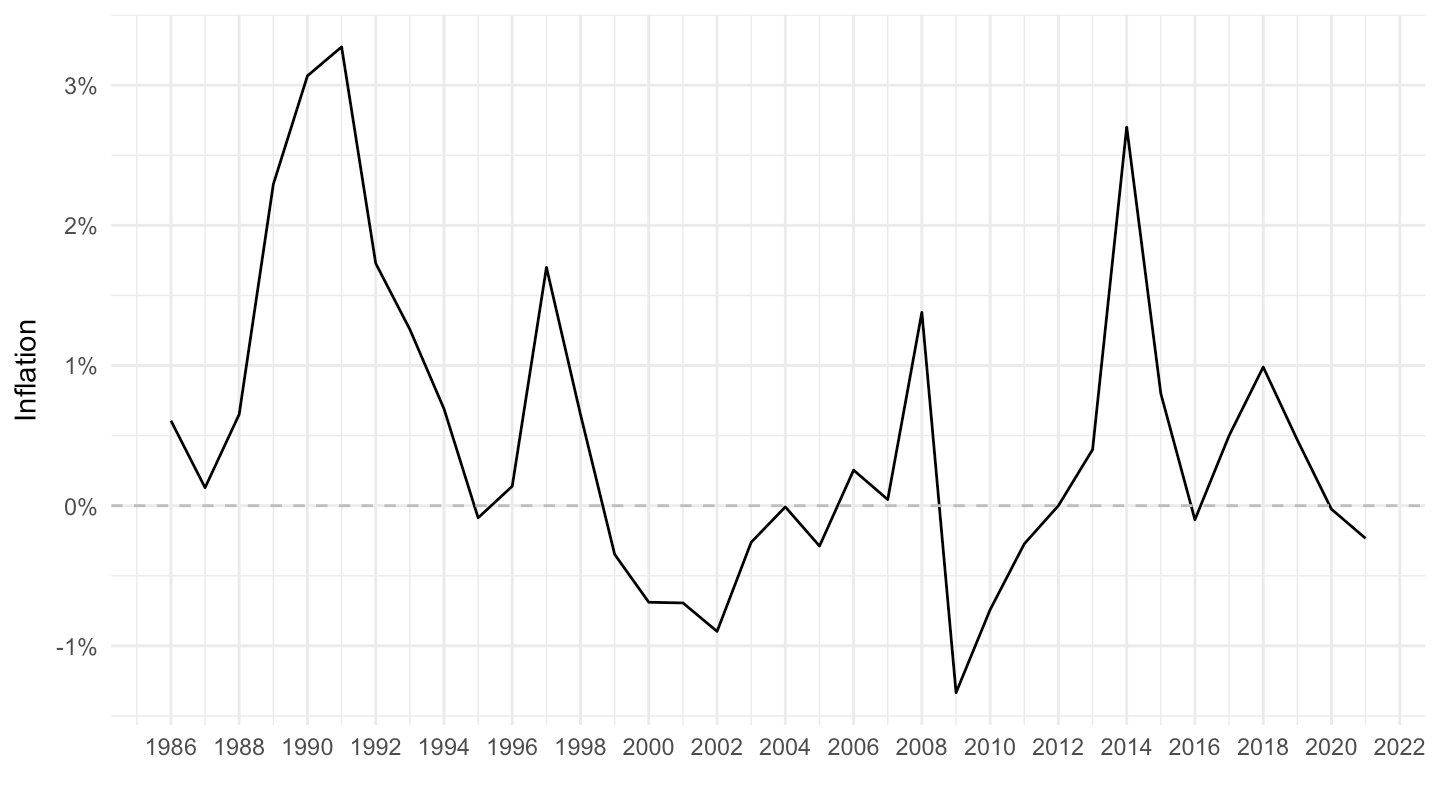
LONG_CPI |>
  filter(REF_AREA %in% c("IT"),
         UNIT_MEASURE == 771,
         FREQ == "A") |>
  year_to_date() |>
  ggplot() + geom_line() + theme_minimal() +
  aes(x = date, y = OBS_VALUE/100) + xlab("") + ylab("Inflation") +
  scale_x_date(breaks = seq(1800, 2100, 10) |> paste0("-01-01") |> as.Date(),
               labels = date_format("%Y")) +
  scale_y_continuous(breaks = 0.01*seq(-100, 200, 5),
                     labels = percent_format(a = 1)) +
  geom_hline(yintercept = 0, linetype = "dashed", color = "grey")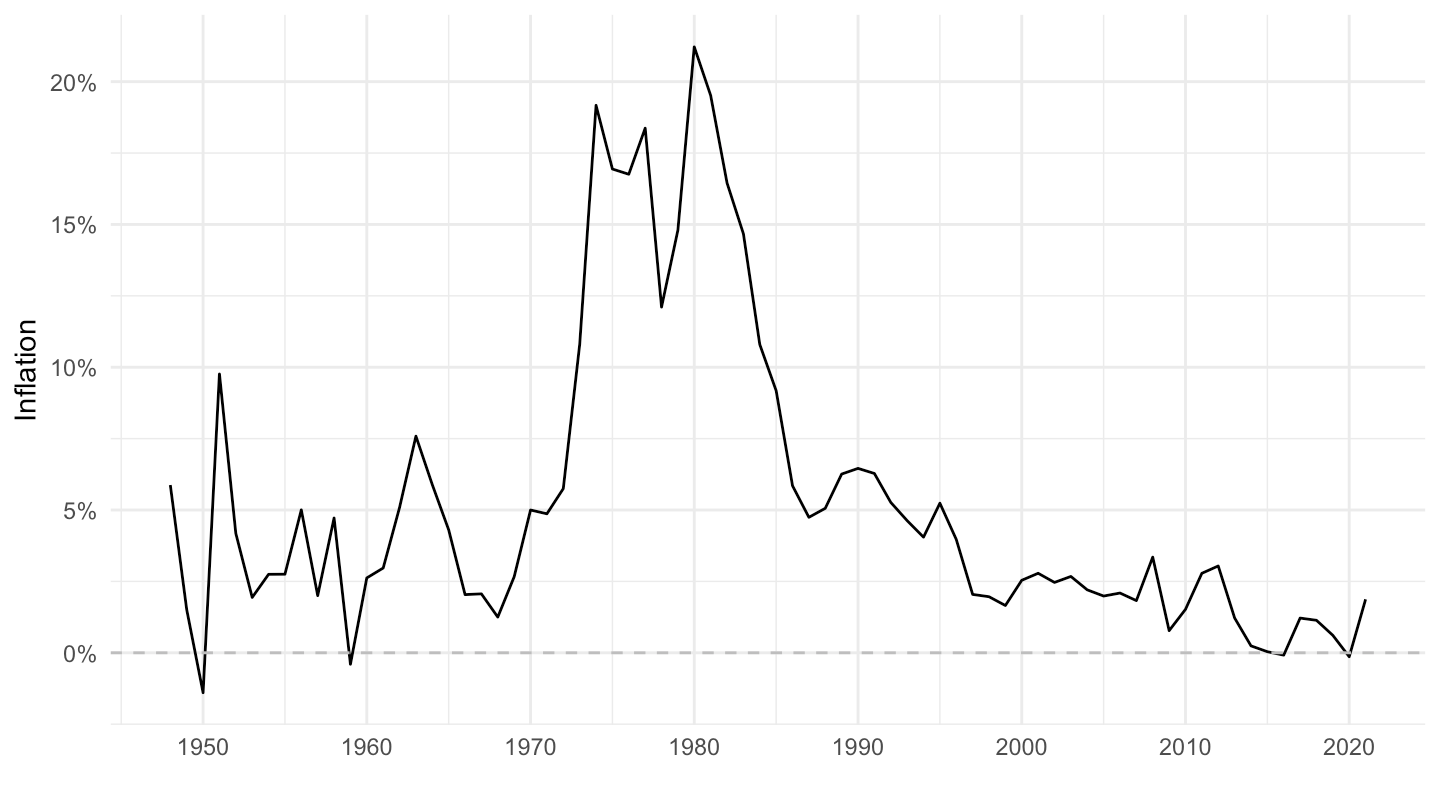
LONG_CPI |>
  filter(REF_AREA %in% c("IT"),
         UNIT_MEASURE == 771,
         FREQ == "A") |>
  year_to_date() |>
  filter(date >= as.Date("1952-01-01")) |>
  ggplot() + geom_line() + theme_minimal() +
  aes(x = date, y = OBS_VALUE/100) + xlab("") + ylab("Inflation") +
  scale_x_date(breaks = seq(1900, 2100, 5) |> paste0("-01-01") |> as.Date(),
               labels = date_format("%Y")) +
  scale_y_continuous(breaks = 0.01*seq(-10, 200, 2),
                     labels = percent_format(a = 1)) +
  geom_hline(yintercept = 0, linetype = "dashed", color = "grey")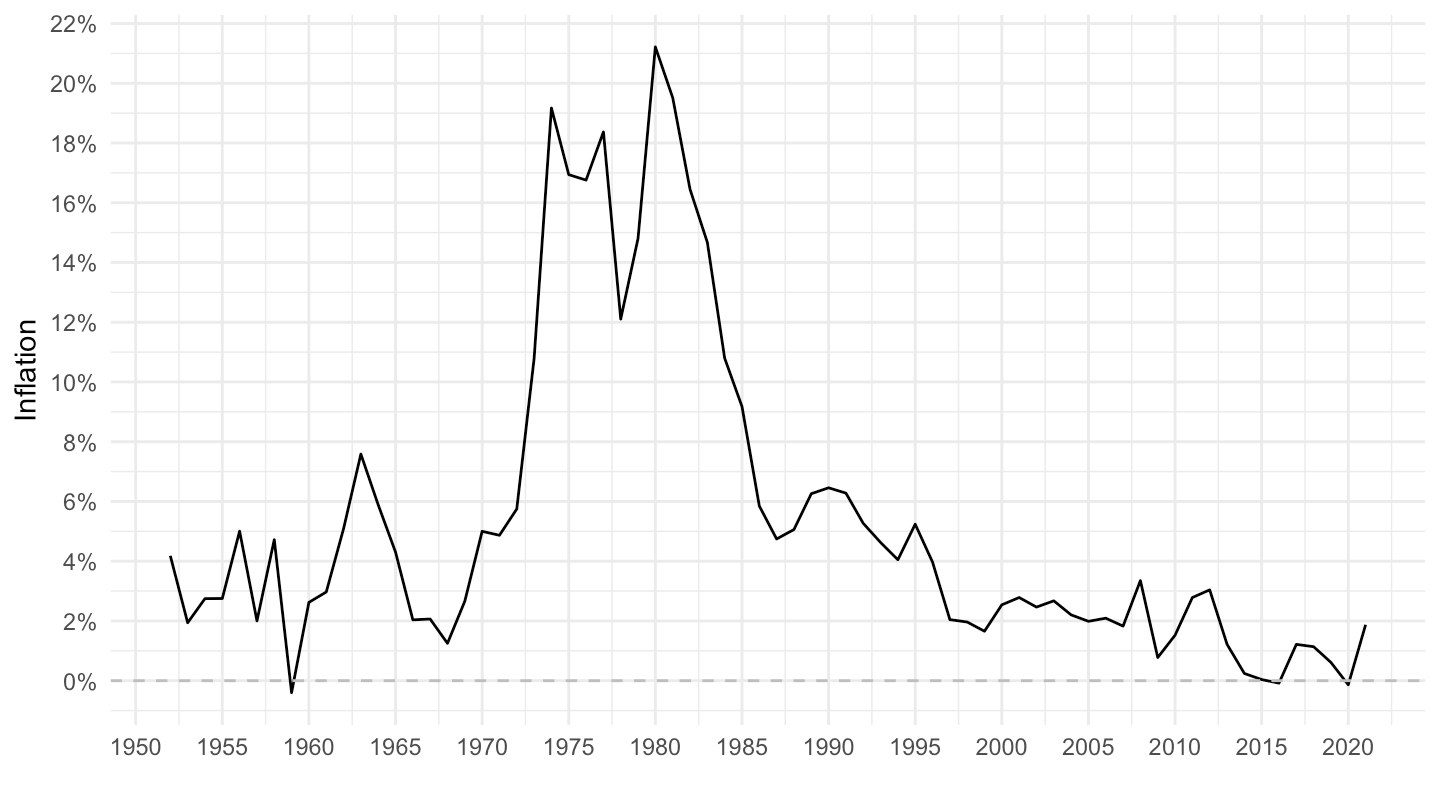
LONG_CPI |>
  filter(REF_AREA %in% c("DE"),
         UNIT_MEASURE == 771,
         FREQ == "A") |>
  year_to_date() |>
  ggplot() + geom_line() + theme_minimal() +
  aes(x = date, y = OBS_VALUE/100) + xlab("") + ylab("Inflation") +
  scale_x_date(breaks = seq(1800, 2100, 10) |> paste0("-01-01") |> as.Date(),
               labels = date_format("%Y")) +
  scale_y_continuous(breaks = 0.01*seq(-100, 200, 5),
                     labels = percent_format(a = 1)) +
  geom_hline(yintercept = 0, linetype = "dashed", color = "grey")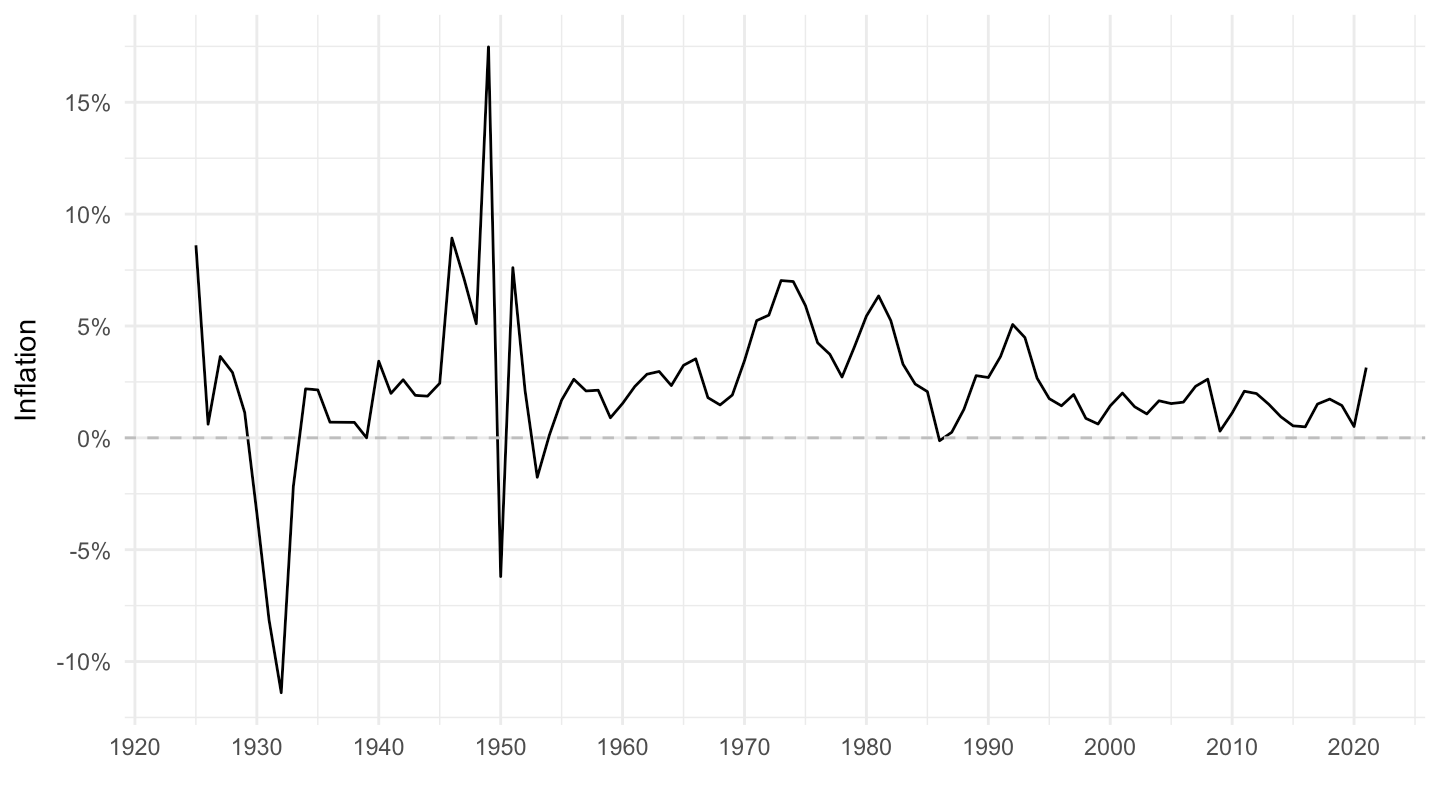
LONG_CPI |>
  filter(REF_AREA %in% c("DE"),
         UNIT_MEASURE == 771,
         FREQ == "A") |>
  year_to_date() |>
  filter(date >= as.Date("1952-01-01") & date <= as.Date("1972-01-01")) |>
  ggplot() + geom_line() + theme_minimal() +
  aes(x = date, y = OBS_VALUE/100) + xlab("") + ylab("Inflation") +
  scale_x_date(breaks = seq(1800, 2100, 2) |> paste0("-01-01") |> as.Date(),
               labels = date_format("%Y")) +
  scale_y_continuous(breaks = 0.01*seq(-100, 200, 1),
                     labels = percent_format(a = 1)) +
  geom_hline(yintercept = 0, linetype = "dashed", color = "grey")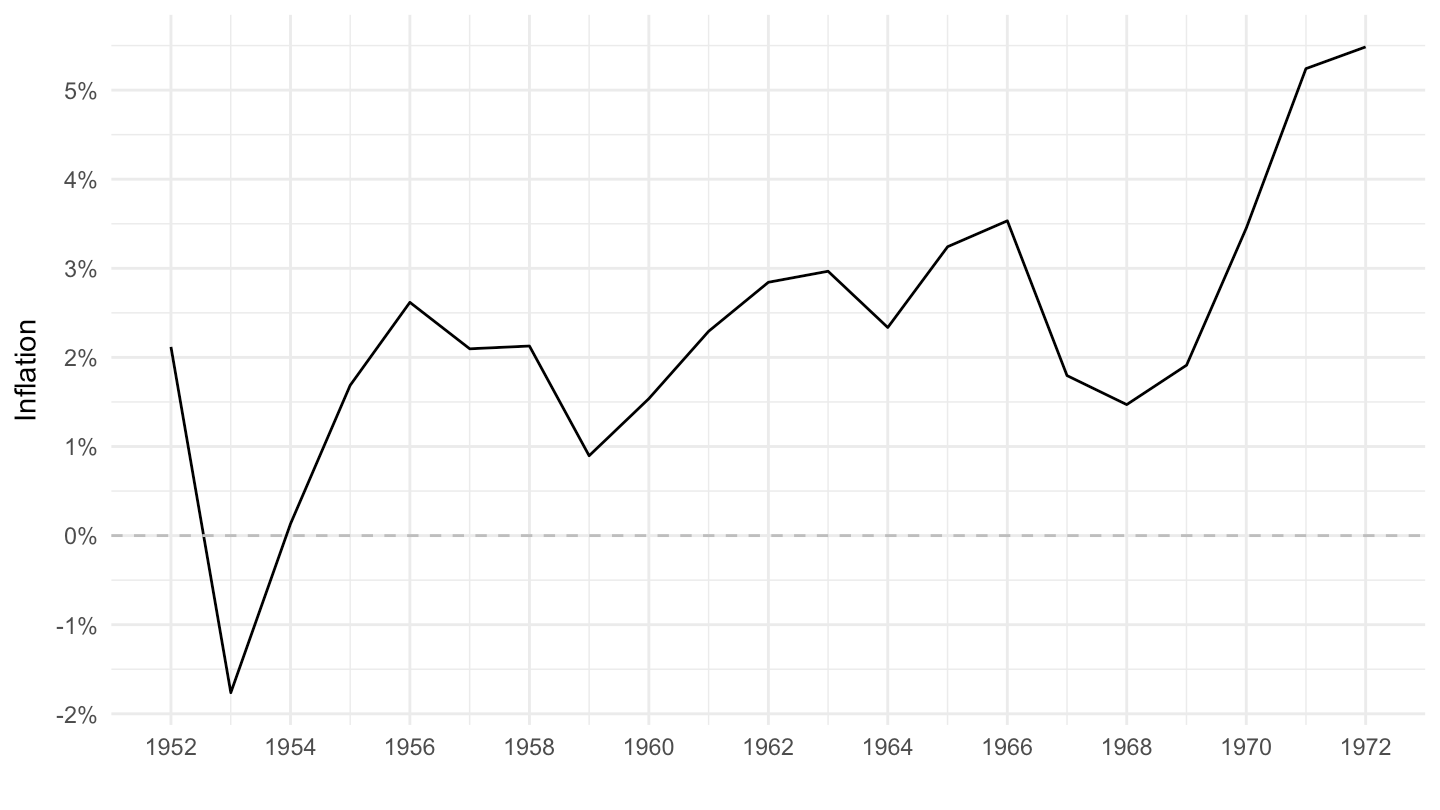
LONG_CPI |>
  filter(REF_AREA %in% c("DE"),
         UNIT_MEASURE == 771,
         FREQ == "A") |>
  year_to_date() |>
  filter(date >= as.Date("1952-01-01") & date <= as.Date("1990-01-01")) |>
  ggplot() + geom_line() + theme_minimal() +
  aes(x = date, y = OBS_VALUE/100) + xlab("") + ylab("Inflation") +
  scale_x_date(breaks = seq(1800, 2100, 5) |> paste0("-01-01") |> as.Date(),
               labels = date_format("%Y")) +
  scale_y_continuous(breaks = 0.01*seq(-100, 200, 1),
                     labels = percent_format(a = 1)) +
  geom_hline(yintercept = 0, linetype = "dashed", color = "grey")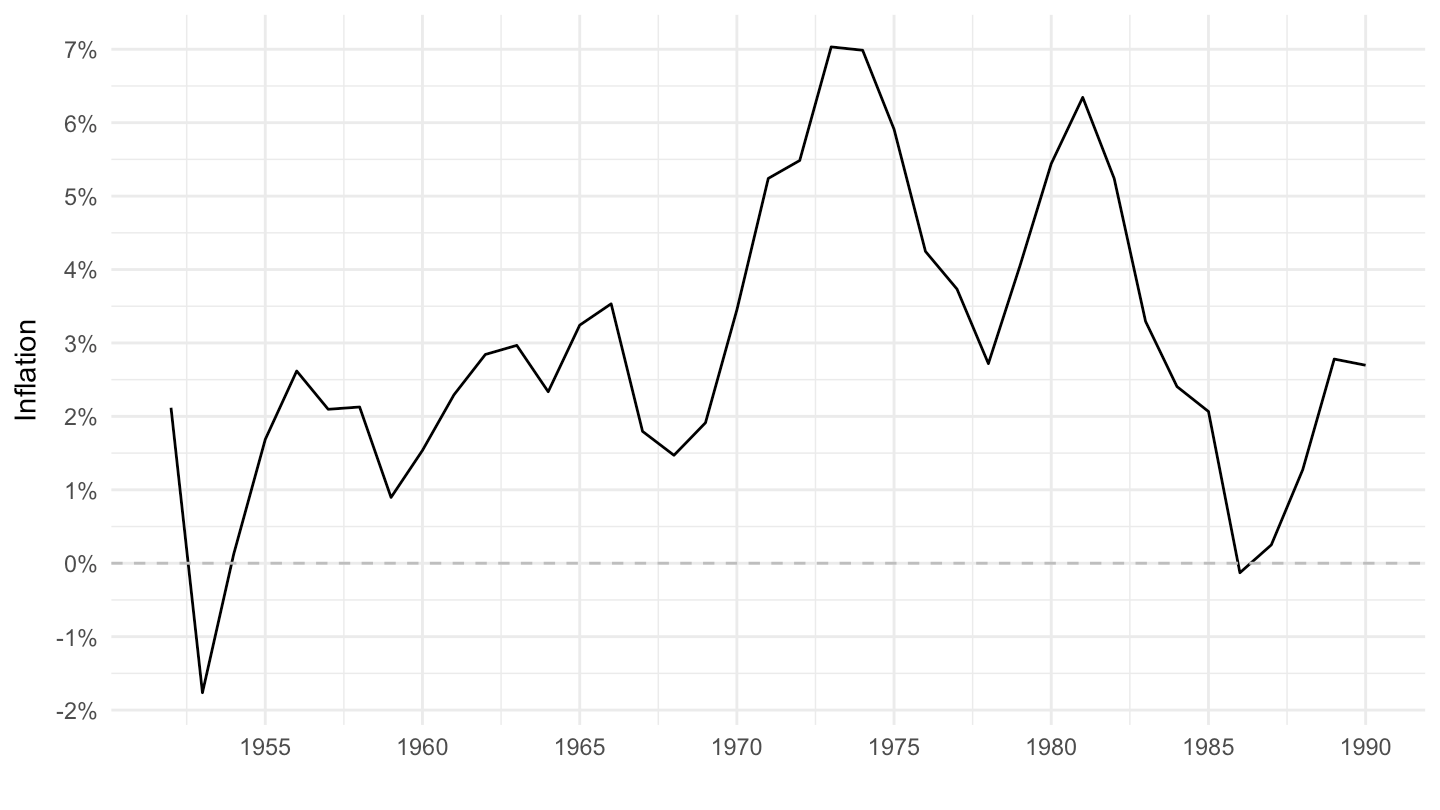
LONG_CPI |>
  filter(REF_AREA %in% c("DE"),
         UNIT_MEASURE == 771,
         FREQ == "A") |>
  year_to_date() |>
  filter(date >= as.Date("1952-01-01")) |>
  ggplot() + geom_line() + theme_minimal() +
  aes(x = date, y = OBS_VALUE/100) + xlab("") + ylab("Inflation") +
  scale_x_date(breaks = seq(1900, 2100, 5) |> paste0("-01-01") |> as.Date(),
               labels = date_format("%Y")) +
  scale_y_continuous(breaks = 0.01*seq(-10, 200, 2),
                     labels = percent_format(a = 1)) +
  geom_hline(yintercept = 0, linetype = "dashed", color = "grey")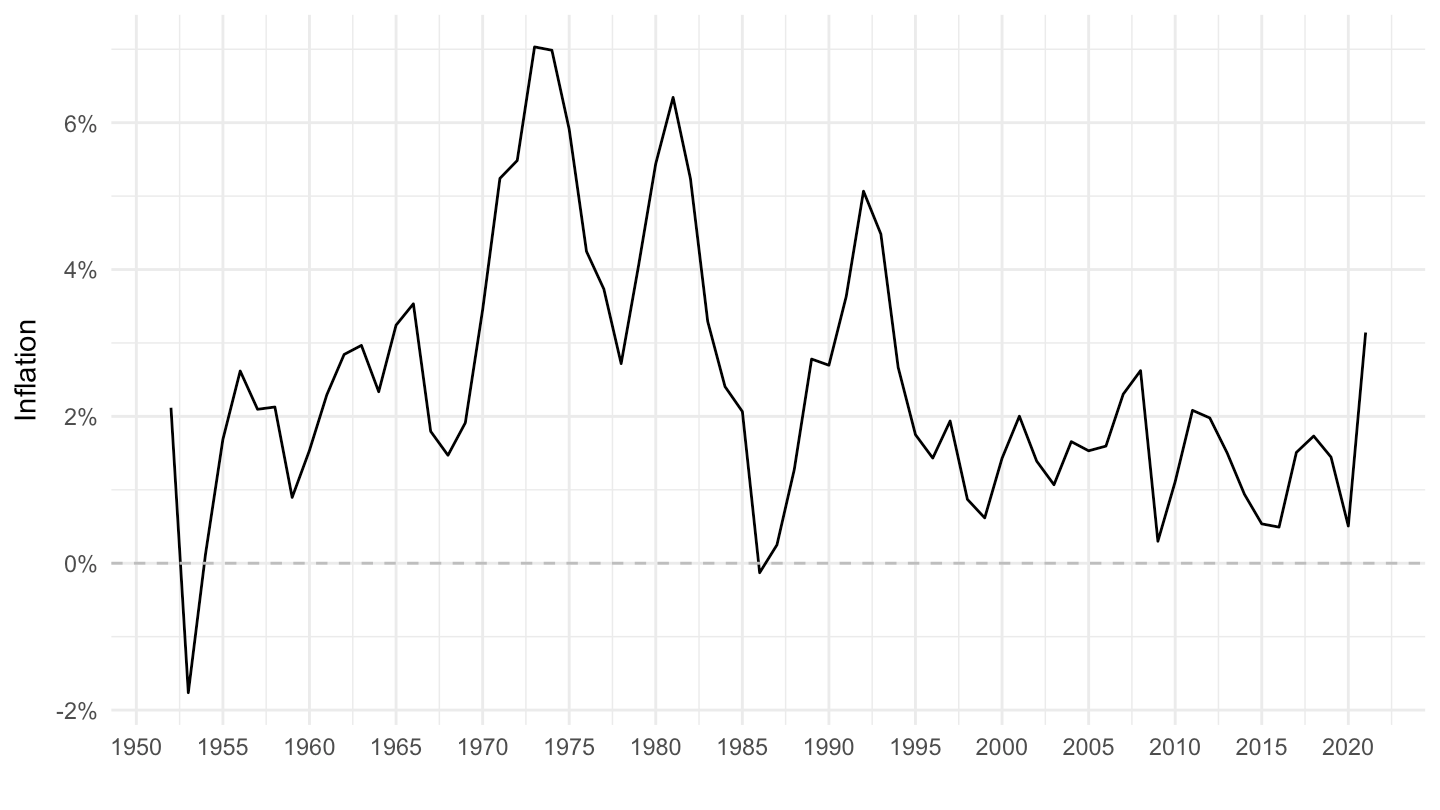
LONG_CPI |>
  filter(REF_AREA %in% c("AT"),
         UNIT_MEASURE == 771,
         FREQ == "A") |>
  year_to_date() |>
  ggplot() + geom_line() + theme_minimal() +
  aes(x = date, y = OBS_VALUE/100) + xlab("") + ylab("Inflation") +
  scale_x_date(breaks = seq(1800, 2100, 10) |> paste0("-01-01") |> as.Date(),
               labels = date_format("%Y")) +
  scale_y_continuous(breaks = 0.01*seq(-100, 200, 5),
                     labels = percent_format(a = 1)) +
  geom_hline(yintercept = 0, linetype = "dashed", color = "grey")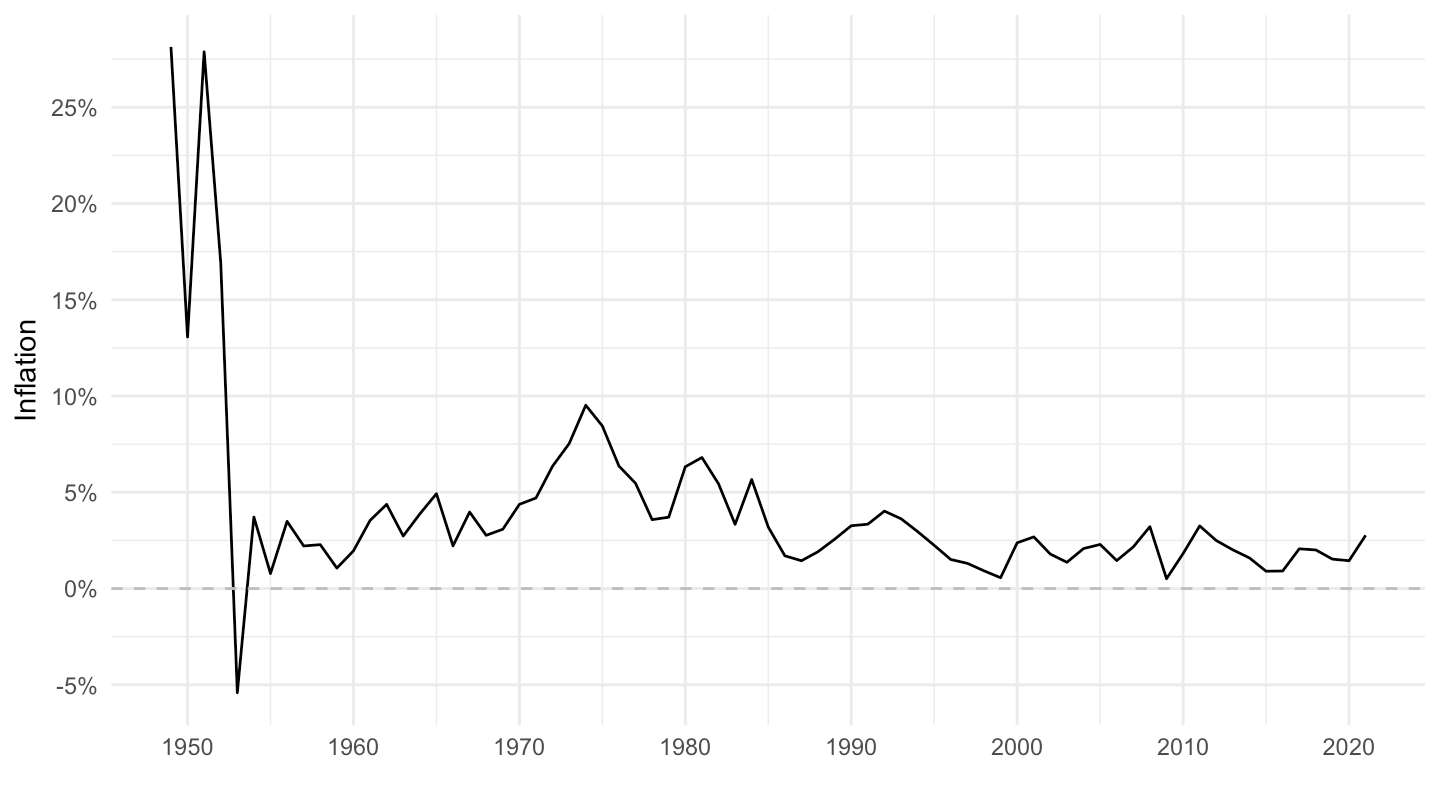
LONG_CPI |>
  filter(REF_AREA %in% c("AT"),
         UNIT_MEASURE == 771,
         FREQ == "A") |>
  year_to_date() |>
  filter(date >= as.Date("1952-01-01")) |>
  ggplot() + geom_line() + theme_minimal() +
  aes(x = date, y = OBS_VALUE/100) + xlab("") + ylab("Inflation") +
  scale_x_date(breaks = seq(1900, 2100, 5) |> paste0("-01-01") |> as.Date(),
               labels = date_format("%Y")) +
  scale_y_continuous(breaks = 0.01*seq(-10, 200, 2),
                     labels = percent_format(a = 1)) +
  geom_hline(yintercept = 0, linetype = "dashed", color = "grey")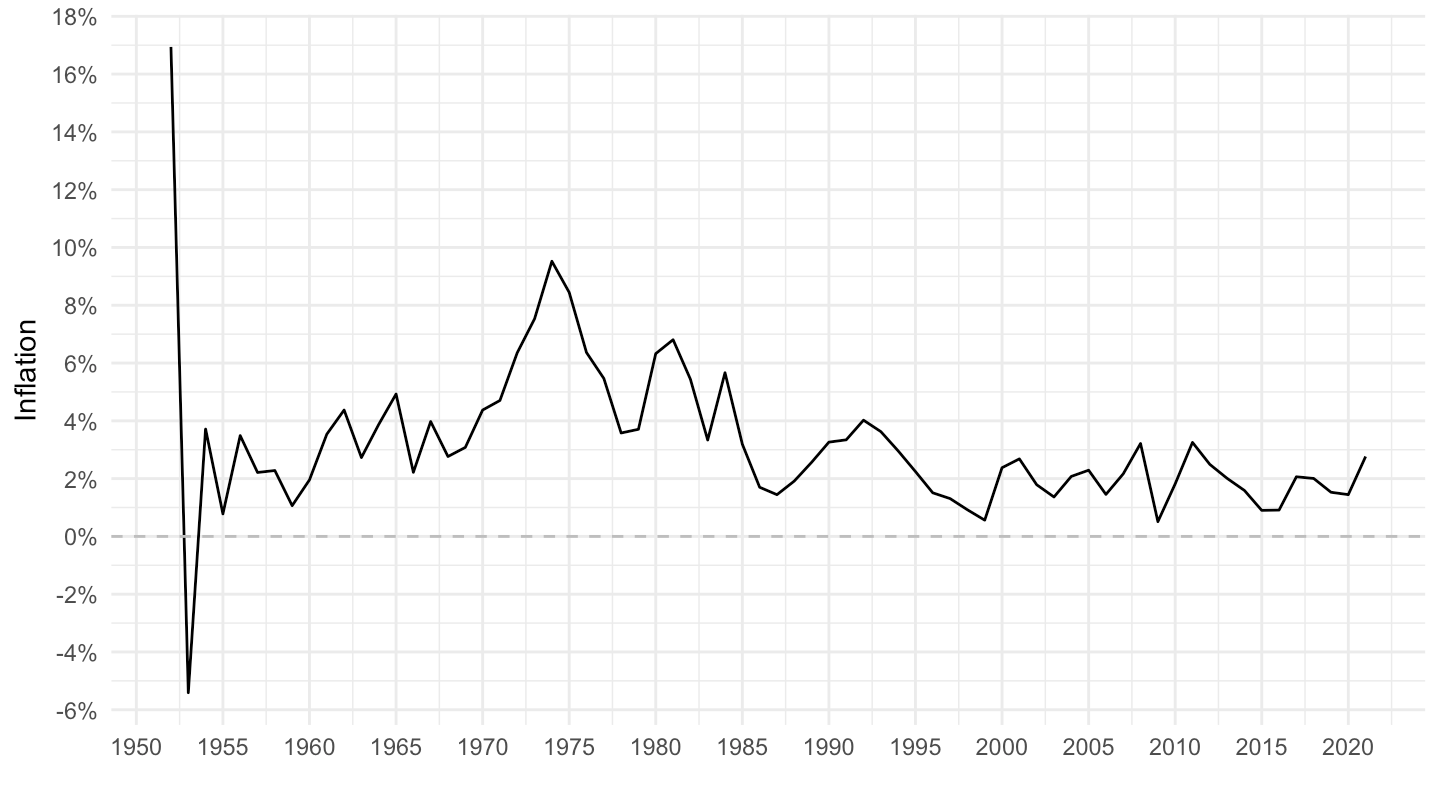
LONG_CPI |>
  filter(REF_AREA %in% c("LU"),
         UNIT_MEASURE == 771,
         FREQ == "A") |>
  year_to_date() |>
  ggplot() + geom_line() + theme_minimal() +
  aes(x = date, y = OBS_VALUE/100) + xlab("") + ylab("Inflation") +
  scale_x_date(breaks = seq(1800, 2100, 10) |> paste0("-01-01") |> as.Date(),
               labels = date_format("%Y")) +
  scale_y_continuous(breaks = 0.01*seq(-100, 200, 2),
                     labels = percent_format(a = 1)) +
  geom_hline(yintercept = 0, linetype = "dashed", color = "grey")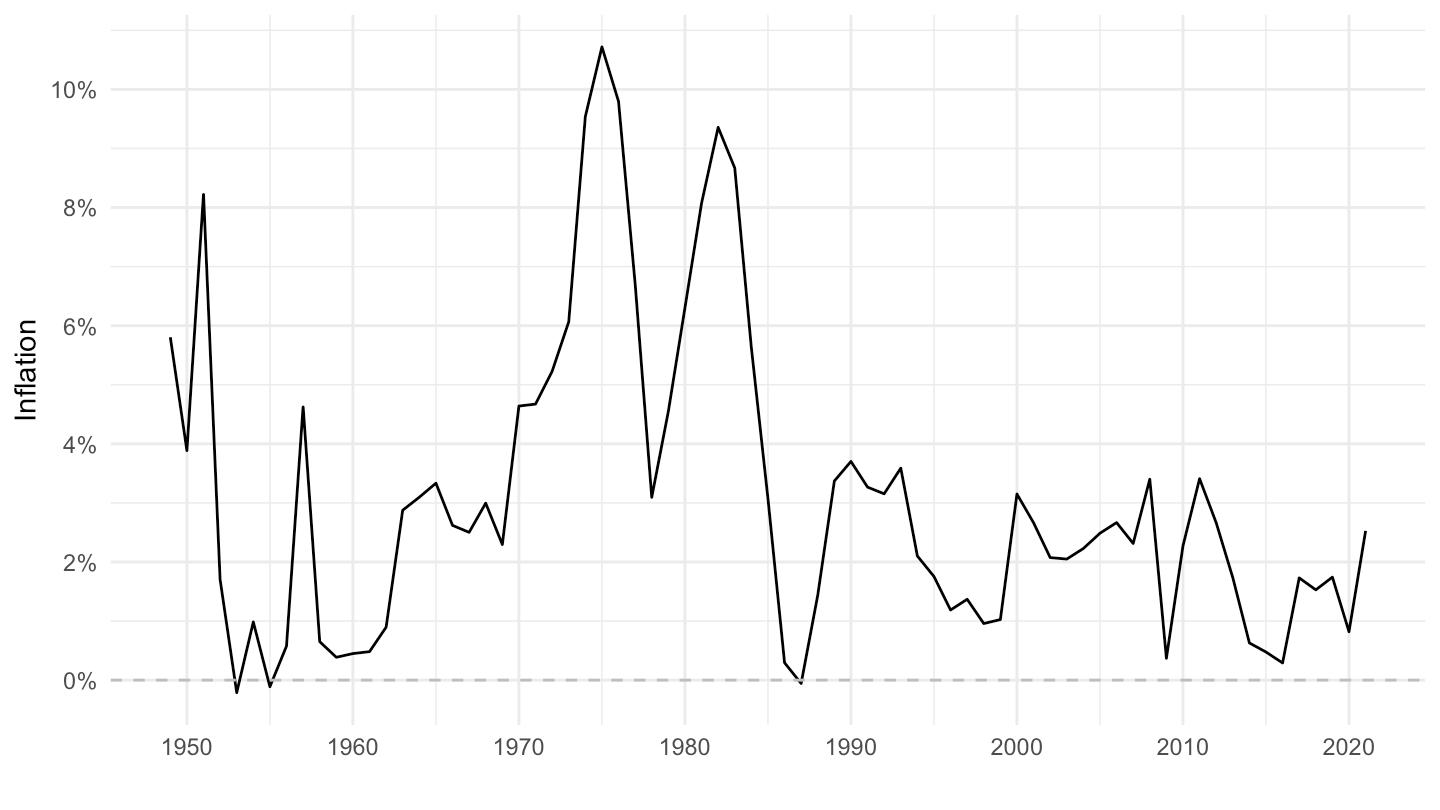
LONG_CPI |>
  filter(REF_AREA %in% c("LU"),
         UNIT_MEASURE == 771,
         FREQ == "A") |>
  year_to_date() |>
  filter(date >= as.Date("1952-01-01")) |>
  ggplot() + geom_line() + theme_minimal() +
  aes(x = date, y = OBS_VALUE/100) + xlab("") + ylab("Inflation") +
  scale_x_date(breaks = seq(1900, 2100, 5) |> paste0("-01-01") |> as.Date(),
               labels = date_format("%Y")) +
  scale_y_continuous(breaks = 0.01*seq(-10, 200, 2),
                     labels = percent_format(a = 1)) +
  geom_hline(yintercept = 0, linetype = "dashed", color = "grey")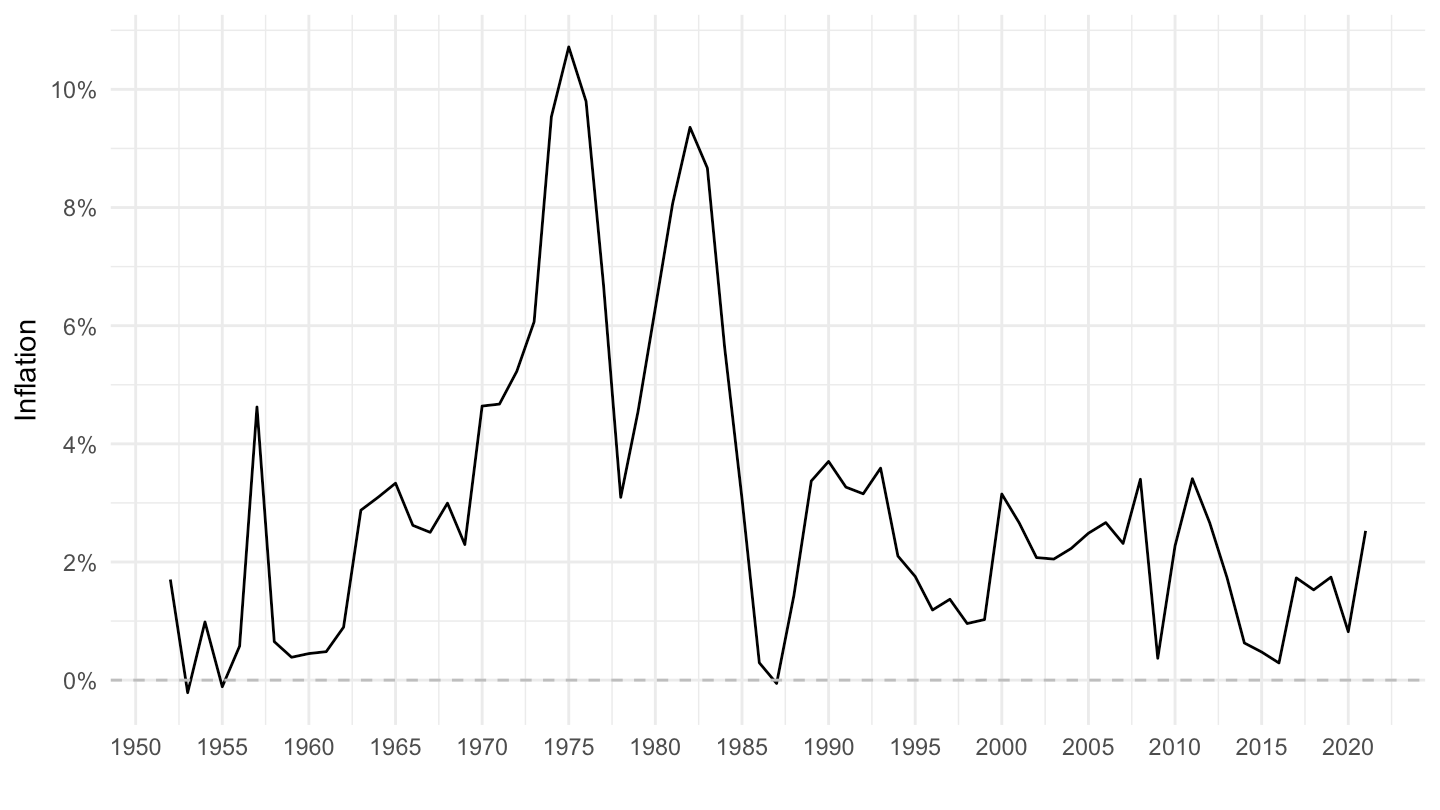
LONG_CPI |>
  filter(REF_AREA %in% c("PT"),
         UNIT_MEASURE == 771,
         FREQ == "A") |>
  year_to_date() |>
  ggplot() + geom_line() + theme_minimal() +
  aes(x = date, y = OBS_VALUE/100) + xlab("") + ylab("Inflation") +
  scale_x_date(breaks = seq(1900, 2100, 5) |> paste0("-01-01") |> as.Date(),
               labels = date_format("%Y")) +
  scale_y_continuous(breaks = 0.01*seq(-10, 200, 2),
                     labels = percent_format(a = 1)) +
  geom_hline(yintercept = 0, linetype = "dashed", color = "grey")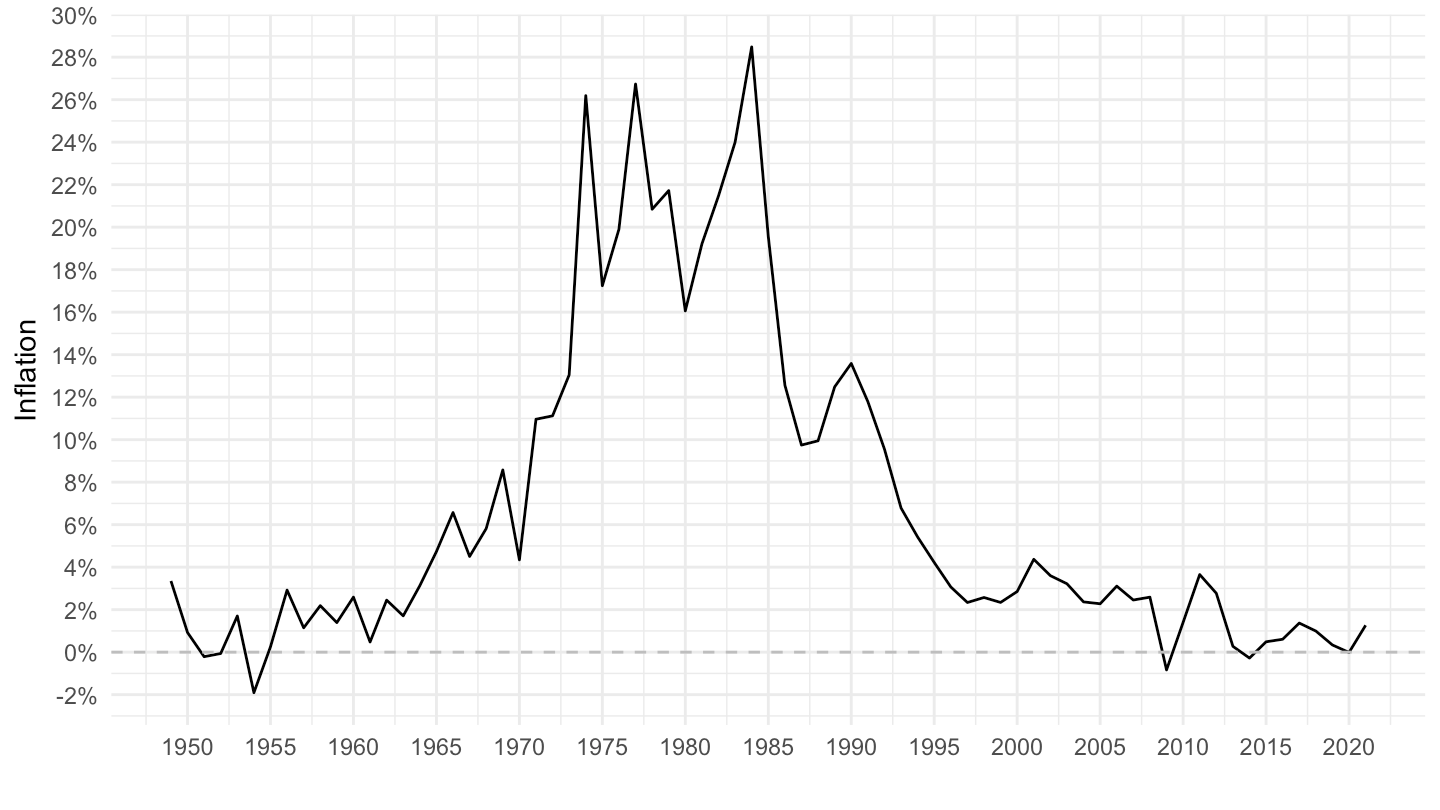
LONG_CPI |>
  filter(REF_AREA %in% c("PE"),
         UNIT_MEASURE == 771,
         FREQ == "A") |>
  year_to_date() |>
  ggplot() + geom_line() + theme_minimal() +
  aes(x = date, y = OBS_VALUE/100) + xlab("") + ylab("Inflation") +
  scale_x_date(breaks = seq(1900, 2100, 5) |> paste0("-01-01") |> as.Date(),
               labels = date_format("%Y")) +
  scale_y_continuous(breaks = 0.01*seq(-1000, 10000, 1000),
                     labels = percent_format(a = 1)) +
  geom_hline(yintercept = 0, linetype = "dashed", color = "grey")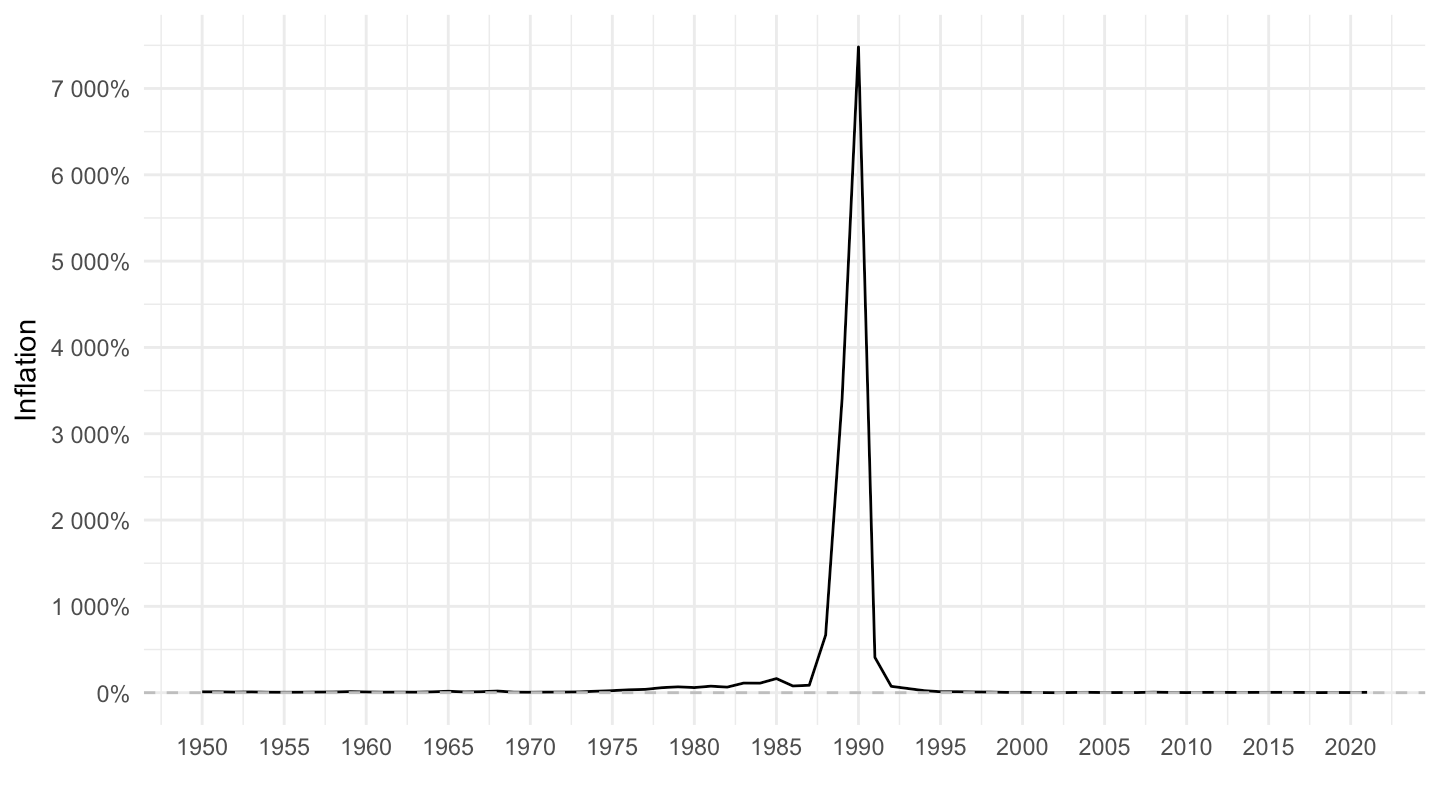
LONG_CPI |>
  filter(REF_AREA %in% c("HK"),
         UNIT_MEASURE == 771,
         FREQ == "A") |>
  year_to_date() |>
  ggplot() + geom_line() + theme_minimal() +
  aes(x = date, y = OBS_VALUE/100) + xlab("") + ylab("Inflation") +
  scale_x_date(breaks = seq(1900, 2100, 5) |> paste0("-01-01") |> as.Date(),
               labels = date_format("%Y")) +
  scale_y_continuous(breaks = 0.01*seq(-10, 200, 2),
                     labels = percent_format(a = 1)) +
  geom_hline(yintercept = 0, linetype = "dashed", color = "grey")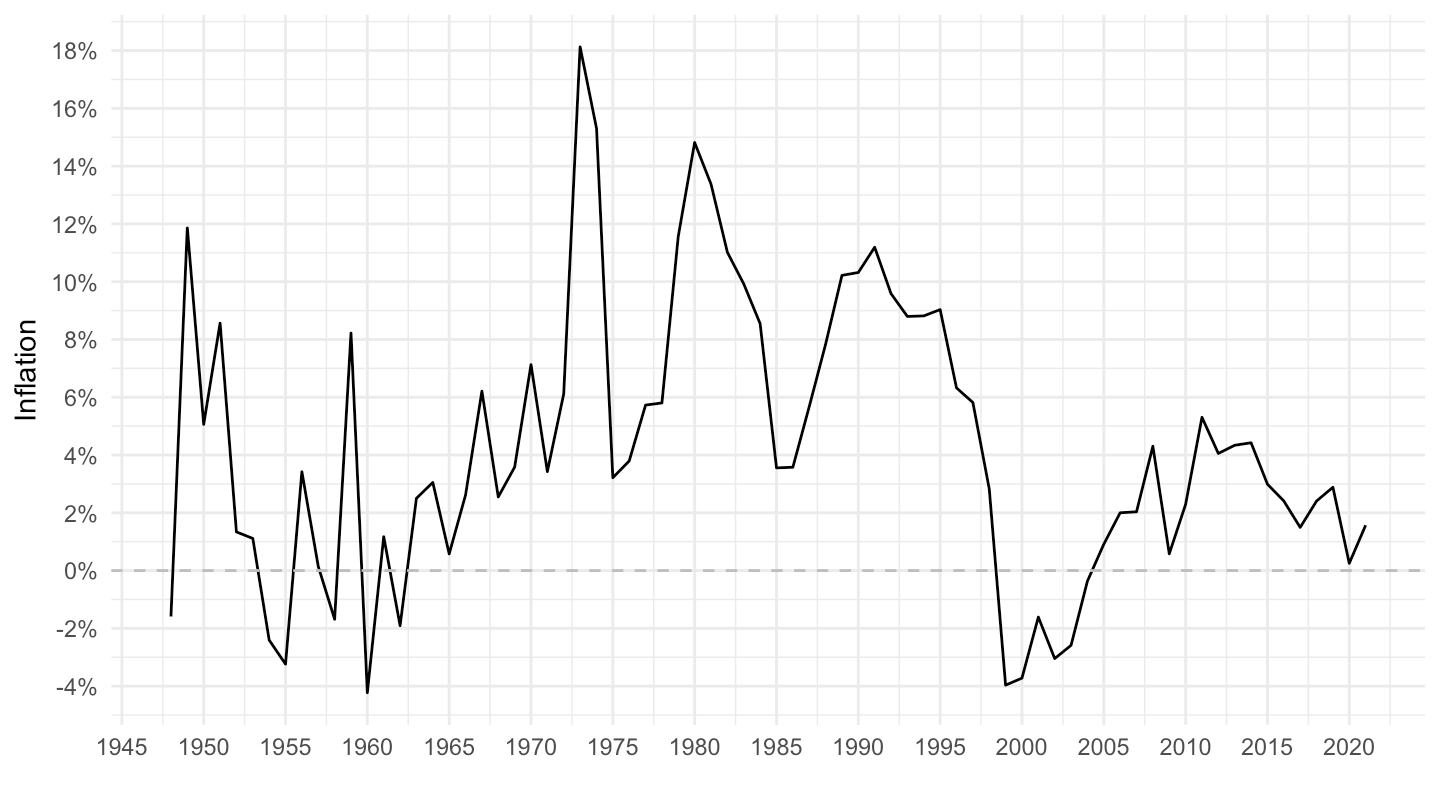
LONG_CPI |>
  filter(REF_AREA %in% c("FR"),
         UNIT_MEASURE == 771,
         FREQ == "A") |>
  year_to_date() |>
  ggplot() + geom_line() + theme_minimal() +
  aes(x = date, y = OBS_VALUE/100) + xlab("") + ylab("Inflation") +
  scale_x_date(breaks = seq(1900, 2100, 5) |> paste0("-01-01") |> as.Date(),
               labels = date_format("%Y")) +
  scale_y_continuous(breaks = 0.01*seq(-10, 200, 1),
                     labels = percent_format(a = 1)) +
  geom_hline(yintercept = 0, linetype = "dashed", color = "grey")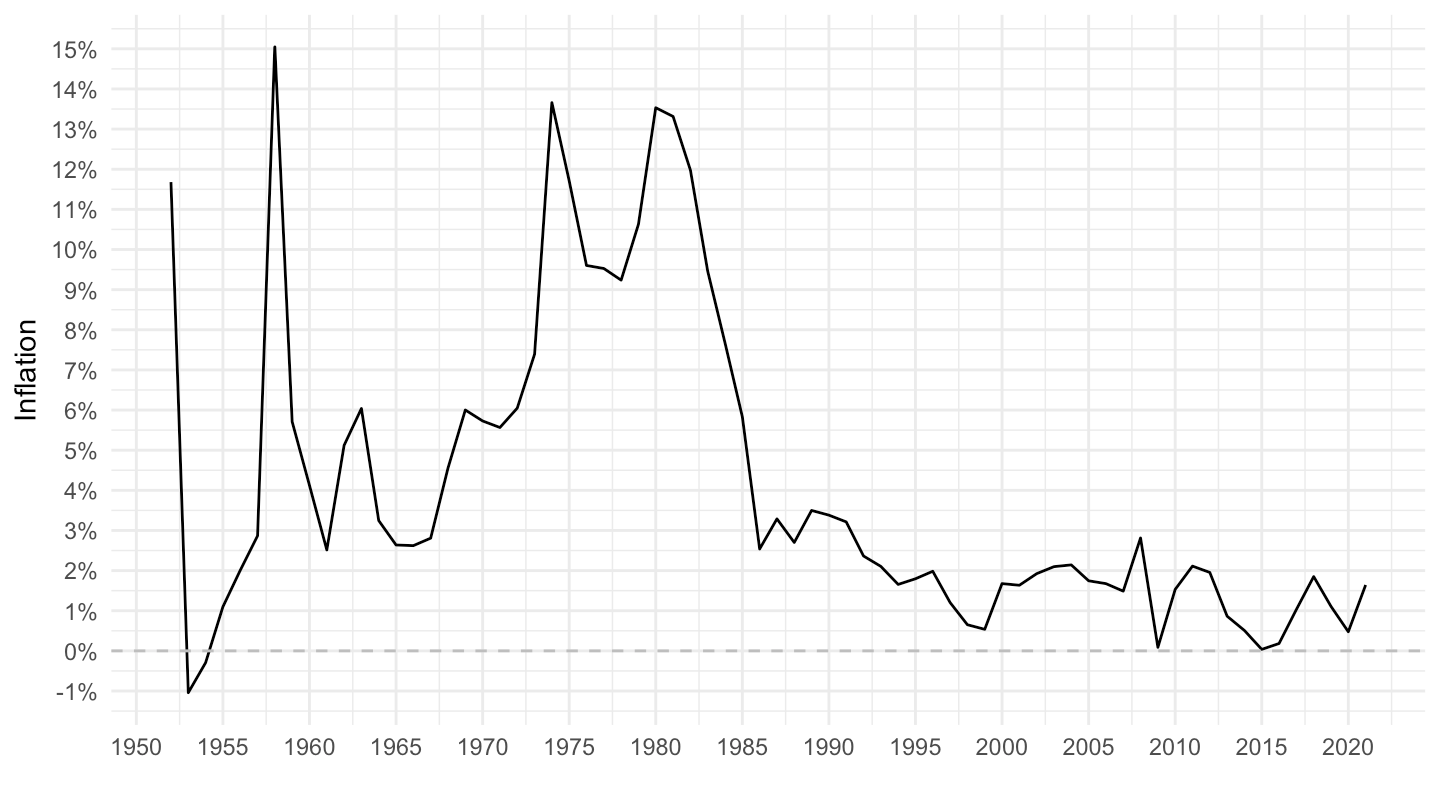
LONG_CPI |>
  filter(REF_AREA %in% c("IL"),
         UNIT_MEASURE == 771,
         FREQ == "A") |>
  year_to_date() |>
  ggplot() + geom_line() + theme_minimal() +
  aes(x = date, y = OBS_VALUE/100) + xlab("") + ylab("Inflation") +
  scale_x_date(breaks = seq(1900, 2100, 5) |> paste0("-01-01") |> as.Date(),
               labels = date_format("%Y")) +
  scale_y_continuous(breaks = 0.01*seq(-20, 700, 20),
                     labels = percent_format(a = 1)) +
  geom_hline(yintercept = 0, linetype = "dashed", color = "grey")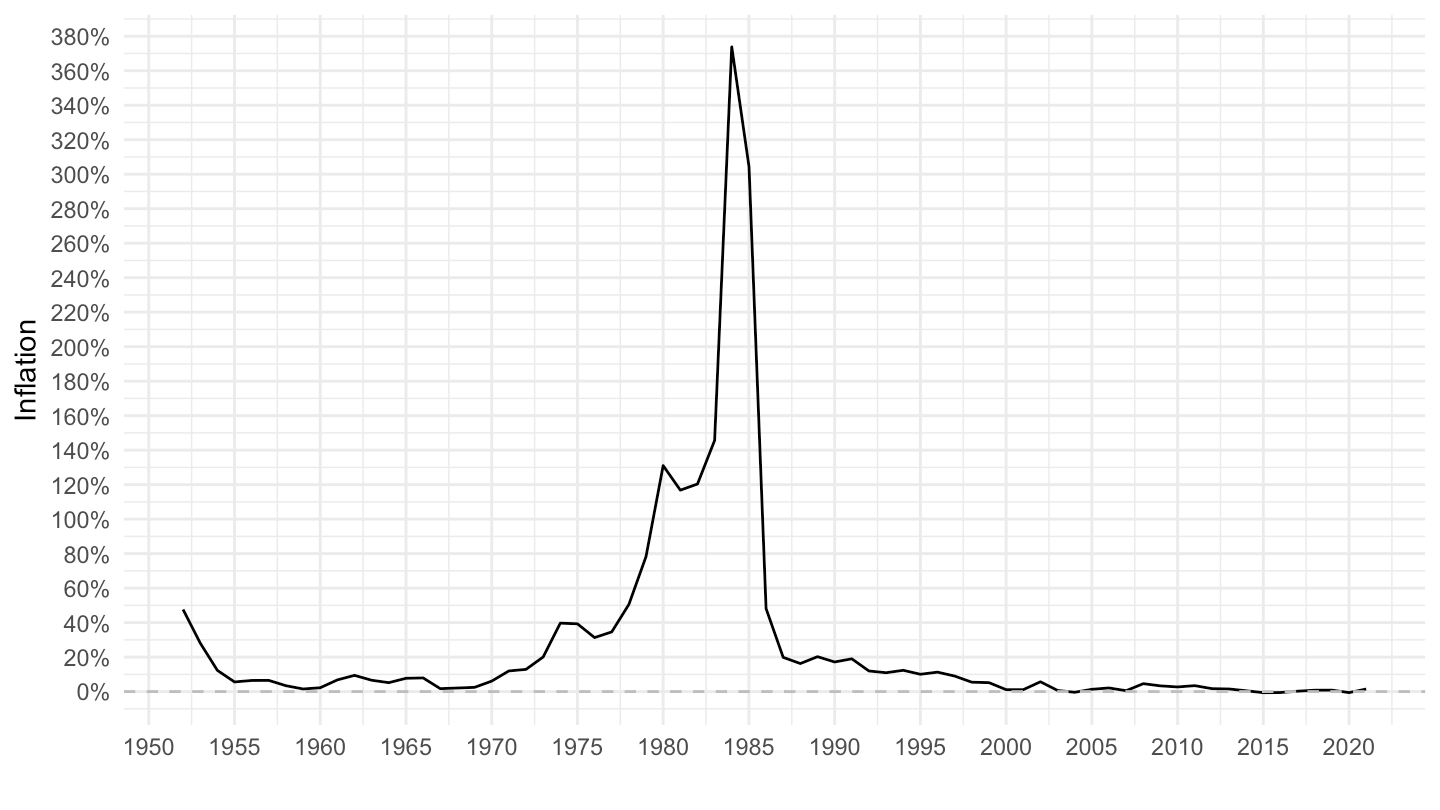
LONG_CPI |>
  filter(REF_AREA %in% c("FI"),
         UNIT_MEASURE == 771,
         FREQ == "A") |>
  year_to_date() |>
  ggplot() + geom_line() + theme_minimal() +
  aes(x = date, y = OBS_VALUE/100) + xlab("") + ylab("Inflation") +
  scale_x_date(breaks = seq(1900, 2100, 5) |> paste0("-01-01") |> as.Date(),
               labels = date_format("%Y")) +
  scale_y_continuous(breaks = 0.01*seq(-20, 700, 2),
                     labels = percent_format(a = 1)) +
  geom_hline(yintercept = 0, linetype = "dashed", color = "grey")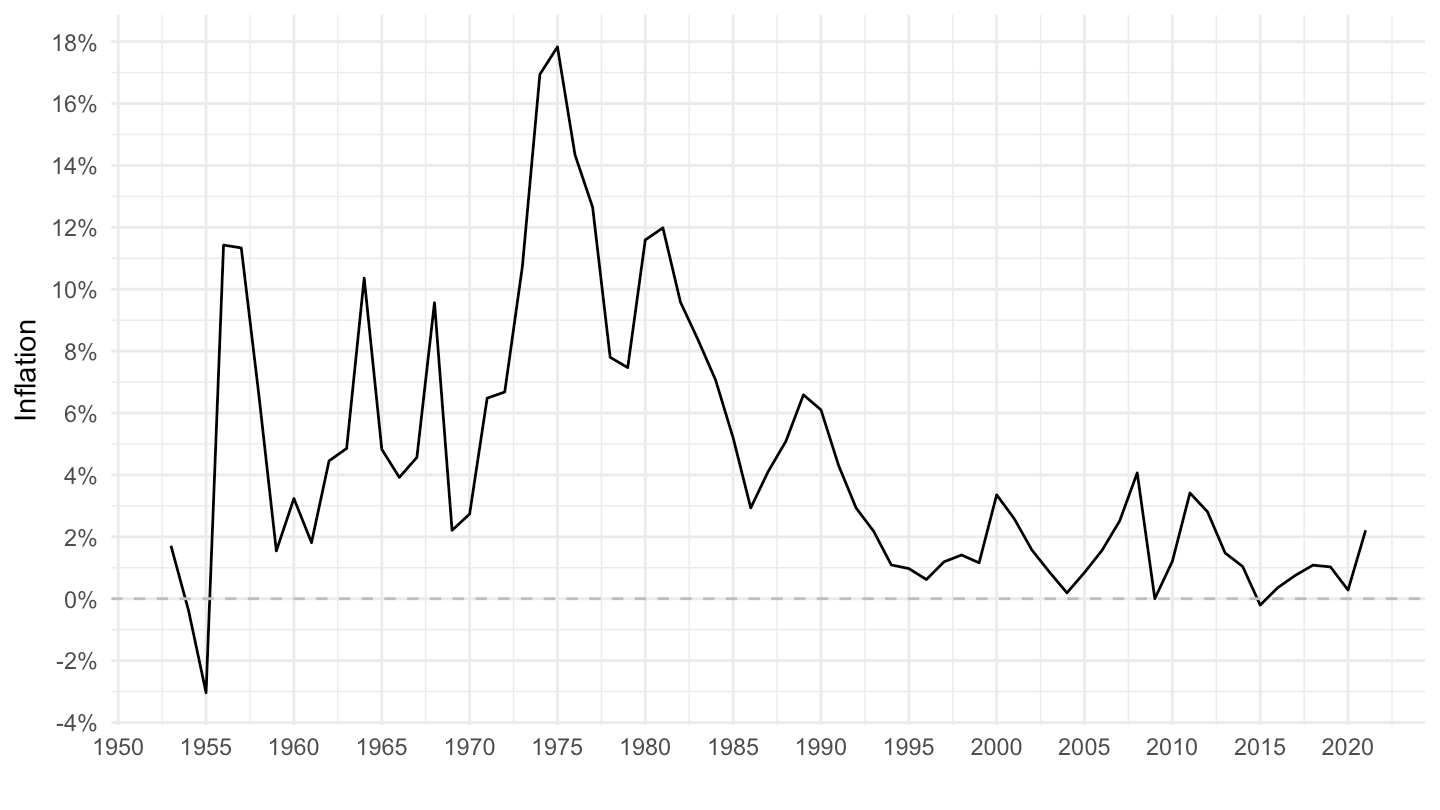
LONG_CPI |>
  filter(REF_AREA %in% c("IN"),
         UNIT_MEASURE == 771,
         FREQ == "A") |>
  year_to_date() |>
  ggplot() + geom_line() + theme_minimal() +
  aes(x = date, y = OBS_VALUE/100) + xlab("") + ylab("Inflation") +
  scale_x_date(breaks = seq(1900, 2100, 5) |> paste0("-01-01") |> as.Date(),
               labels = date_format("%Y")) +
  scale_y_continuous(breaks = 0.01*seq(-20, 700, 2),
                     labels = percent_format(a = 1)) +
  geom_hline(yintercept = 0, linetype = "dashed", color = "grey")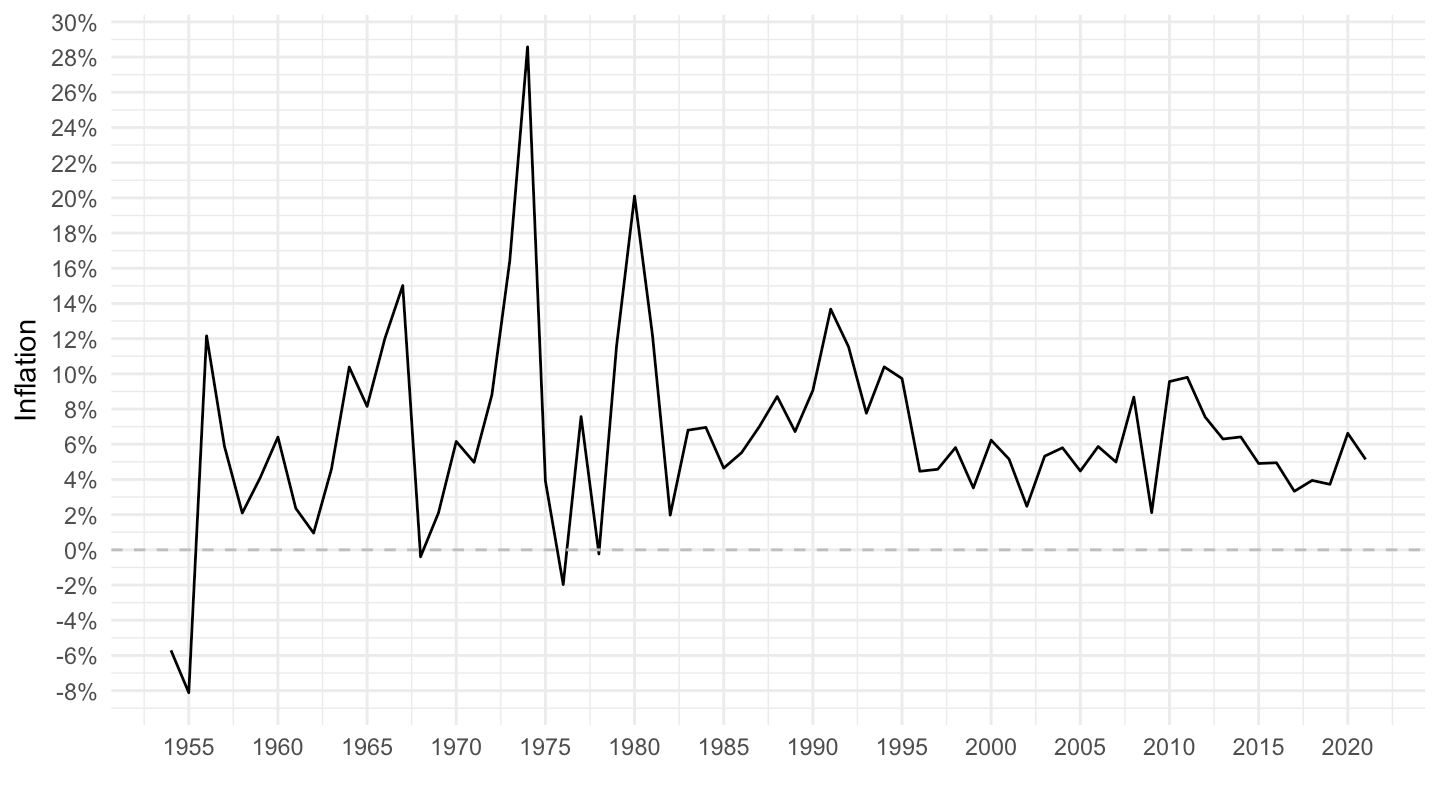
LONG_CPI |>
  filter(REF_AREA %in% c("ES"),
         UNIT_MEASURE == 771,
         FREQ == "A") |>
  year_to_date() |>
  ggplot() + geom_line() + theme_minimal() +
  aes(x = date, y = OBS_VALUE/100) + xlab("") + ylab("Inflation") +
  scale_x_date(breaks = seq(1900, 2100, 5) |> paste0("-01-01") |> as.Date(),
               labels = date_format("%Y")) +
  scale_y_continuous(breaks = 0.01*seq(-20, 700, 2),
                     labels = percent_format(a = 1)) +
  geom_hline(yintercept = 0, linetype = "dashed", color = "grey")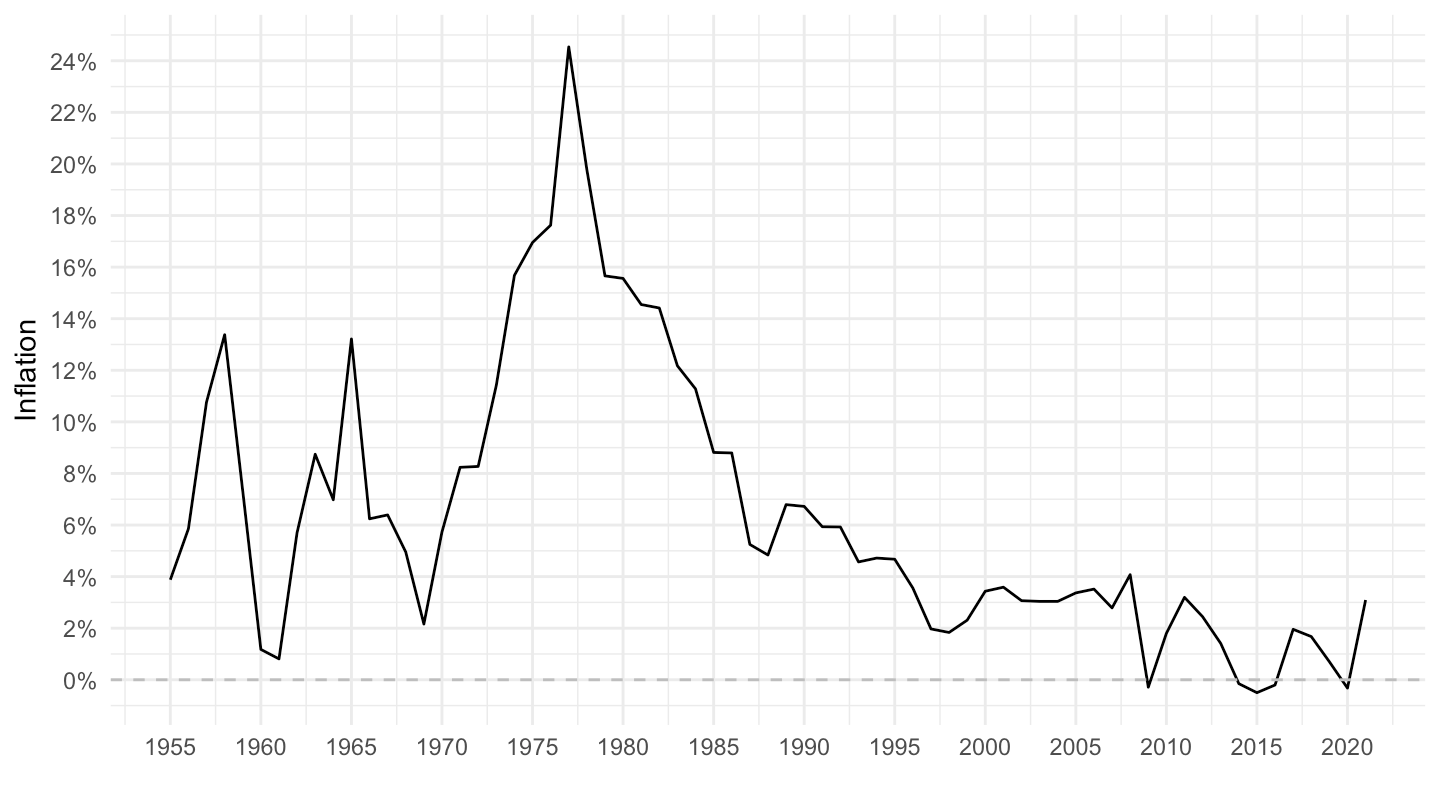
LONG_CPI |>
  filter(REF_AREA %in% c("PH"),
         UNIT_MEASURE == 771,
         FREQ == "A") |>
  year_to_date() |>
  ggplot() + geom_line() + theme_minimal() +
  aes(x = date, y = OBS_VALUE/100) + xlab("") + ylab("Inflation") +
  scale_x_date(breaks = seq(1900, 2100, 5) |> paste0("-01-01") |> as.Date(),
               labels = date_format("%Y")) +
  scale_y_continuous(breaks = 0.01*seq(-20, 700, 2),
                     labels = percent_format(a = 1)) +
  geom_hline(yintercept = 0, linetype = "dashed", color = "grey")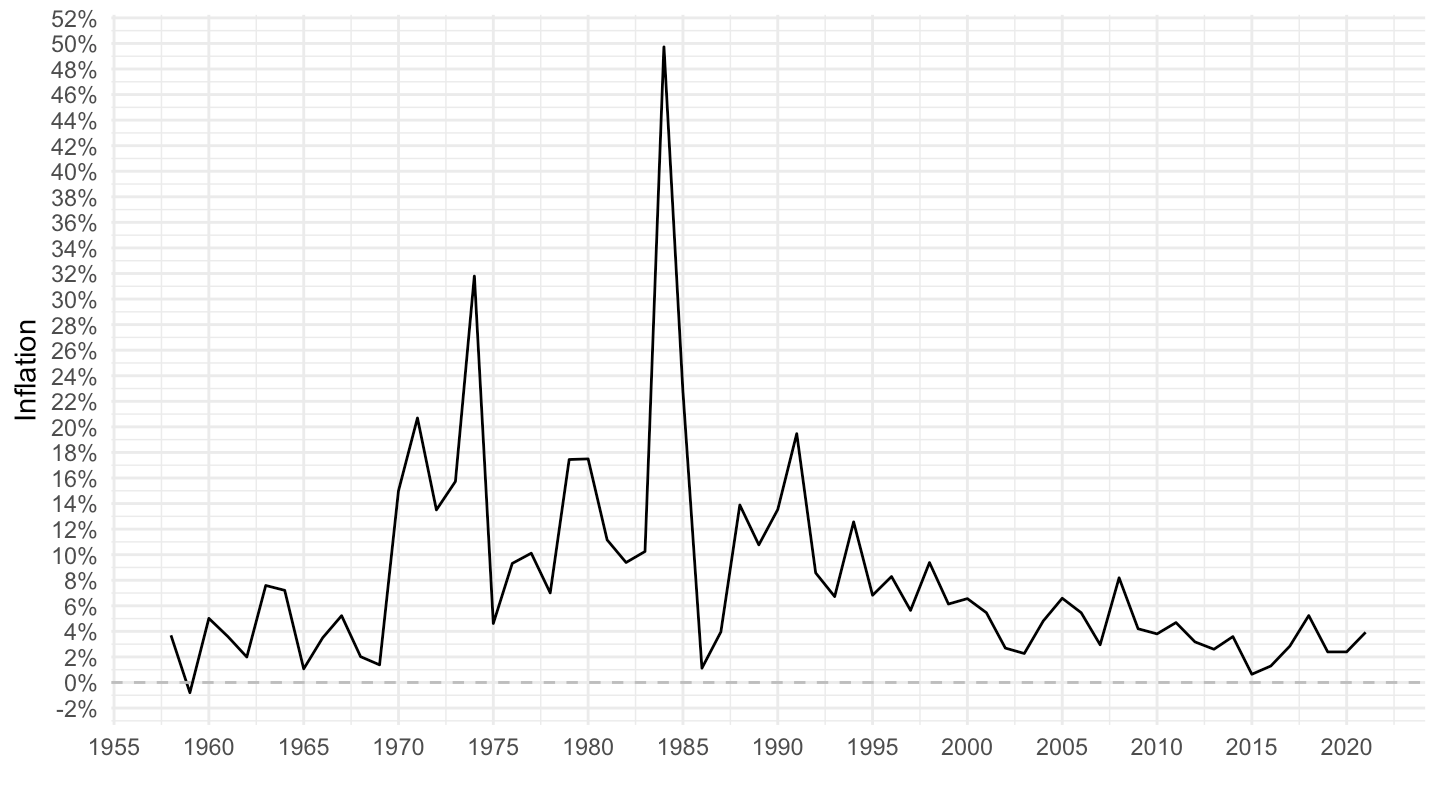
LONG_CPI |>
  filter(REF_AREA %in% c("GR"),
         UNIT_MEASURE == 771,
         FREQ == "A") |>
  year_to_date() |>
  ggplot() + geom_line() + theme_minimal() +
  aes(x = date, y = OBS_VALUE/100) + xlab("") + ylab("Inflation") +
  scale_x_date(breaks = seq(1900, 2100, 5) |> paste0("-01-01") |> as.Date(),
               labels = date_format("%Y")) +
  scale_y_continuous(breaks = 0.01*seq(-20, 700, 2),
                     labels = percent_format(a = 1)) +
  geom_hline(yintercept = 0, linetype = "dashed", color = "grey")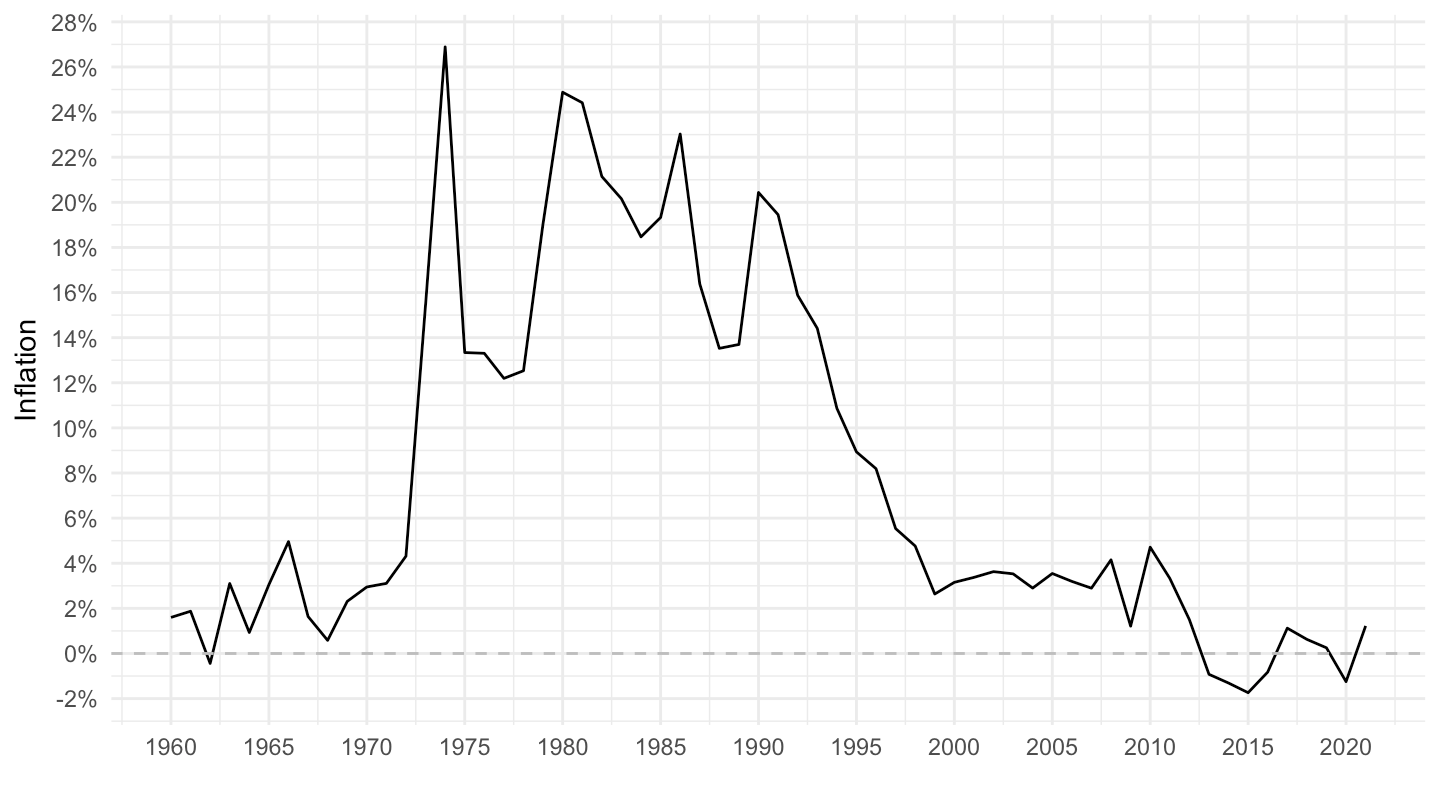
LONG_CPI |>
  filter(REF_AREA %in% c("NL"),
         UNIT_MEASURE == 771,
         FREQ == "A") |>
  year_to_date() |>
  ggplot() + geom_line() + theme_minimal() +
  aes(x = date, y = OBS_VALUE/100) + xlab("") + ylab("Inflation") +
  scale_x_date(breaks = seq(1900, 2100, 5) |> paste0("-01-01") |> as.Date(),
               labels = date_format("%Y")) +
  scale_y_continuous(breaks = 0.01*seq(-20, 700, 2),
                     labels = percent_format(a = 1)) +
  geom_hline(yintercept = 0, linetype = "dashed", color = "grey")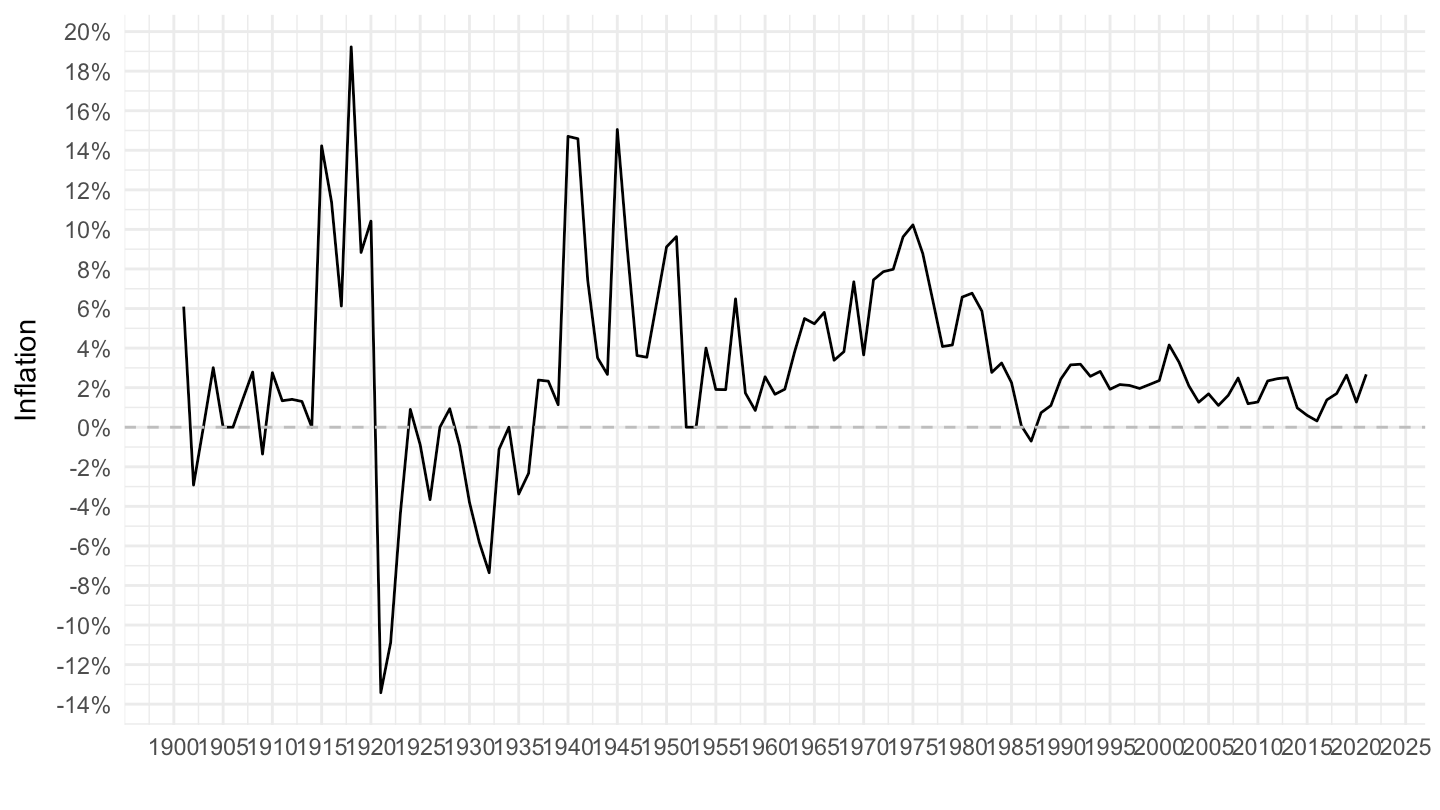
LONG_CPI |>
  filter(REF_AREA %in% c("NL"),
         UNIT_MEASURE == 771,
         FREQ == "A") |>
  year_to_date() |>
  filter(date >= as.Date("1952-01-01")) |>
  ggplot() + geom_line() + theme_minimal() +
  aes(x = date, y = OBS_VALUE/100) + xlab("") + ylab("Inflation") +
  scale_x_date(breaks = seq(1900, 2100, 5) |> paste0("-01-01") |> as.Date(),
               labels = date_format("%Y")) +
  scale_y_continuous(breaks = 0.01*seq(-20, 700, 2),
                     labels = percent_format(a = 1)) +
  geom_hline(yintercept = 0, linetype = "dashed", color = "grey")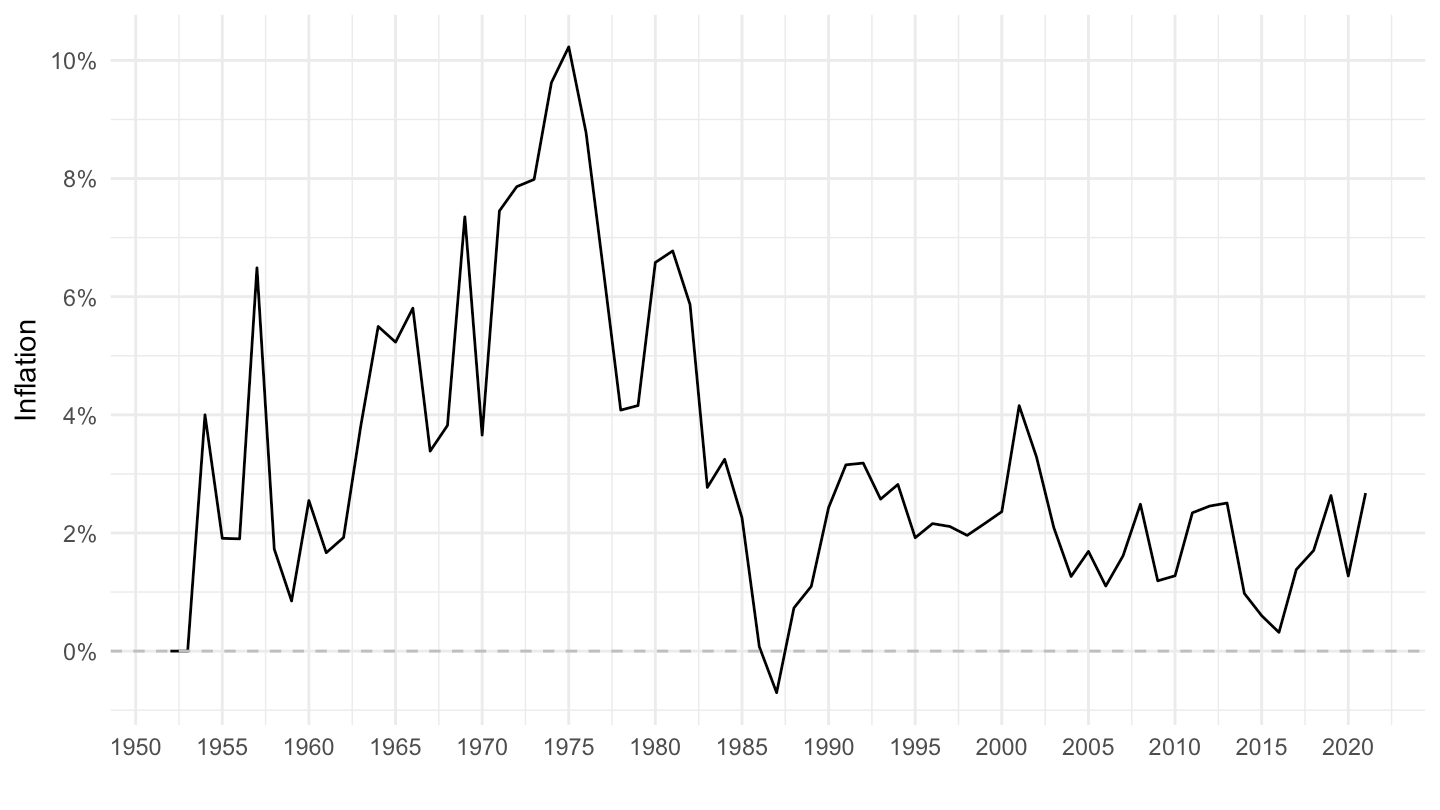
LONG_CPI |>
  filter(REF_AREA %in% c("SG"),
         UNIT_MEASURE == 771,
         FREQ == "A") |>
  year_to_date() |>
  ggplot() + geom_line() + theme_minimal() +
  aes(x = date, y = OBS_VALUE/100) + xlab("") + ylab("Inflation") +
  scale_x_date(breaks = seq(1900, 2100, 5) |> paste0("-01-01") |> as.Date(),
               labels = date_format("%Y")) +
  scale_y_continuous(breaks = 0.01*seq(-20, 700, 2),
                     labels = percent_format(a = 1)) +
  geom_hline(yintercept = 0, linetype = "dashed", color = "grey")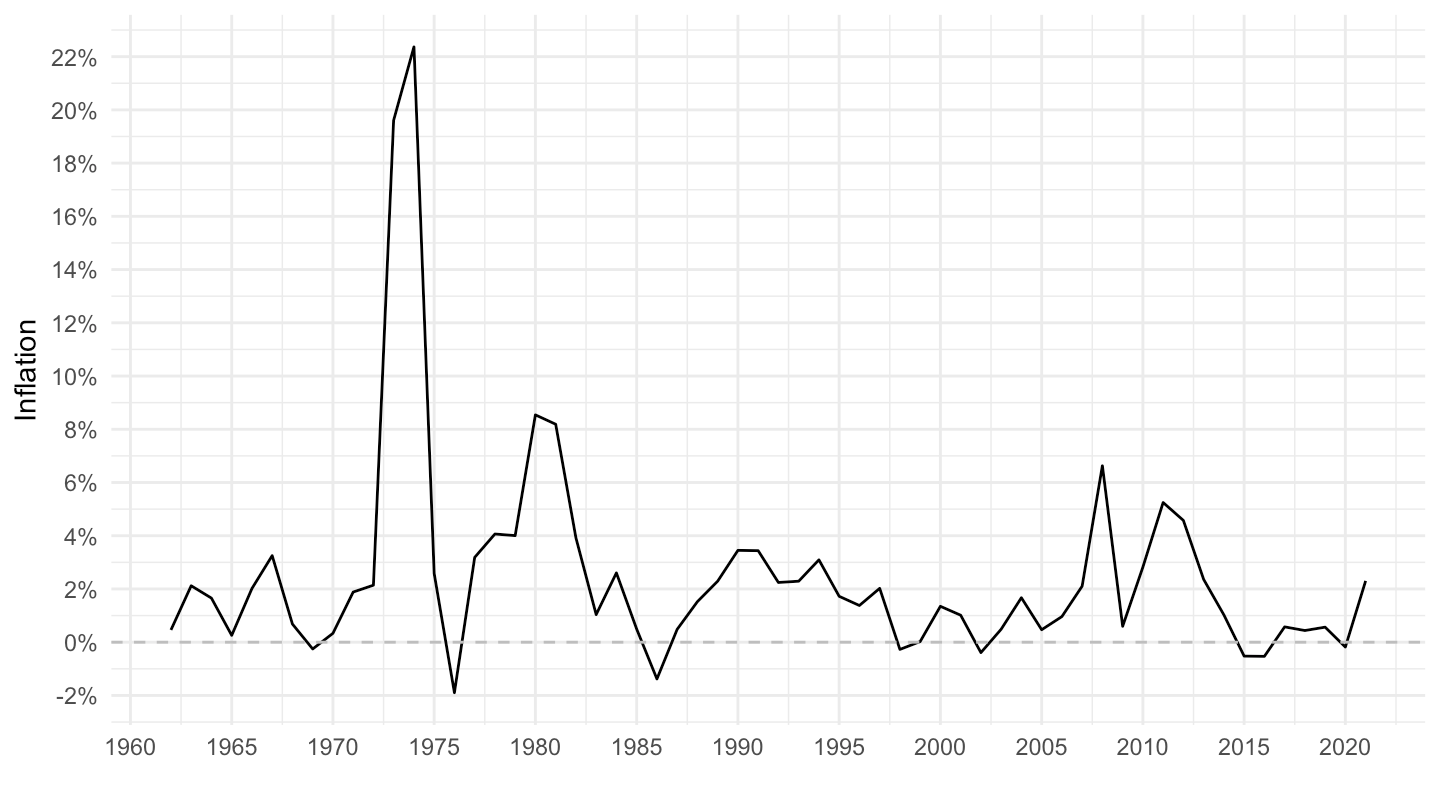
LONG_CPI |>
  filter(REF_AREA %in% c("TR"),
         UNIT_MEASURE == 771,
         FREQ == "A") |>
  year_to_date() |>
  ggplot() + geom_line() + theme_minimal() +
  aes(x = date, y = OBS_VALUE/100) + xlab("") + ylab("Inflation") +
  scale_x_date(breaks = seq(1900, 2100, 5) |> paste0("-01-01") |> as.Date(),
               labels = date_format("%Y")) +
  scale_y_continuous(breaks = 0.01*seq(-20, 700, 10),
                     labels = percent_format(a = 1)) +
  geom_hline(yintercept = 0, linetype = "dashed", color = "grey")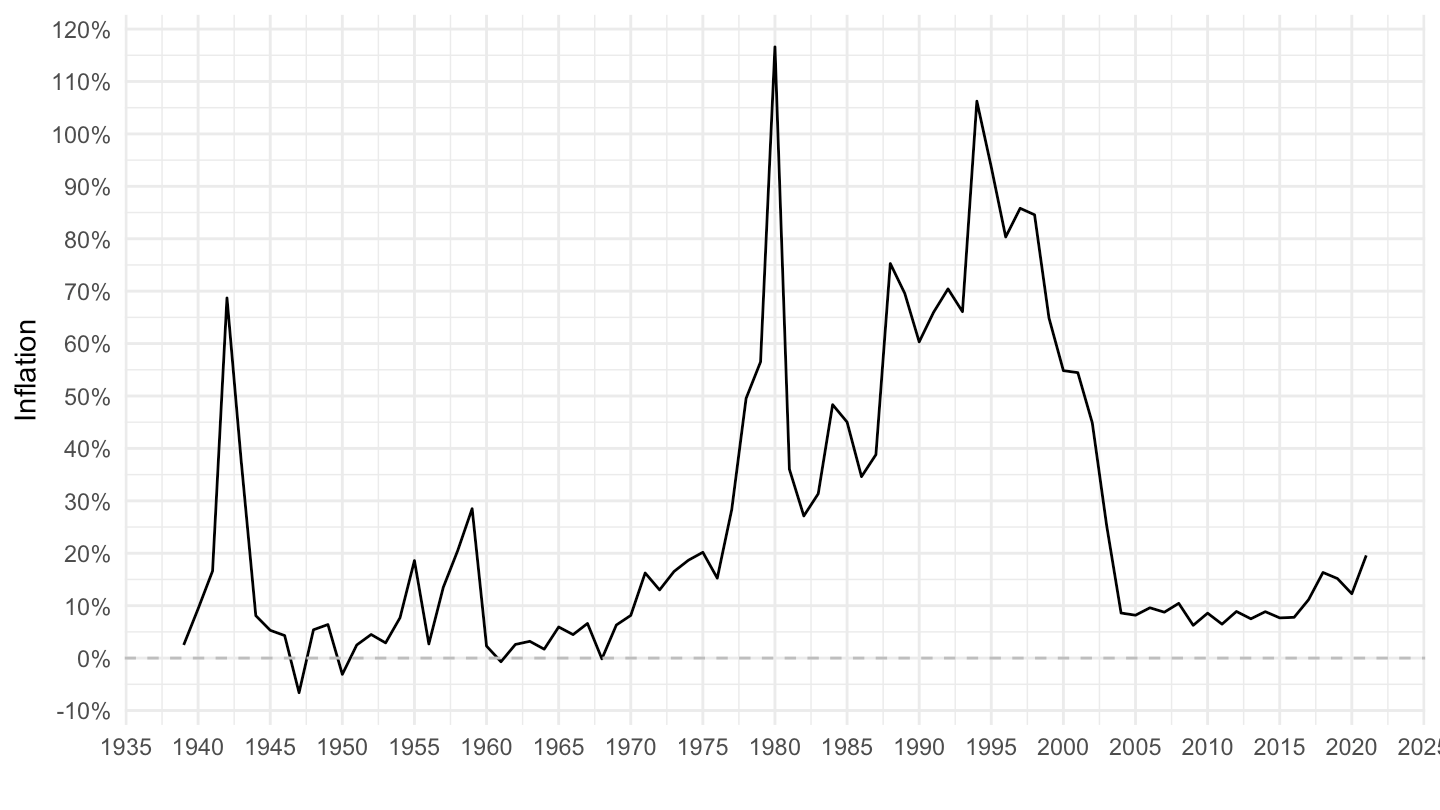
LONG_CPI |>
  filter(REF_AREA %in% c("KR"),
         UNIT_MEASURE == 771,
         FREQ == "A") |>
  year_to_date() |>
  ggplot() + geom_line() + theme_minimal() +
  aes(x = date, y = OBS_VALUE/100) + xlab("") + ylab("Inflation") +
  scale_x_date(breaks = seq(1900, 2100, 5) |> paste0("-01-01") |> as.Date(),
               labels = date_format("%Y")) +
  scale_y_continuous(breaks = 0.01*seq(-20, 700, 10),
                     labels = percent_format(a = 1)) +
  geom_hline(yintercept = 0, linetype = "dashed", color = "grey")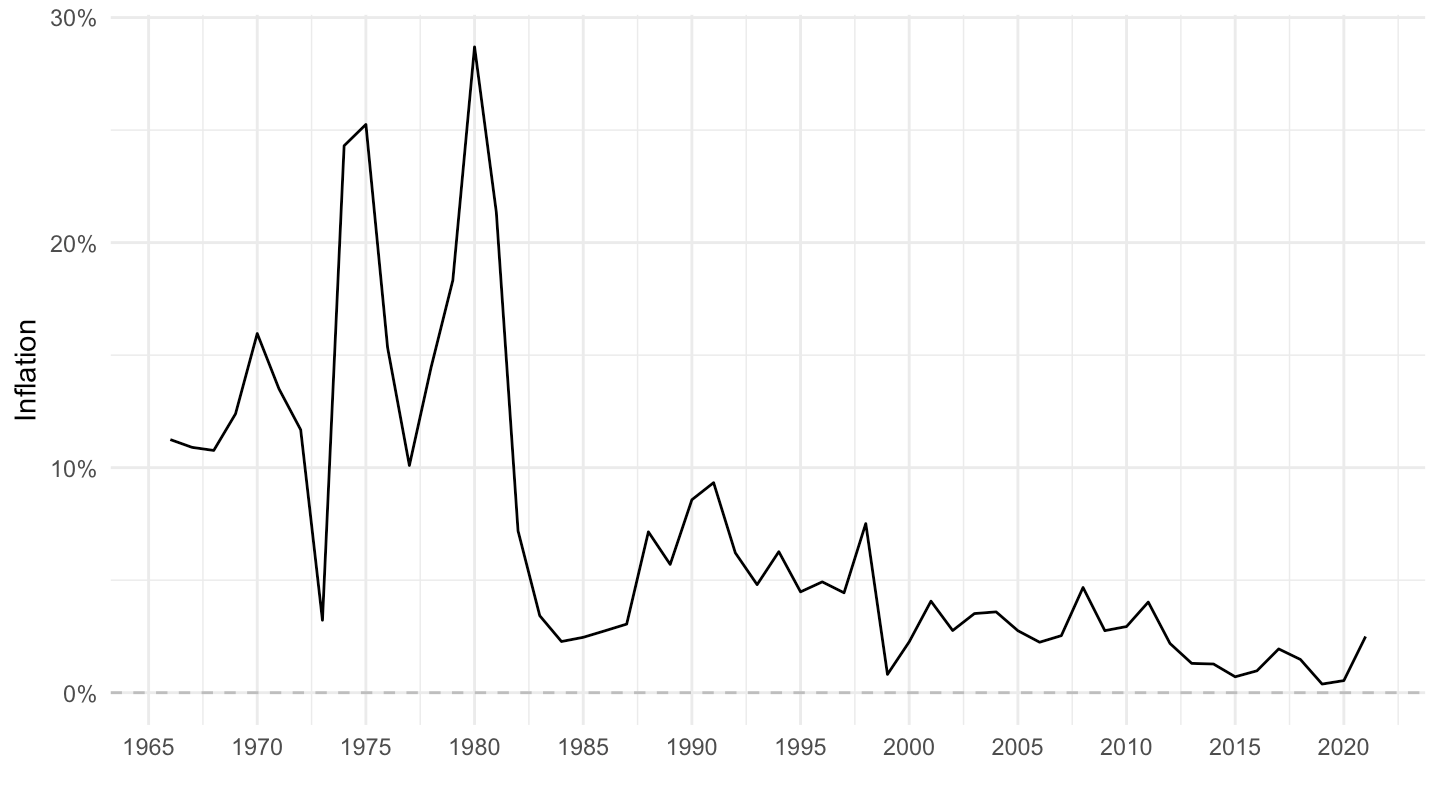
LONG_CPI |>
  filter(REF_AREA %in% c("MX"),
         UNIT_MEASURE == 771,
         FREQ == "A") |>
  year_to_date() |>
  ggplot() + geom_line() + theme_minimal() +
  aes(x = date, y = OBS_VALUE/100) + xlab("") + ylab("Inflation") +
  scale_x_date(breaks = seq(1900, 2100, 5) |> paste0("-01-01") |> as.Date(),
               labels = date_format("%Y")) +
  scale_y_continuous(breaks = 0.01*seq(-20, 700, 10),
                     labels = percent_format(a = 1)) +
  geom_hline(yintercept = 0, linetype = "dashed", color = "grey")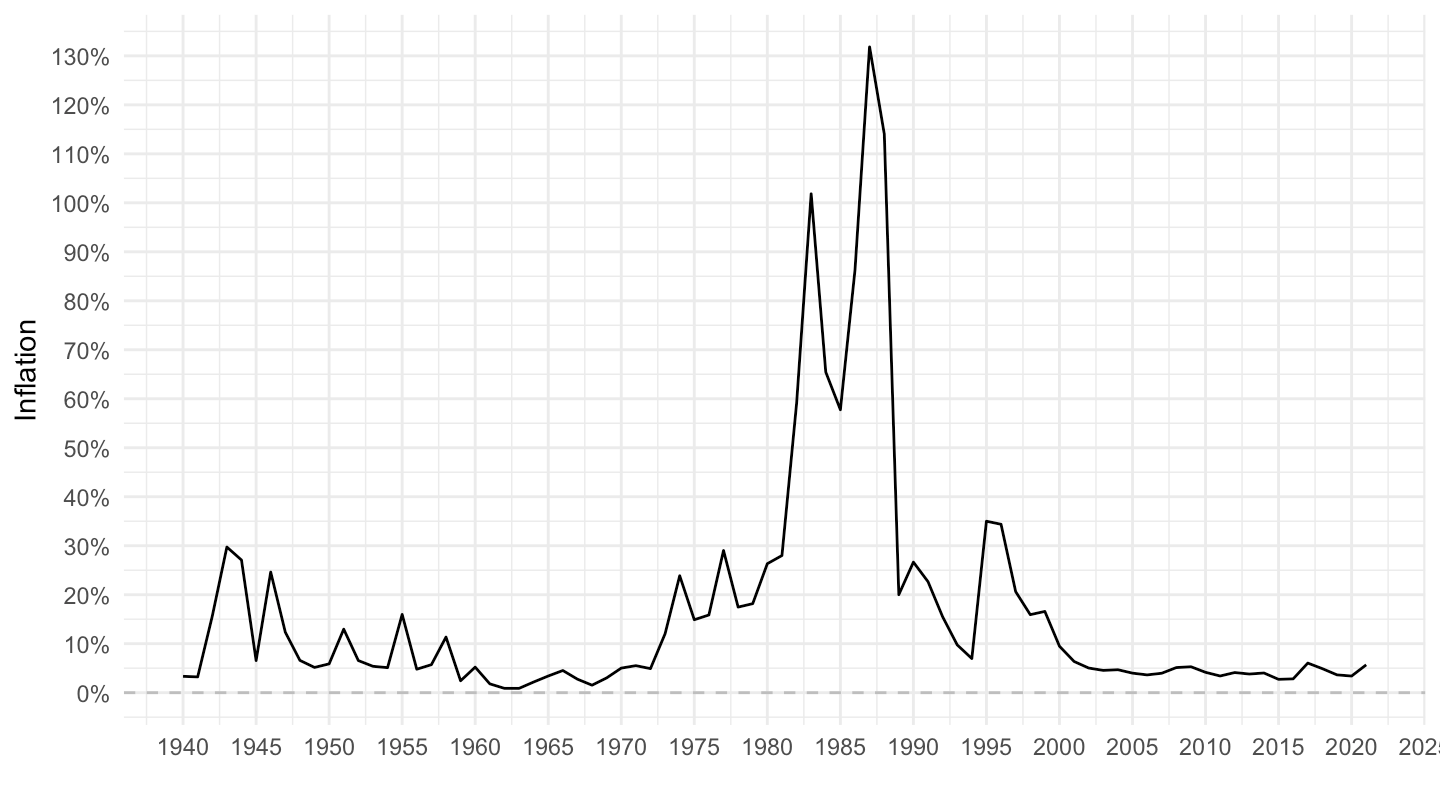
LONG_CPI |>
  filter(REF_AREA %in% c("MY"),
         UNIT_MEASURE == 771,
         FREQ == "A") |>
  year_to_date() |>
  ggplot() + geom_line() + theme_minimal() +
  aes(x = date, y = OBS_VALUE/100) + xlab("") + ylab("Inflation") +
  scale_x_date(breaks = seq(1900, 2100, 5) |> paste0("-01-01") |> as.Date(),
               labels = date_format("%Y")) +
  scale_y_continuous(breaks = 0.01*seq(-20, 700, 2),
                     labels = percent_format(a = 1)) +
  geom_hline(yintercept = 0, linetype = "dashed", color = "grey")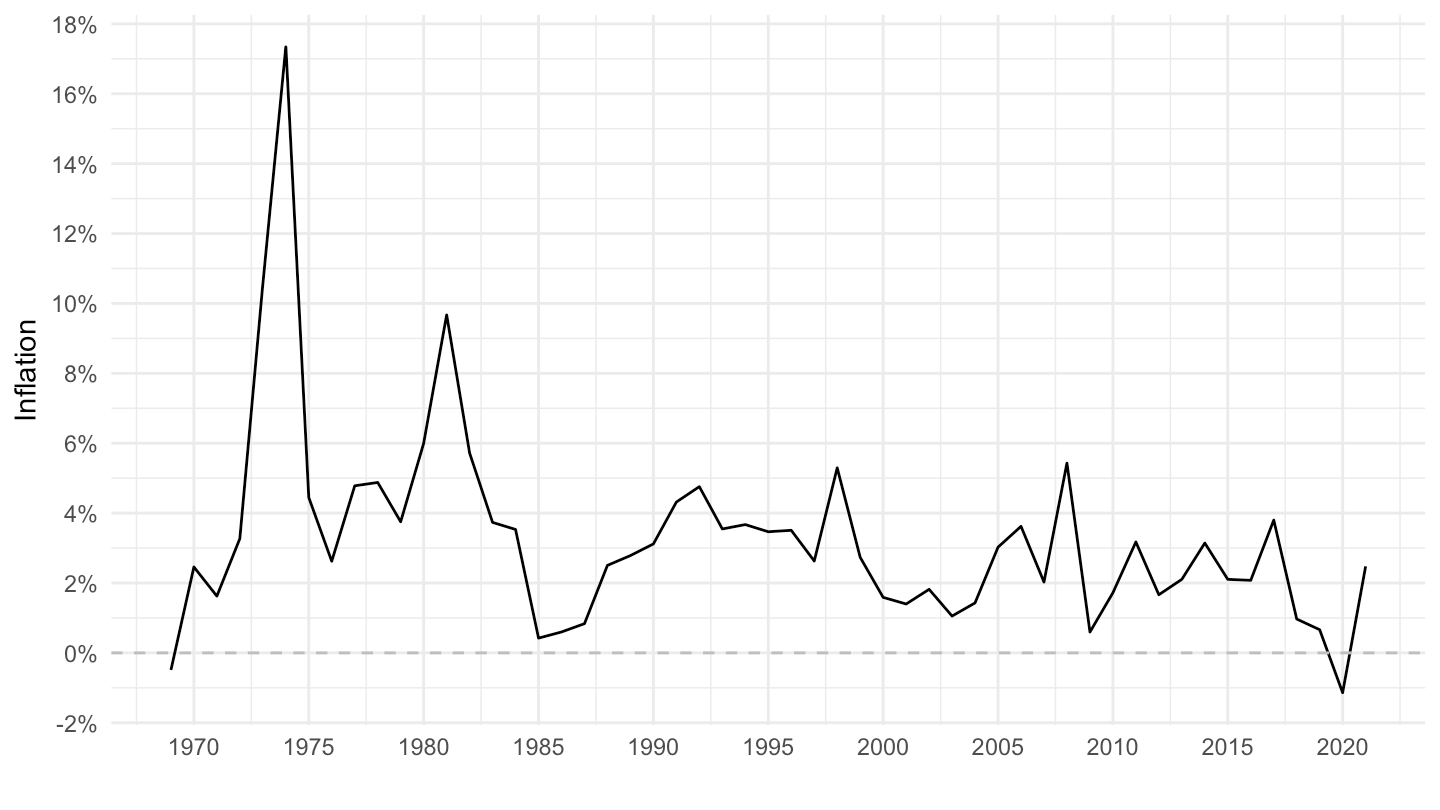
LONG_CPI |>
  filter(REF_AREA %in% c("MT"),
         UNIT_MEASURE == 771,
         FREQ == "A") |>
  year_to_date() |>
  ggplot() + geom_line() + theme_minimal() +
  aes(x = date, y = OBS_VALUE/100) + xlab("") + ylab("Inflation") +
  scale_x_date(breaks = seq(1900, 2100, 5) |> paste0("-01-01") |> as.Date(),
               labels = date_format("%Y")) +
  scale_y_continuous(breaks = 0.01*seq(-20, 700, 2),
                     labels = percent_format(a = 1)) +
  geom_hline(yintercept = 0, linetype = "dashed", color = "grey")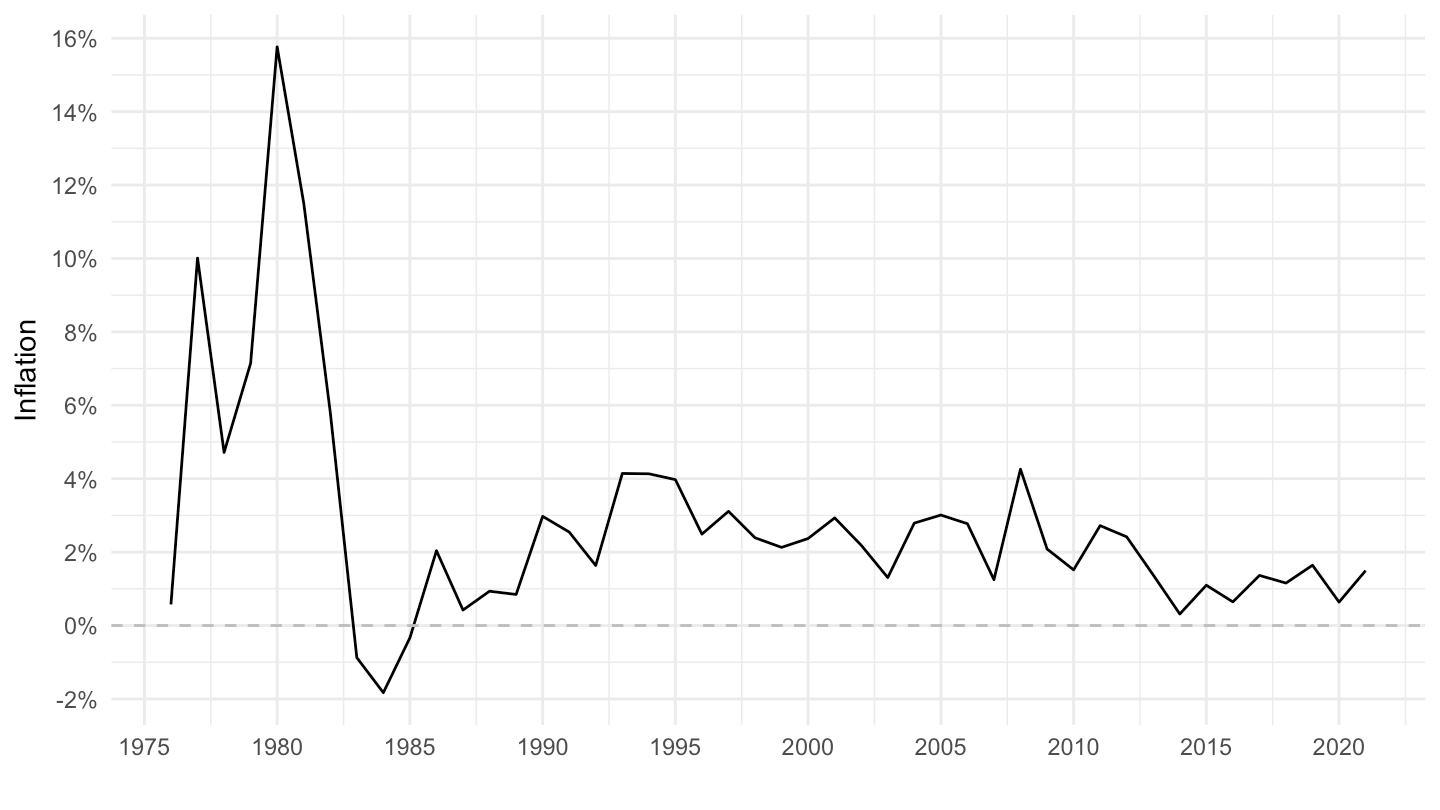
LONG_CPI |>
  filter(REF_AREA %in% c("TH"),
         UNIT_MEASURE == 771,
         FREQ == "A") |>
  year_to_date() |>
  ggplot() + geom_line() + theme_minimal() +
  aes(x = date, y = OBS_VALUE/100) + xlab("") + ylab("Inflation") +
  scale_x_date(breaks = seq(1900, 2100, 5) |> paste0("-01-01") |> as.Date(),
               labels = date_format("%Y")) +
  scale_y_continuous(breaks = 0.01*seq(-20, 700, 2),
                     labels = percent_format(a = 1)) +
  geom_hline(yintercept = 0, linetype = "dashed", color = "grey")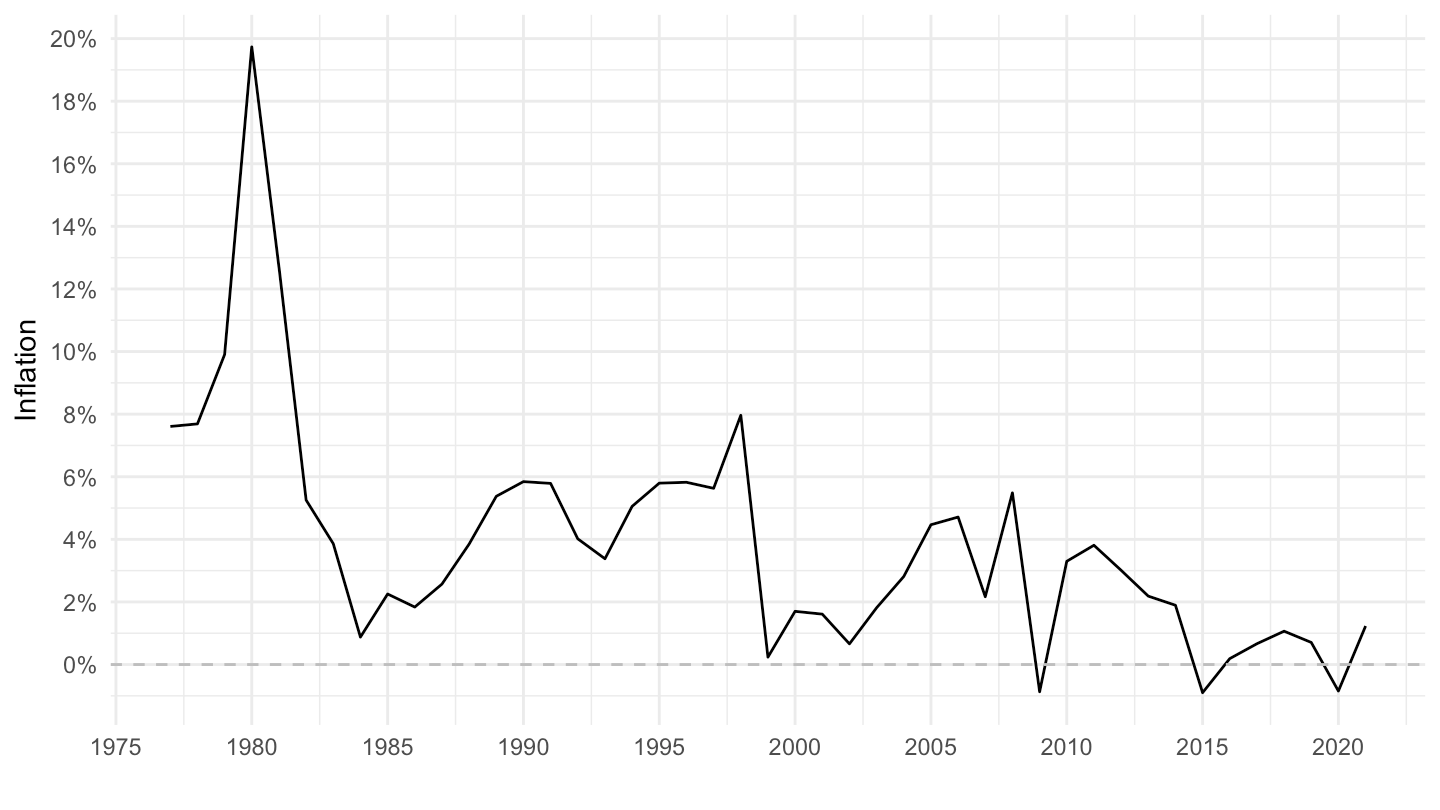
LONG_CPI |>
  filter(REF_AREA %in% c("ID"),
         UNIT_MEASURE == 771,
         FREQ == "A") |>
  year_to_date() |>
  ggplot() + geom_line() + theme_minimal() +
  aes(x = date, y = OBS_VALUE/100) + xlab("") + ylab("Inflation") +
  scale_x_date(breaks = seq(1900, 2100, 5) |> paste0("-01-01") |> as.Date(),
               labels = date_format("%Y")) +
  scale_y_continuous(breaks = 0.01*seq(-20, 700, 5),
                     labels = percent_format(a = 1)) +
  geom_hline(yintercept = 0, linetype = "dashed", color = "grey")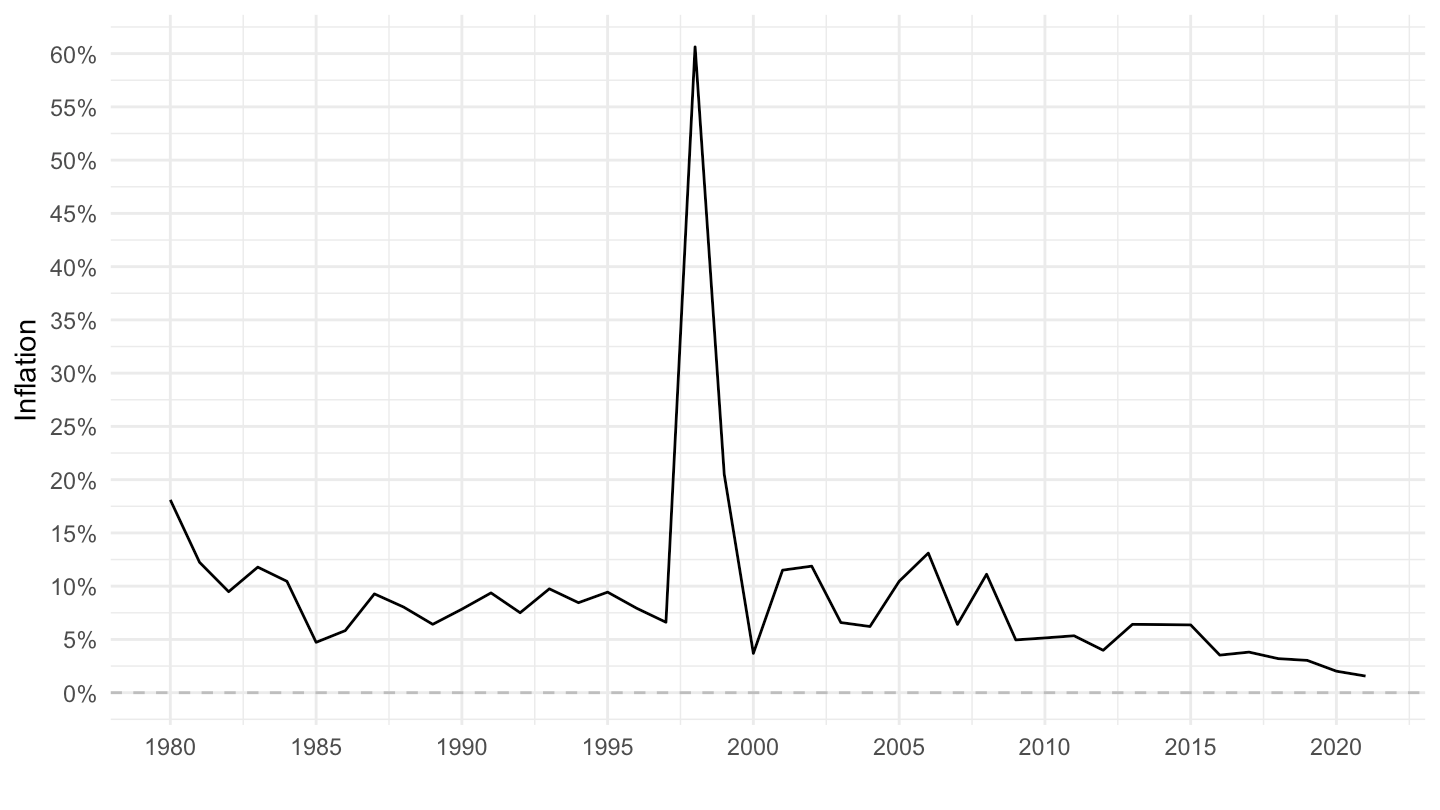
LONG_CPI |>
  filter(REF_AREA %in% c("BR"),
         UNIT_MEASURE == 771,
         FREQ == "A") |>
  year_to_date() |>
  ggplot() + geom_line() + theme_minimal() +
  aes(x = date, y = OBS_VALUE/100) + xlab("") + ylab("Inflation") +
  scale_x_date(breaks = seq(1900, 2100, 5) |> paste0("-01-01") |> as.Date(),
               labels = date_format("%Y")) +
  scale_y_continuous(breaks = 0.01*seq(-100, 10000, 100),
                     labels = percent_format(a = 1)) +
  geom_hline(yintercept = 0, linetype = "dashed", color = "grey")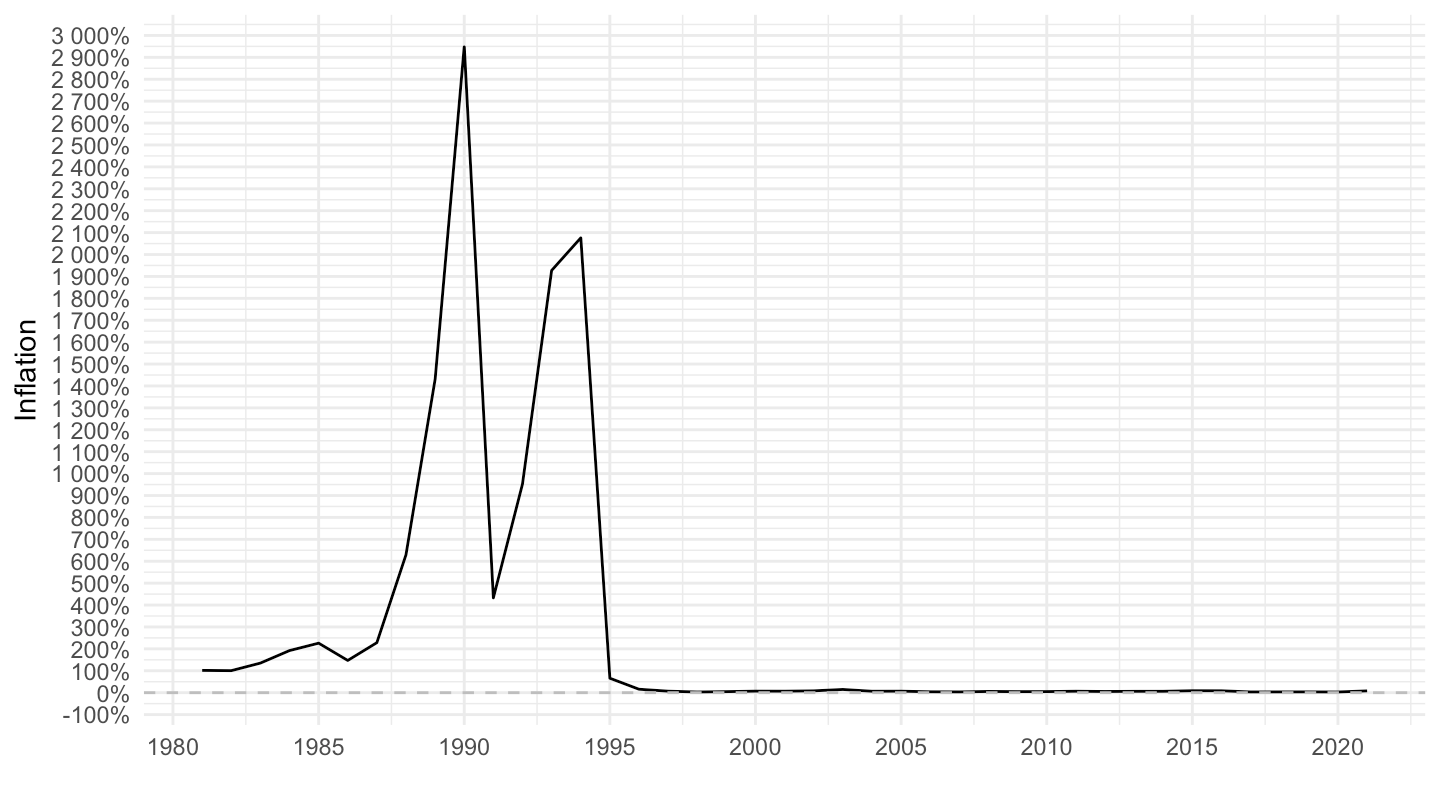
LONG_CPI |>
  filter(REF_AREA %in% c("CY"),
         UNIT_MEASURE == 771,
         FREQ == "A") |>
  year_to_date() |>
  ggplot() + geom_line() + theme_minimal() +
  aes(x = date, y = OBS_VALUE/100) + xlab("") + ylab("Inflation") +
  scale_x_date(breaks = seq(1900, 2100, 5) |> paste0("-01-01") |> as.Date(),
               labels = date_format("%Y")) +
  scale_y_continuous(breaks = 0.01*seq(-100, 10000, 2),
                     labels = percent_format(a = 1)) +
  geom_hline(yintercept = 0, linetype = "dashed", color = "grey")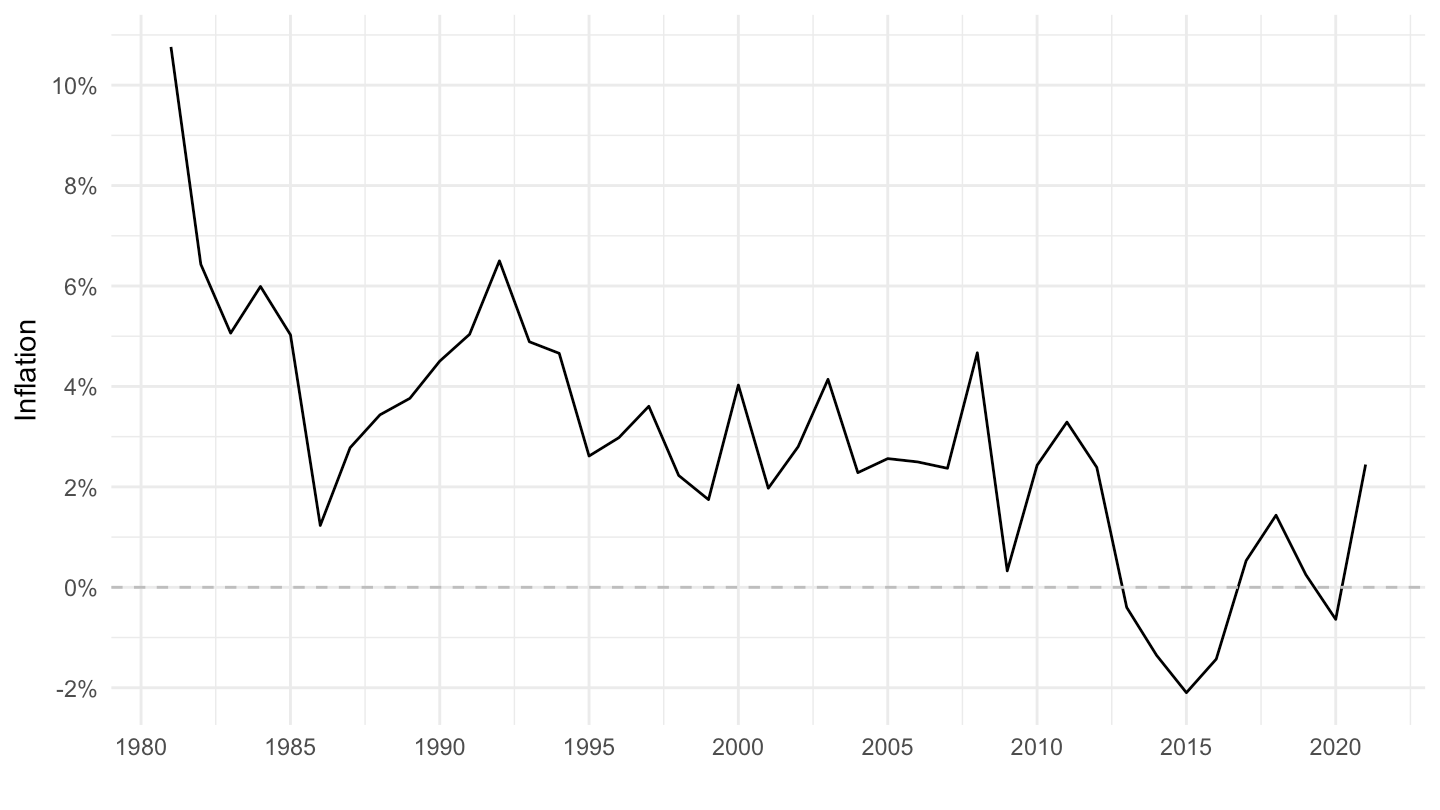
LONG_CPI |>
  filter(REF_AREA %in% c("PL"),
         UNIT_MEASURE == 771,
         FREQ == "A") |>
  year_to_date() |>
  ggplot() + geom_line() + theme_minimal() +
  aes(x = date, y = OBS_VALUE/100) + xlab("") + ylab("Inflation") +
  scale_x_date(breaks = seq(1900, 2100, 5) |> paste0("-01-01") |> as.Date(),
               labels = date_format("%Y")) +
  scale_y_continuous(breaks = 0.01*seq(-100, 10000, 100),
                     labels = percent_format(a = 1)) +
  geom_hline(yintercept = 0, linetype = "dashed", color = "grey")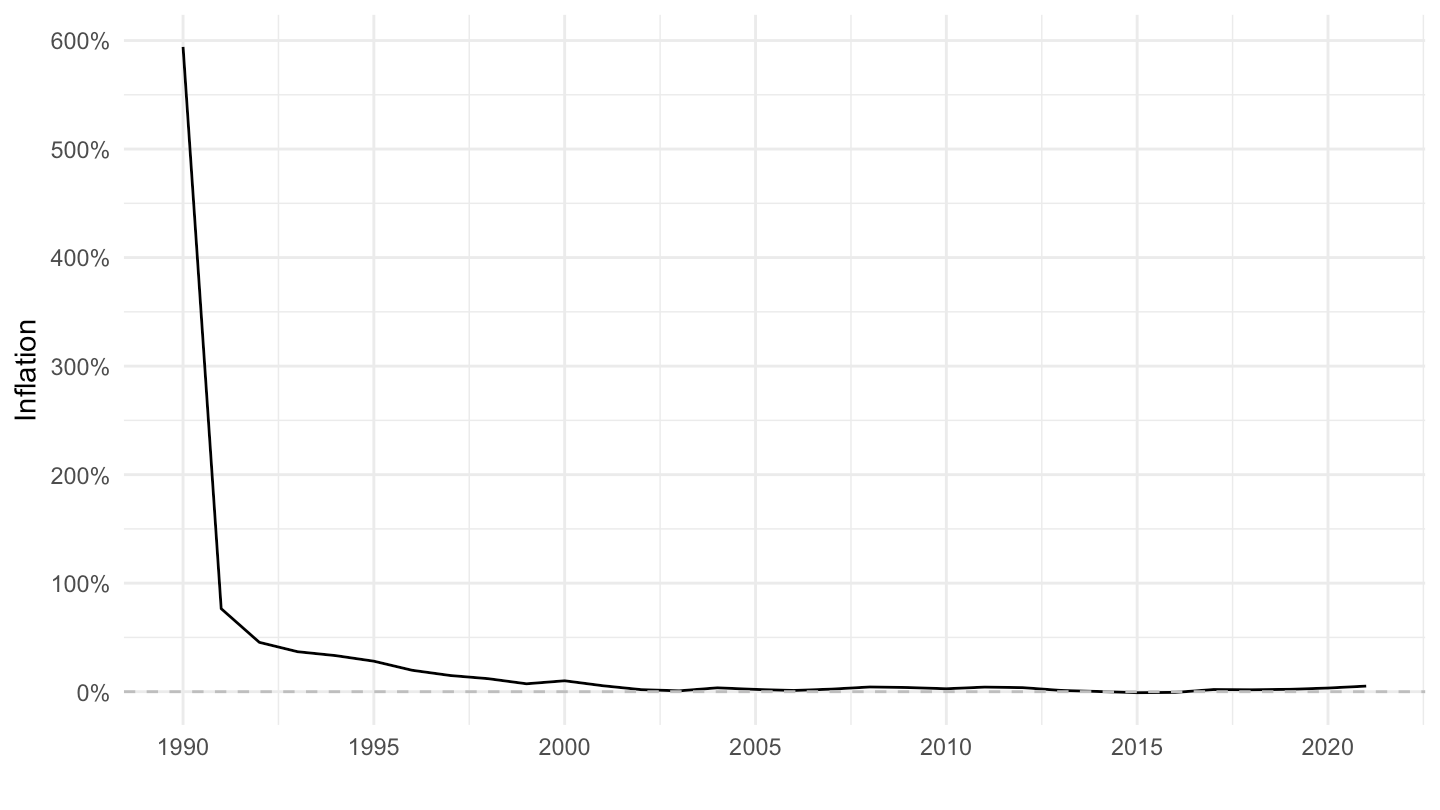
LONG_CPI |>
  filter(REF_AREA %in% c("CZ"),
         UNIT_MEASURE == 771,
         FREQ == "A") |>
  year_to_date() |>
  ggplot() + geom_line() + theme_minimal() +
  aes(x = date, y = OBS_VALUE/100) + xlab("") + ylab("Inflation") +
  scale_x_date(breaks = seq(1900, 2100, 5) |> paste0("-01-01") |> as.Date(),
               labels = date_format("%Y")) +
  scale_y_continuous(breaks = 0.01*seq(-100, 10000, 10),
                     labels = percent_format(a = 1)) +
  geom_hline(yintercept = 0, linetype = "dashed", color = "grey")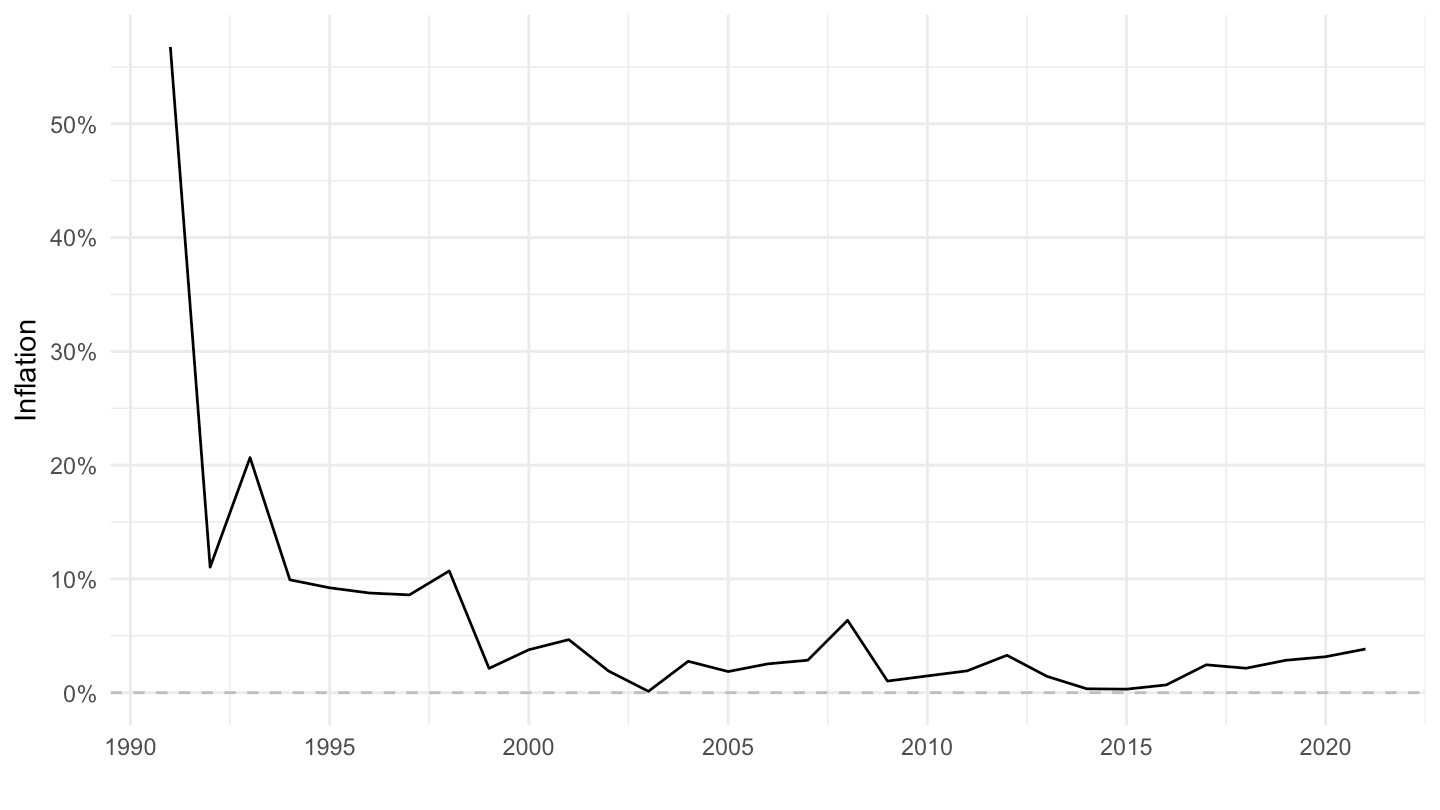
LONG_CPI |>
  filter(REF_AREA %in% c("XM"),
         UNIT_MEASURE == 771,
         FREQ == "A") |>
  year_to_date() |>
  ggplot() + geom_line() + theme_minimal() +
  aes(x = date, y = OBS_VALUE/100) + xlab("") + ylab("Inflation") +
  scale_x_date(breaks = seq(1900, 2100, 5) |> paste0("-01-01") |> as.Date(),
               labels = date_format("%Y")) +
  scale_y_continuous(breaks = 0.01*seq(-100, 10000, 1),
                     labels = percent_format(a = 1)) +
  geom_hline(yintercept = 0, linetype = "dashed", color = "grey")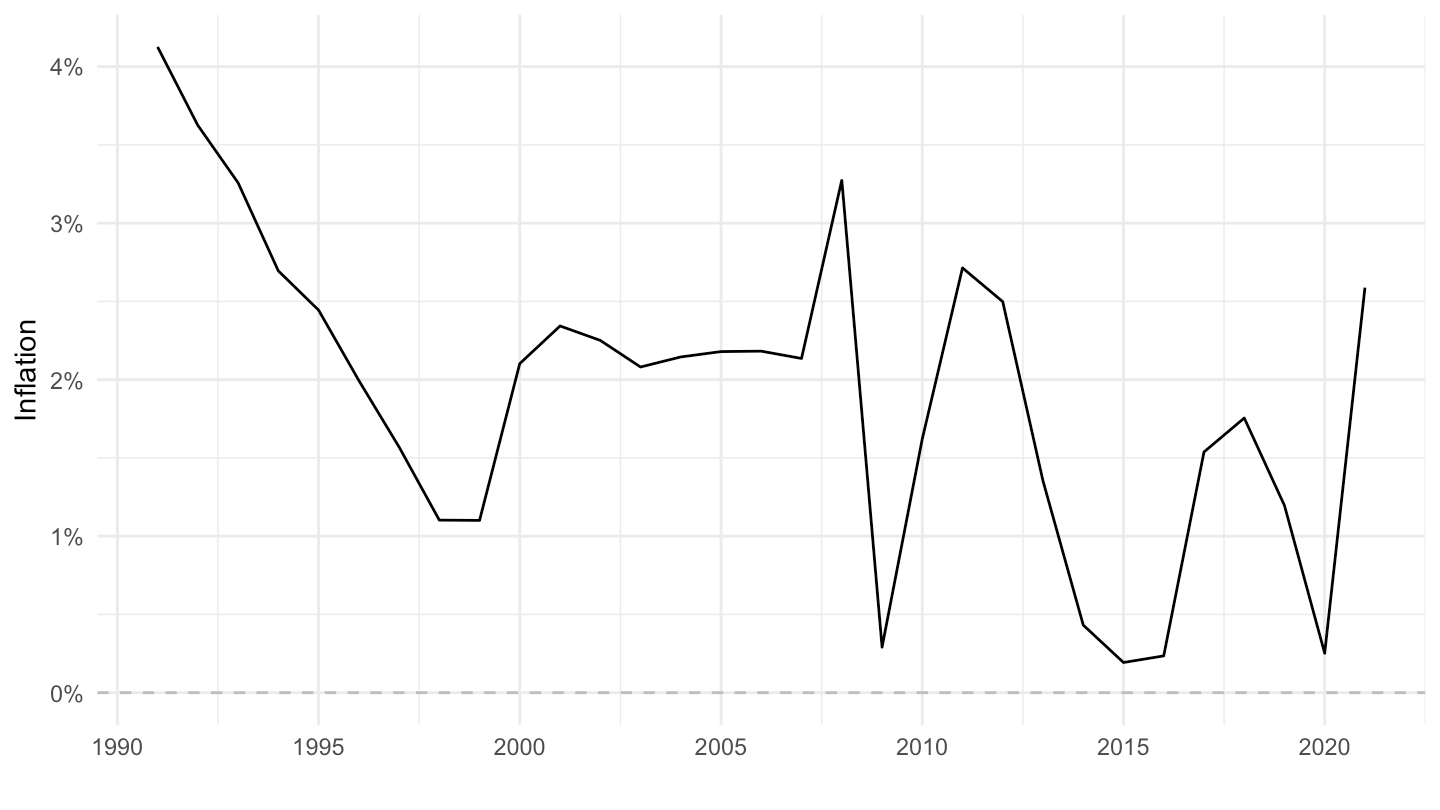
LONG_CPI |>
  filter(REF_AREA == "SA",
         UNIT_MEASURE == 771,
         FREQ == "A") |>
  year_to_date() |>
  ggplot() + geom_line() + theme_minimal() +
  aes(x = date, y = OBS_VALUE/100) + xlab("") + ylab("Inflation") +
  scale_x_date(breaks = seq(1900, 2100, 5) |> paste0("-01-01") |> as.Date(),
               labels = date_format("%Y")) +
  scale_y_continuous(breaks = 0.01*seq(-100, 10000, 1),
                     labels = percent_format(a = 1)) +
  geom_hline(yintercept = 0, linetype = "dashed", color = "grey")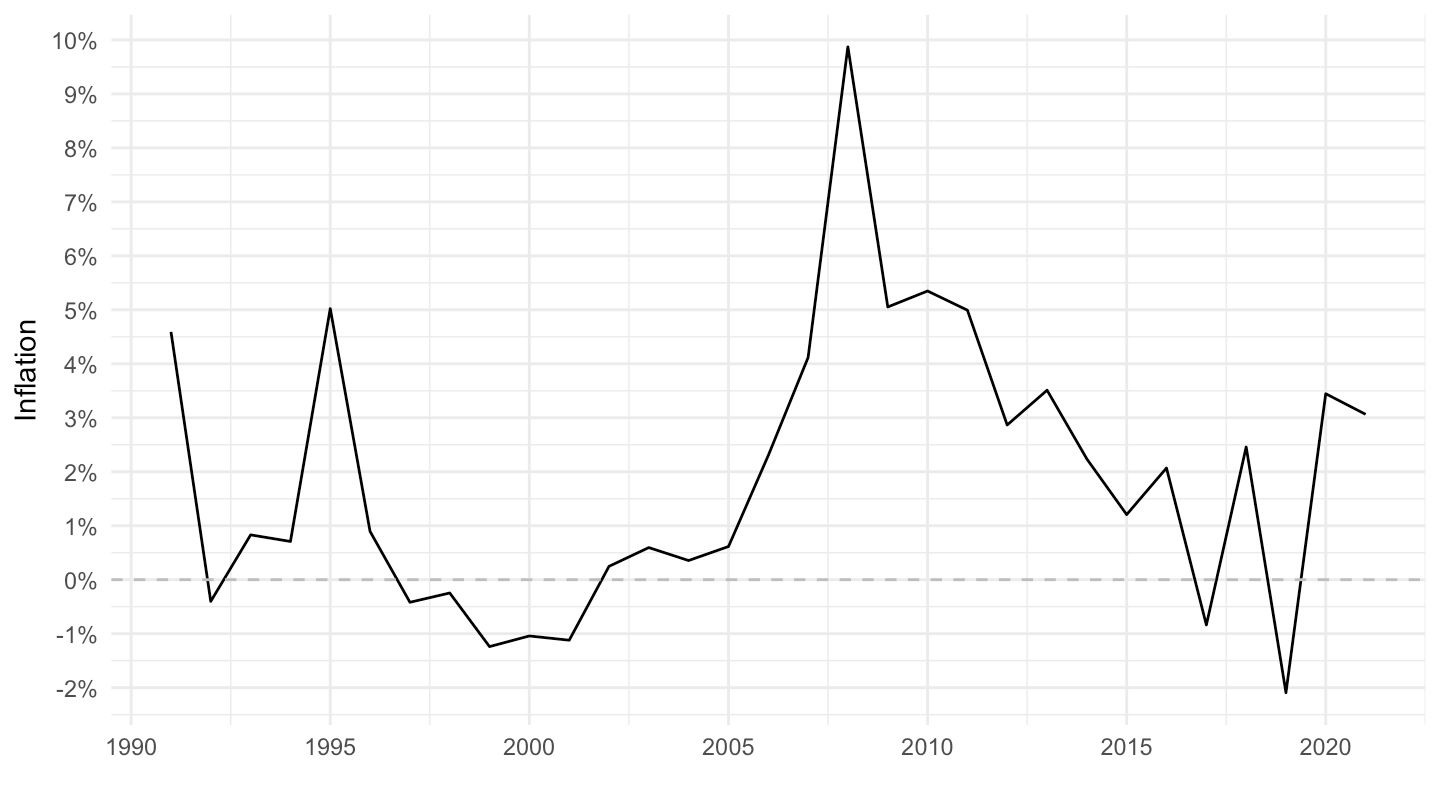
LONG_CPI |>
  filter(REF_AREA == c("SK"),
         UNIT_MEASURE == 771,
         FREQ == "A") |>
  year_to_date() |>
  ggplot() + geom_line() + theme_minimal() +
  aes(x = date, y = OBS_VALUE/100) + xlab("") + ylab("Inflation") +
  scale_x_date(breaks = seq(1900, 2100, 5) |> paste0("-01-01") |> as.Date(),
               labels = date_format("%Y")) +
  scale_y_continuous(breaks = 0.01*seq(-100, 10000, 10),
                     labels = percent_format(a = 1)) +
  geom_hline(yintercept = 0, linetype = "dashed", color = "grey")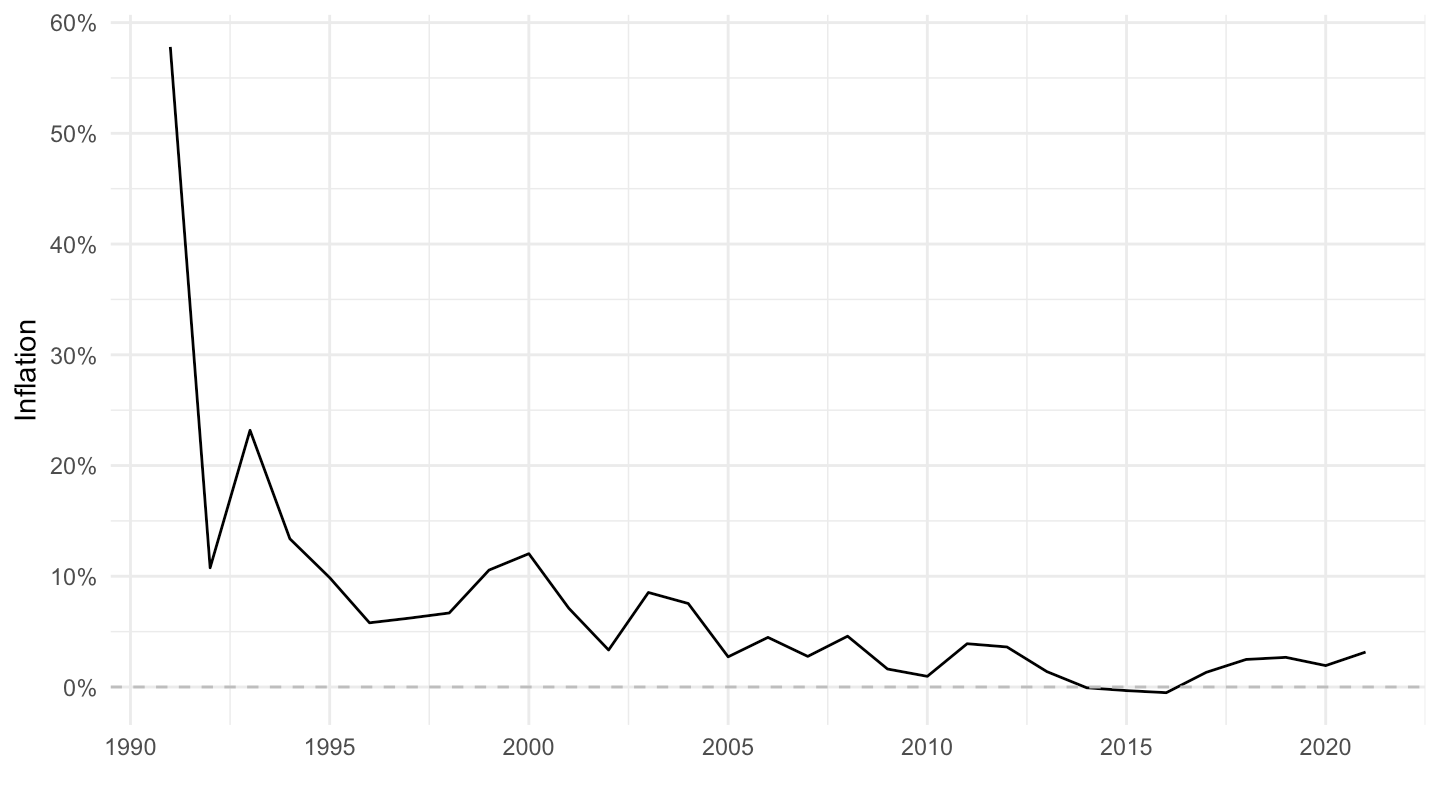
LONG_CPI |>
  filter(REF_AREA == "BG",
         UNIT_MEASURE == 771,
         FREQ == "A") |>
  year_to_date() |>
  ggplot() + geom_line() + theme_minimal() +
  aes(x = date, y = OBS_VALUE/100) + xlab("") + ylab("Inflation") +
  scale_x_date(breaks = seq(1900, 2100, 5) |> paste0("-01-01") |> as.Date(),
               labels = date_format("%Y")) +
  scale_y_continuous(breaks = 0.01*seq(-100, 10000, 100),
                     labels = percent_format(a = 1)) +
  geom_hline(yintercept = 0, linetype = "dashed", color = "grey")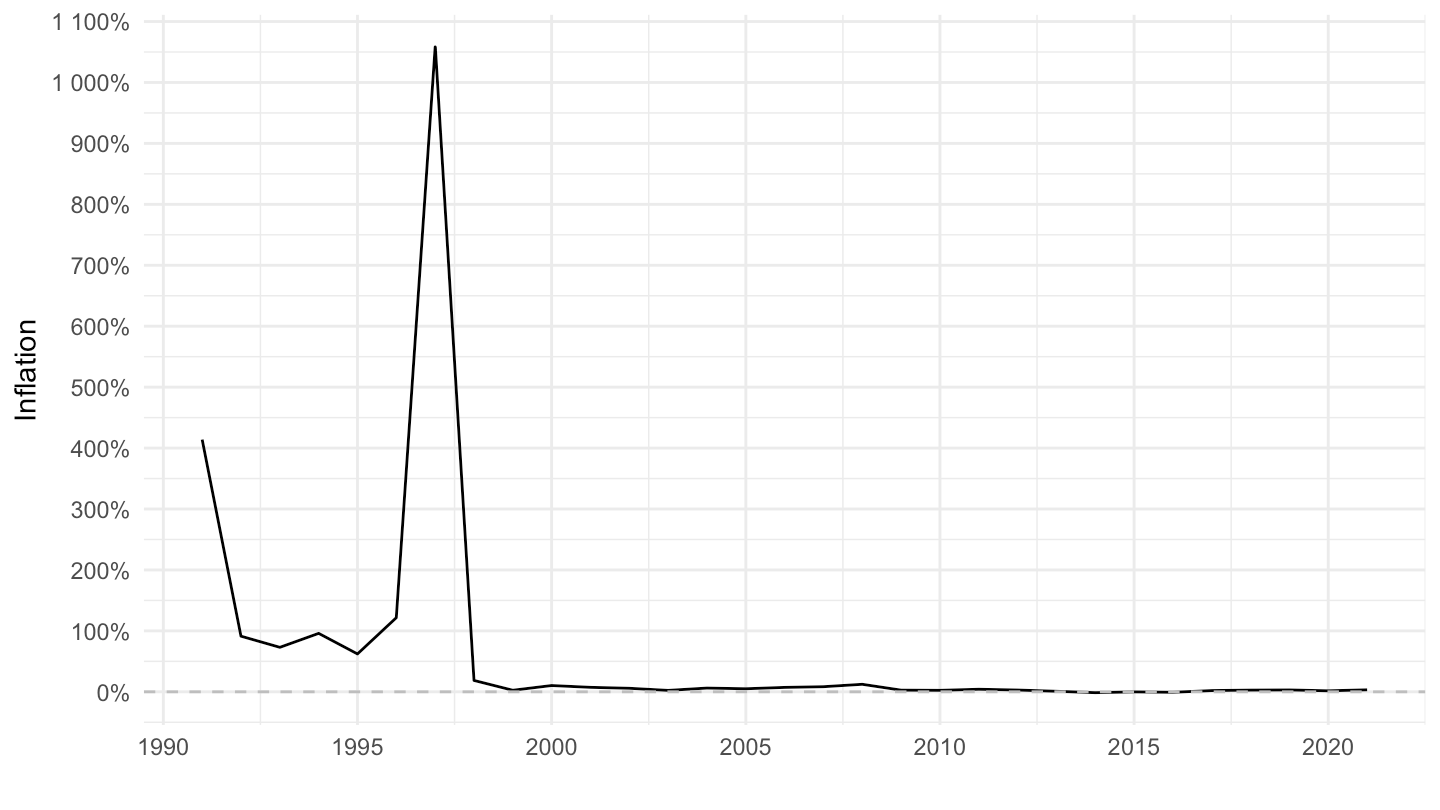
LONG_CPI |>
  filter(REF_AREA == "RO",
         UNIT_MEASURE == 771,
         FREQ == "A") |>
  year_to_date() |>
  ggplot() + geom_line() + theme_minimal() +
  aes(x = date, y = OBS_VALUE/100) + xlab("") + ylab("Inflation") +
  scale_x_date(breaks = seq(1900, 2100, 5) |> paste0("-01-01") |> as.Date(),
               labels = date_format("%Y")) +
  scale_y_continuous(breaks = 0.01*seq(-100, 10000, 100),
                     labels = percent_format(a = 1)) +
  geom_hline(yintercept = 0, linetype = "dashed", color = "grey")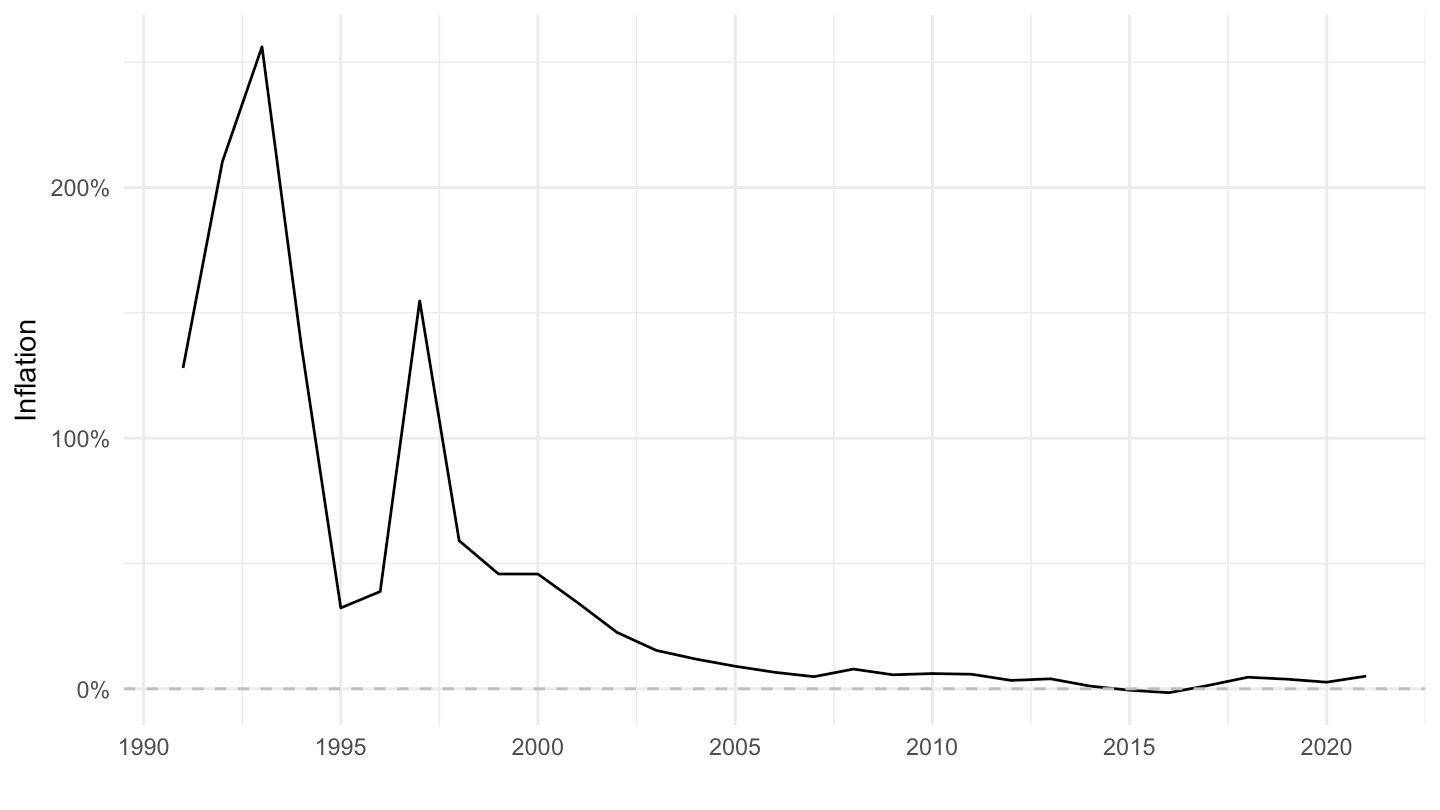
LONG_CPI |>
  filter(REF_AREA == "LT",
         UNIT_MEASURE == 771,
         FREQ == "A") |>
  year_to_date() |>
  ggplot() + geom_line() + theme_minimal() +
  aes(x = date, y = OBS_VALUE/100) + xlab("") + ylab("Inflation") +
  scale_x_date(breaks = seq(1900, 2100, 5) |> paste0("-01-01") |> as.Date(),
               labels = date_format("%Y")) +
  scale_y_continuous(breaks = 0.01*seq(-100, 10000, 100),
                     labels = percent_format(a = 1)) +
  geom_hline(yintercept = 0, linetype = "dashed", color = "grey")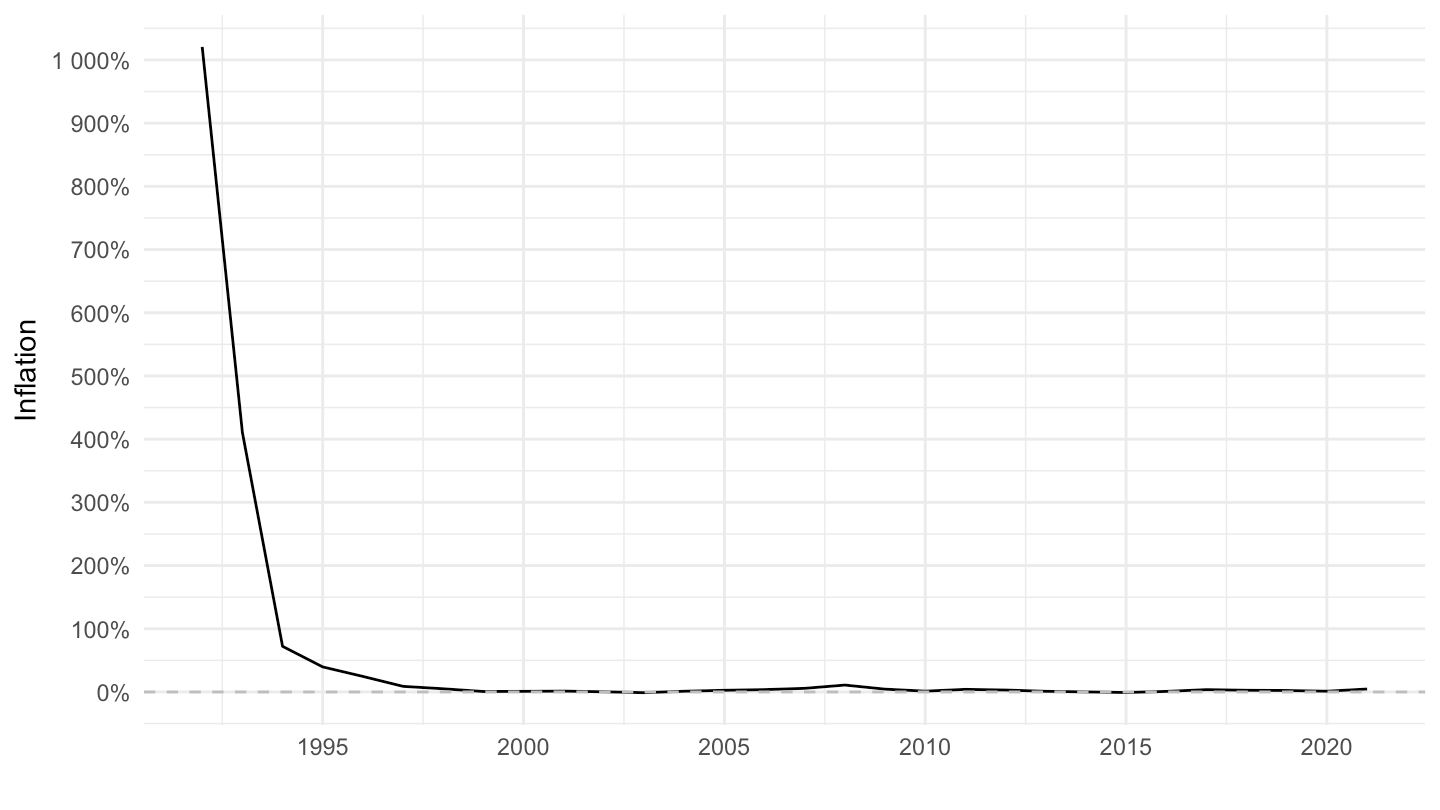
LONG_CPI |>
  filter(REF_AREA == "LV",
         UNIT_MEASURE == 771,
         FREQ == "A") |>
  year_to_date() |>
  ggplot() + geom_line() + theme_minimal() +
  aes(x = date, y = OBS_VALUE/100) + xlab("") + ylab("Inflation") +
  scale_x_date(breaks = seq(1900, 2100, 5) |> paste0("-01-01") |> as.Date(),
               labels = date_format("%Y")) +
  scale_y_continuous(breaks = 0.01*seq(-100, 10000, 100),
                     labels = percent_format(a = 1)) +
  geom_hline(yintercept = 0, linetype = "dashed", color = "grey")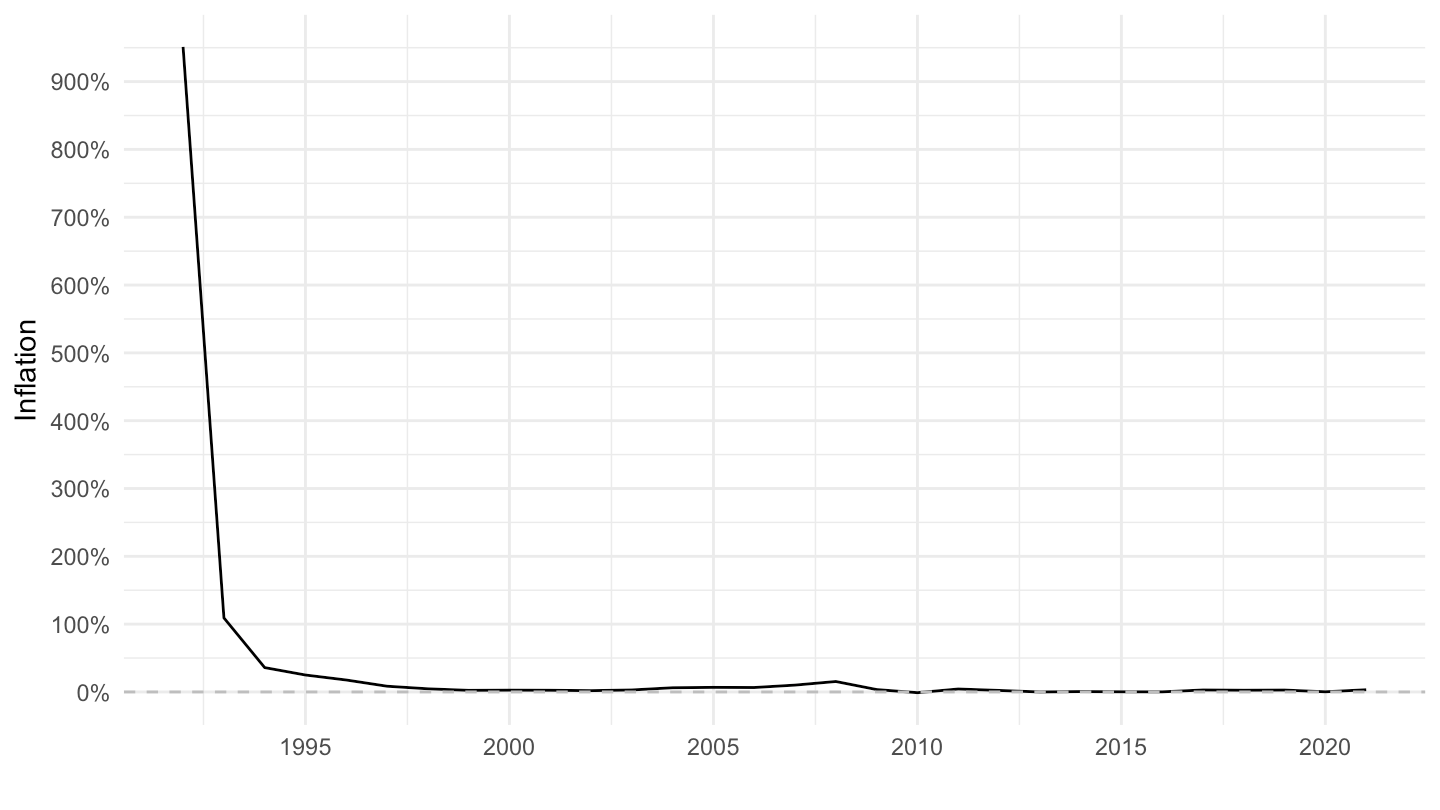
LONG_CPI |>
  filter(REF_AREA == "MK",
         UNIT_MEASURE == 771,
         FREQ == "A") |>
  year_to_date() |>
  ggplot() + geom_line() + theme_minimal() +
  aes(x = date, y = OBS_VALUE/100) + xlab("") + ylab("Inflation") +
  scale_x_date(breaks = seq(1900, 2100, 5) |> paste0("-01-01") |> as.Date(),
               labels = date_format("%Y")) +
  scale_y_continuous(breaks = 0.01*seq(-100, 10000, 100),
                     labels = percent_format(a = 1)) +
  geom_hline(yintercept = 0, linetype = "dashed", color = "grey")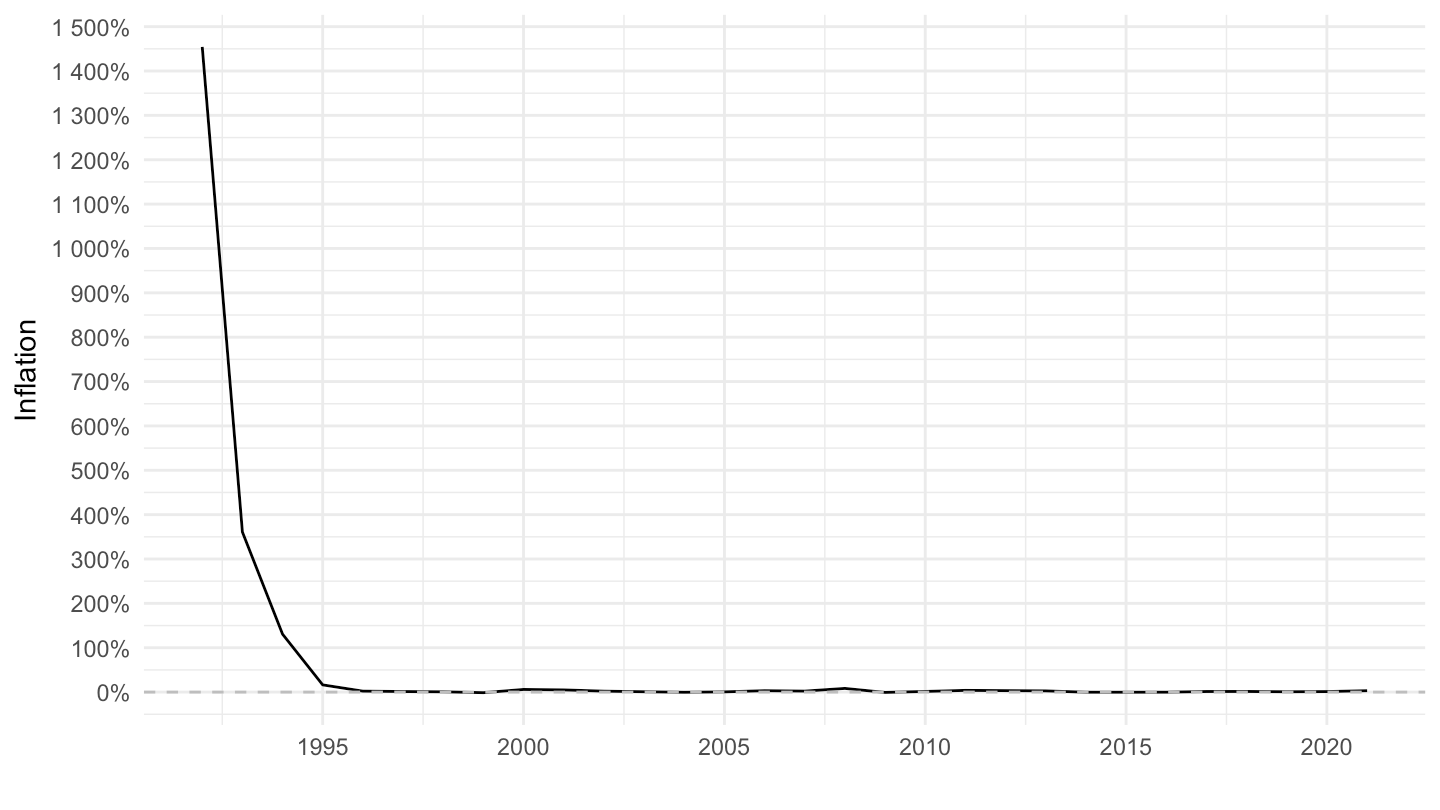
LONG_CPI |>
  filter(REF_AREA == "HU",
         UNIT_MEASURE == 771,
         FREQ == "A") |>
  year_to_date() |>
  ggplot() + geom_line() + theme_minimal() +
  aes(x = date, y = OBS_VALUE/100) + xlab("") + ylab("Inflation") +
  scale_x_date(breaks = seq(1900, 2100, 5) |> paste0("-01-01") |> as.Date(),
               labels = date_format("%Y")) +
  scale_y_continuous(breaks = 0.01*seq(-100, 10000, 2),
                     labels = percent_format(a = 1)) +
  geom_hline(yintercept = 0, linetype = "dashed", color = "grey")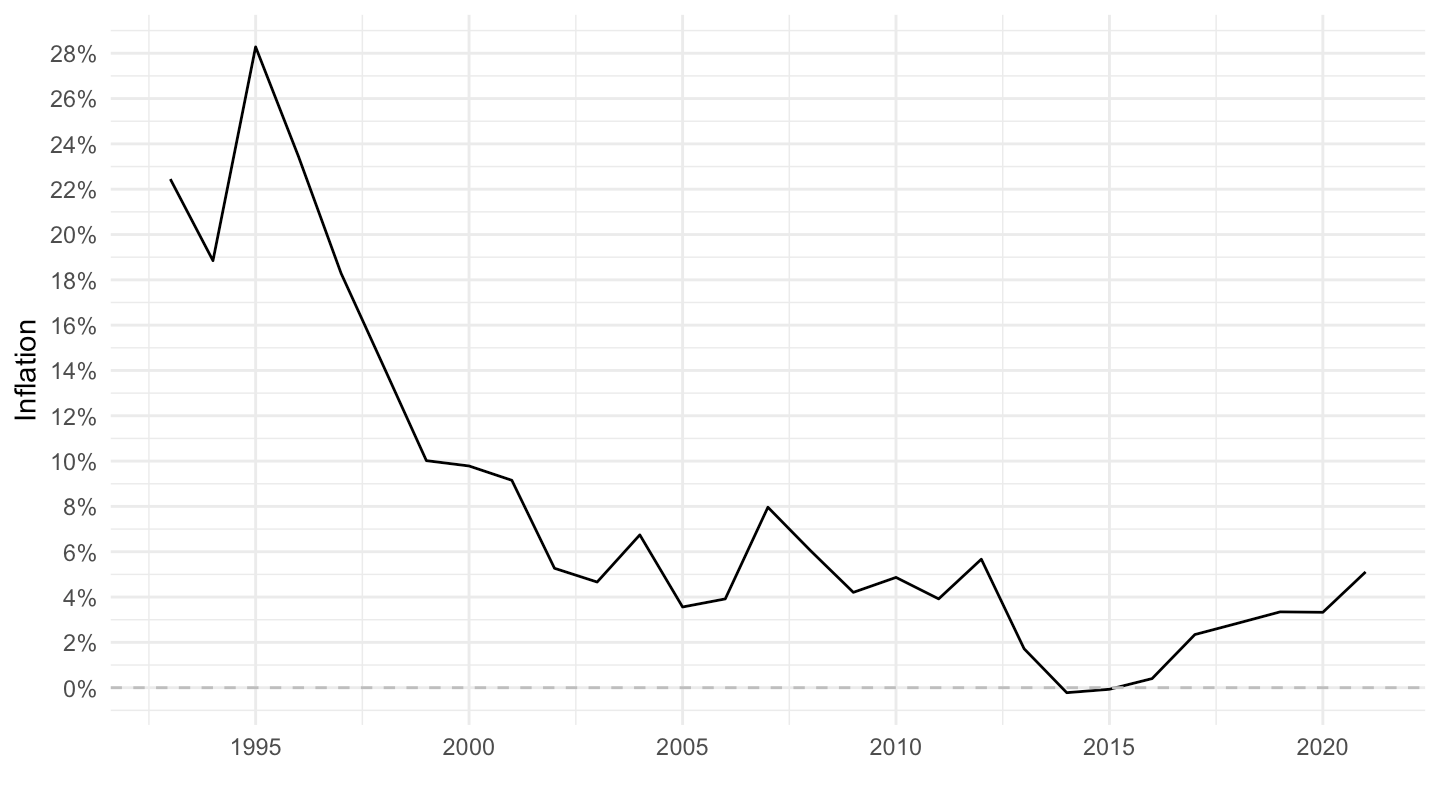
LONG_CPI |>
  filter(REF_AREA == "HR",
         UNIT_MEASURE == 771,
         FREQ == "A") |>
  year_to_date() |>
  ggplot() + geom_line() + theme_minimal() +
  aes(x = date, y = OBS_VALUE/100) + xlab("") + ylab("Inflation") +
  scale_x_date(breaks = seq(1900, 2100, 5) |> paste0("-01-01") |> as.Date(),
               labels = date_format("%Y")) +
  scale_y_continuous(breaks = 0.01*seq(-100, 10000, 100),
                     labels = percent_format(a = 1)) +
  geom_hline(yintercept = 0, linetype = "dashed", color = "grey")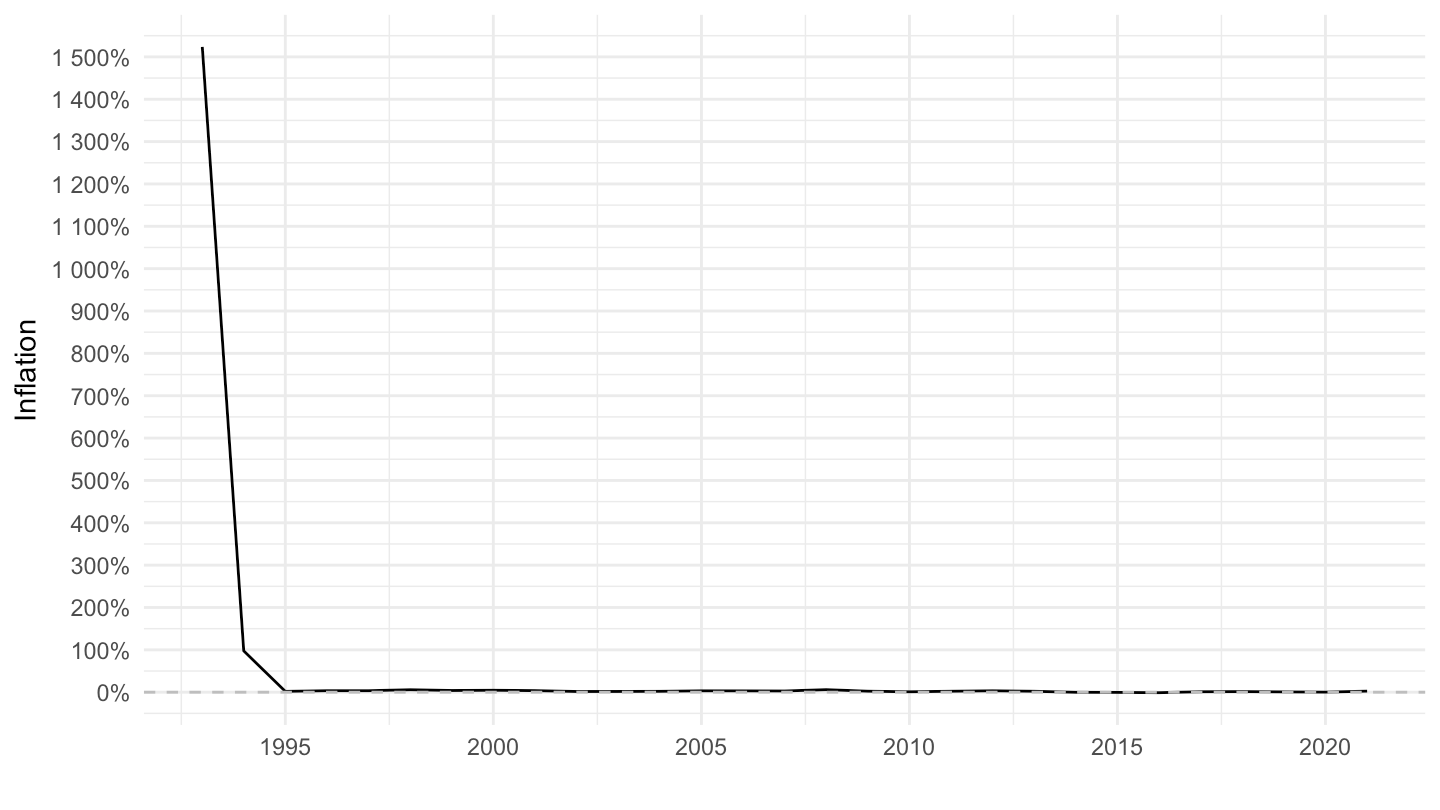
LONG_CPI |>
  filter(REF_AREA == "SI",
         UNIT_MEASURE == 771,
         FREQ == "A") |>
  year_to_date() |>
  ggplot() + geom_line() + theme_minimal() +
  aes(x = date, y = OBS_VALUE/100) + xlab("") + ylab("Inflation") +
  scale_x_date(breaks = seq(1900, 2100, 5) |> paste0("-01-01") |> as.Date(),
               labels = date_format("%Y")) +
  scale_y_continuous(breaks = 0.01*seq(-100, 10000, 5),
                     labels = percent_format(a = 1)) +
  geom_hline(yintercept = 0, linetype = "dashed", color = "grey")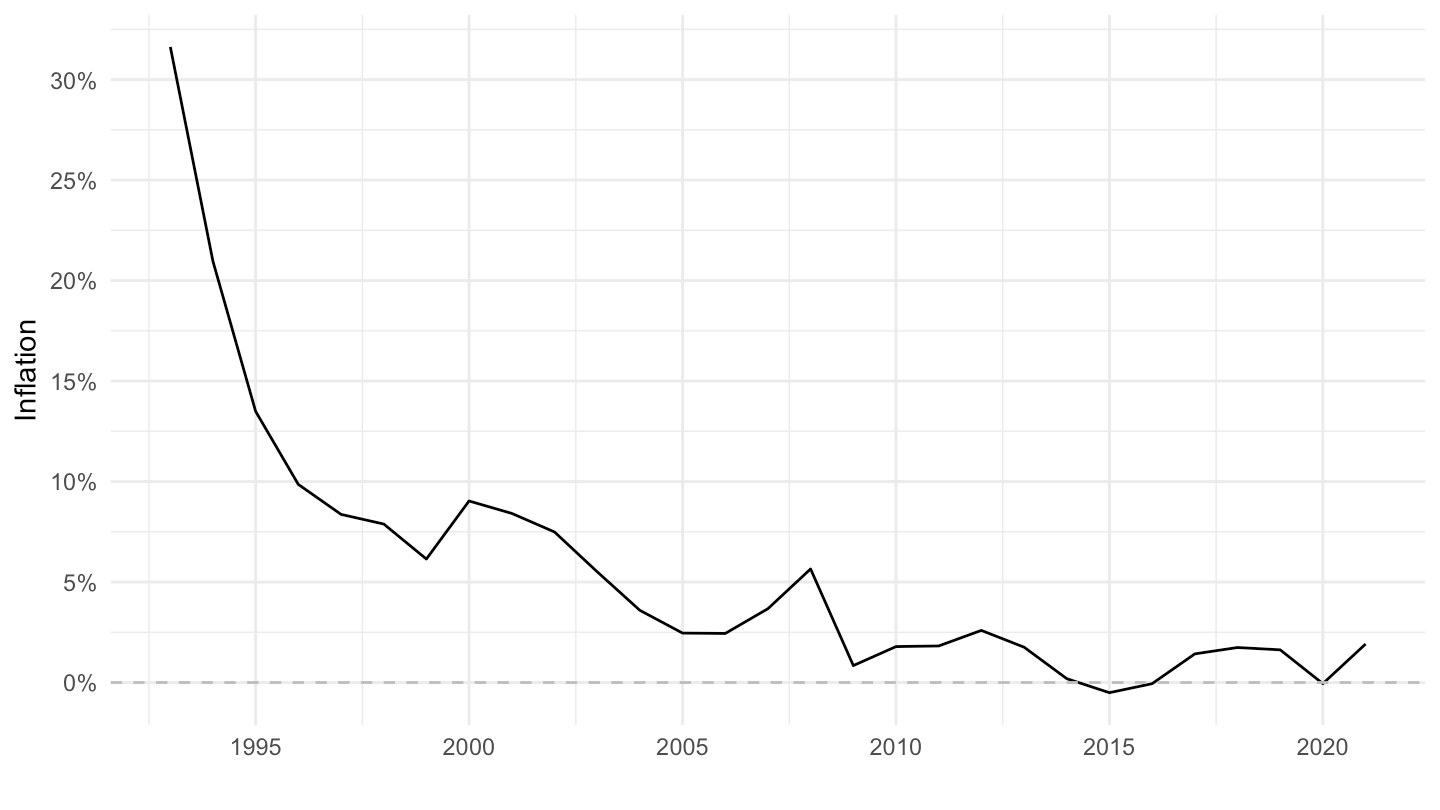
LONG_CPI |>
  filter(REF_AREA == "EE",
         UNIT_MEASURE == 771,
         FREQ == "A") |>
  year_to_date() |>
  ggplot() + geom_line() + theme_minimal() +
  aes(x = date, y = OBS_VALUE/100) + xlab("") + ylab("Inflation") +
  scale_x_date(breaks = seq(1900, 2100, 5) |> paste0("-01-01") |> as.Date(),
               labels = date_format("%Y")) +
  scale_y_continuous(breaks = 0.01*seq(-100, 10000, 5),
                     labels = percent_format(a = 1)) +
  geom_hline(yintercept = 0, linetype = "dashed", color = "grey")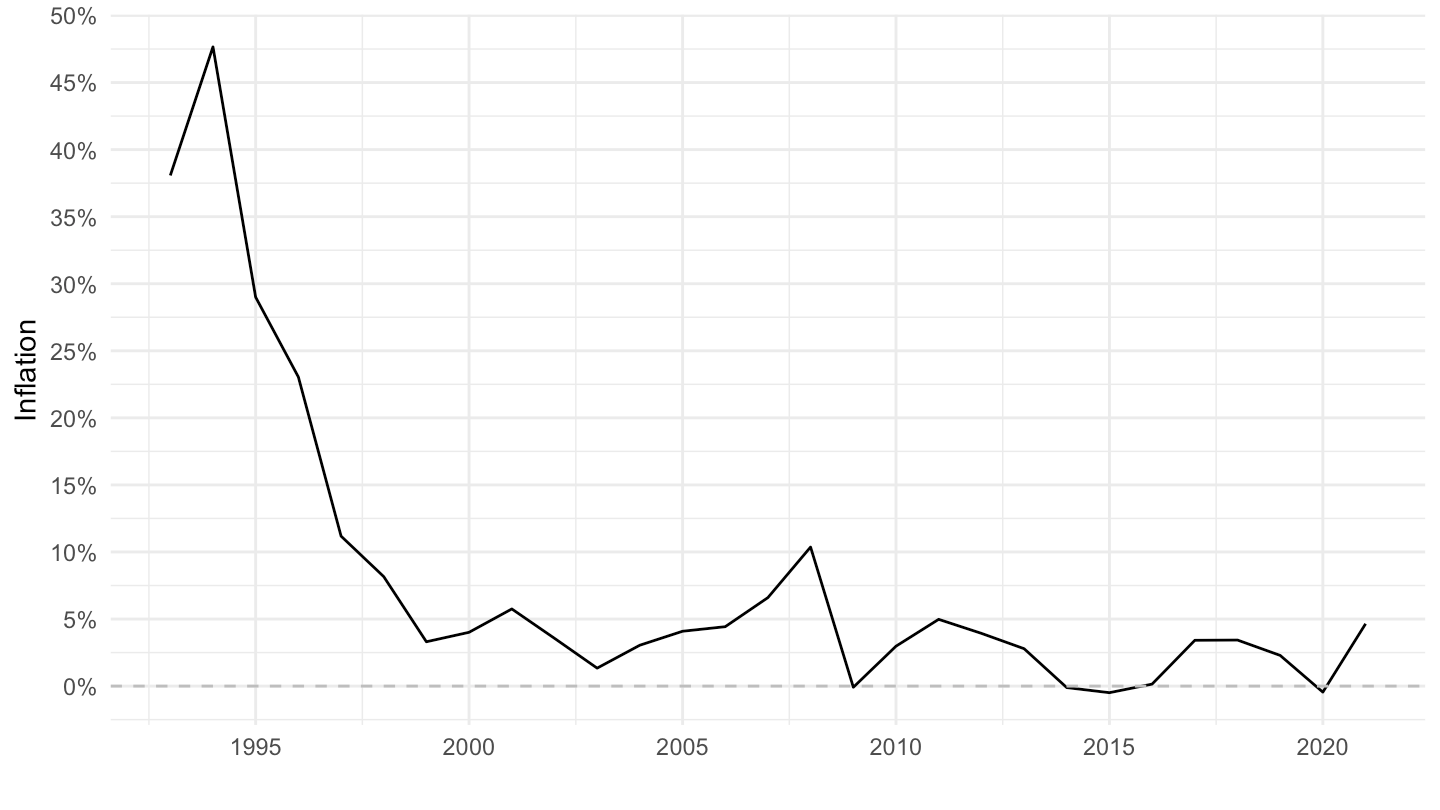
LONG_CPI |>
  filter(REF_AREA == "CN",
         UNIT_MEASURE == 771,
         FREQ == "A") |>
  year_to_date() |>
  ggplot() + geom_line() + theme_minimal() +
  aes(x = date, y = OBS_VALUE/100) + xlab("") + ylab("Inflation") +
  scale_x_date(breaks = seq(1900, 2100, 5) |> paste0("-01-01") |> as.Date(),
               labels = date_format("%Y")) +
  scale_y_continuous(breaks = 0.01*seq(-100, 10000, 5),
                     labels = percent_format(a = 1)) +
  geom_hline(yintercept = 0, linetype = "dashed", color = "grey")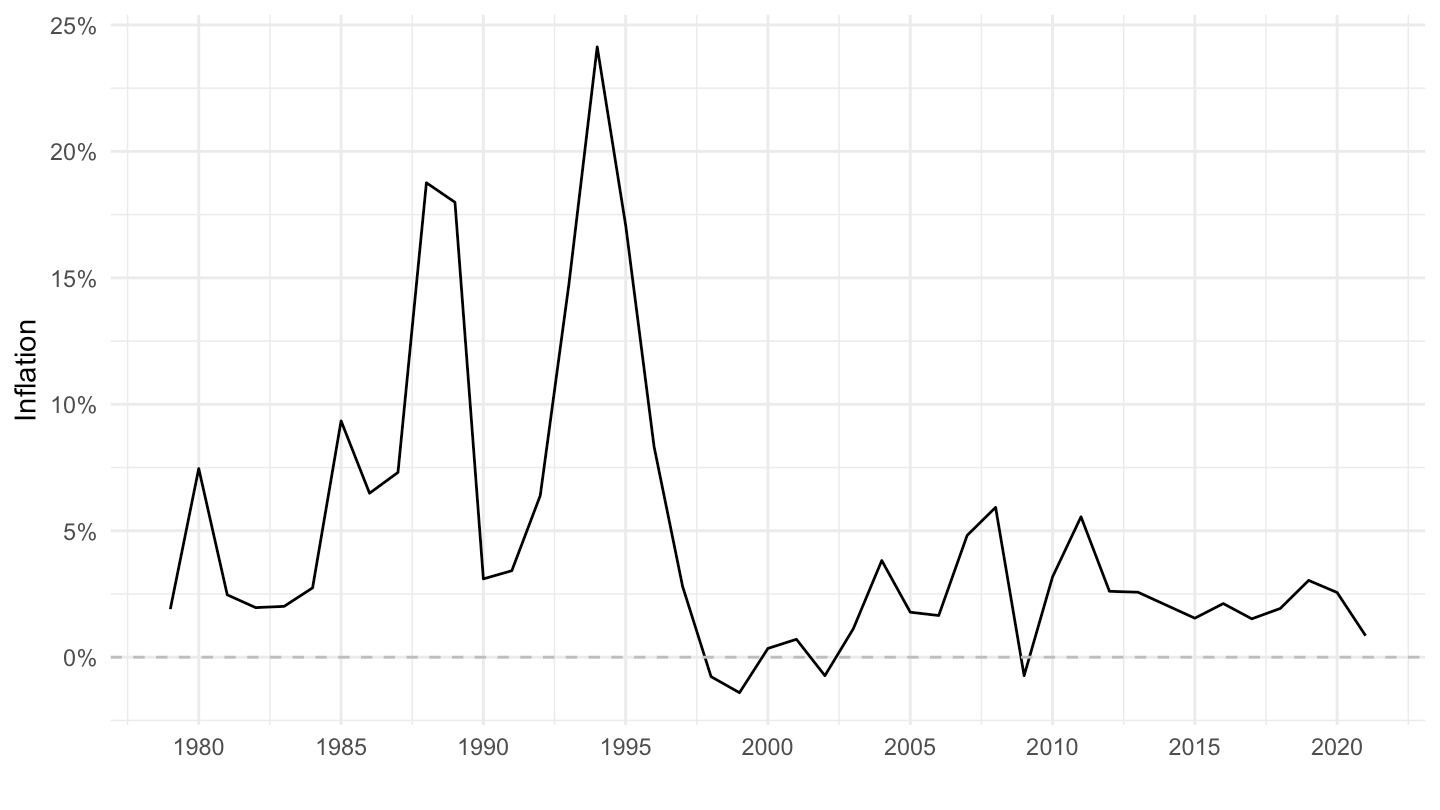
LONG_CPI |>
  filter(REF_AREA == "RS",
         UNIT_MEASURE == 771,
         FREQ == "A") |>
  year_to_date() |>
  ggplot() + geom_line() + theme_minimal() +
  aes(x = date, y = OBS_VALUE/100) + xlab("") + ylab("Inflation") +
  scale_x_date(breaks = seq(1900, 2100, 5) |> paste0("-01-01") |> as.Date(),
               labels = date_format("%Y")) +
  scale_y_continuous(labels = percent_format(a = 1)) +
  geom_hline(yintercept = 0, linetype = "dashed", color = "grey")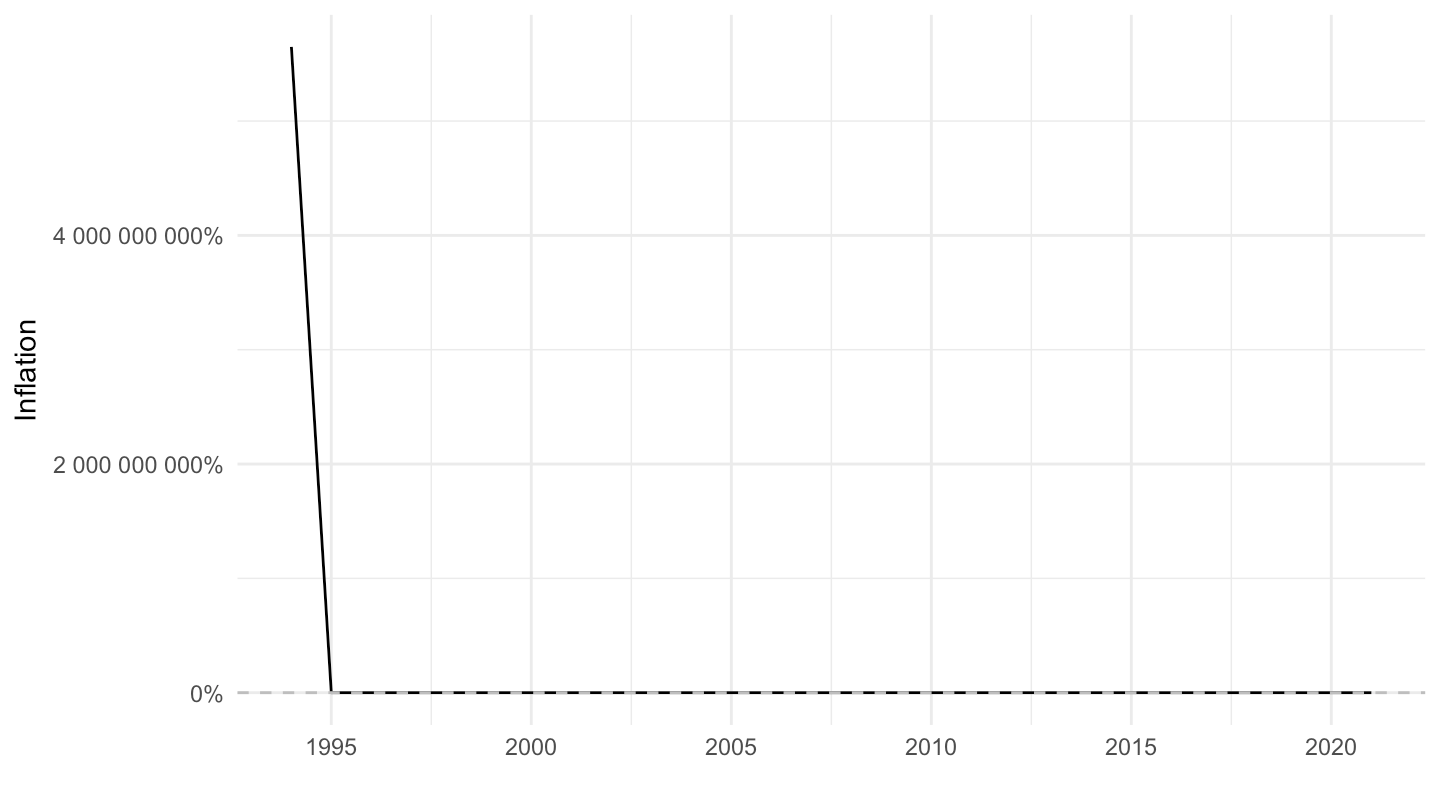
LONG_CPI |>
  filter(REF_AREA == "DZ",
         UNIT_MEASURE == 771,
         FREQ == "A") |>
  year_to_date() |>
  ggplot() + geom_line() + theme_minimal() +
  aes(x = date, y = OBS_VALUE/100) + xlab("") + ylab("Inflation") +
  scale_x_date(breaks = seq(1900, 2100, 5) |> paste0("-01-01") |> as.Date(),
               labels = date_format("%Y")) +
  scale_y_continuous(breaks = 0.01*seq(-100, 10000, 5),
                     labels = percent_format(a = 1)) +
  geom_hline(yintercept = 0, linetype = "dashed", color = "grey")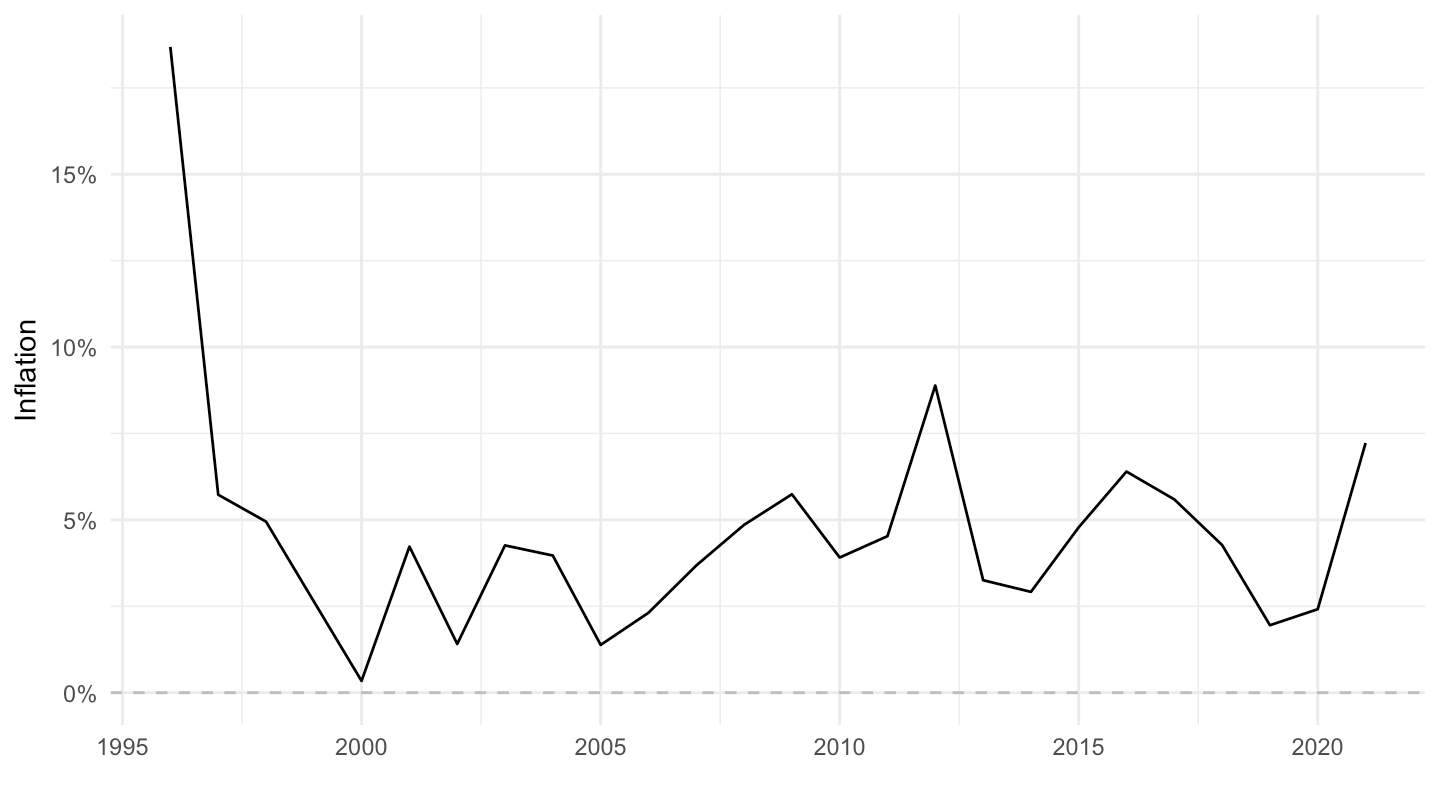
LONG_CPI |>
  filter(REF_AREA == "RU",
         UNIT_MEASURE == 771,
         FREQ == "A") |>
  year_to_date() |>
  ggplot() + geom_line() + theme_minimal() +
  aes(x = date, y = OBS_VALUE/100) + xlab("") + ylab("Inflation") +
  scale_x_date(breaks = seq(1900, 2100, 5) |> paste0("-01-01") |> as.Date(),
               labels = date_format("%Y")) +
  scale_y_continuous(breaks = 0.01*seq(-100, 10000, 2),
                     labels = percent_format(a = 1)) +
  geom_hline(yintercept = 0, linetype = "dashed", color = "grey")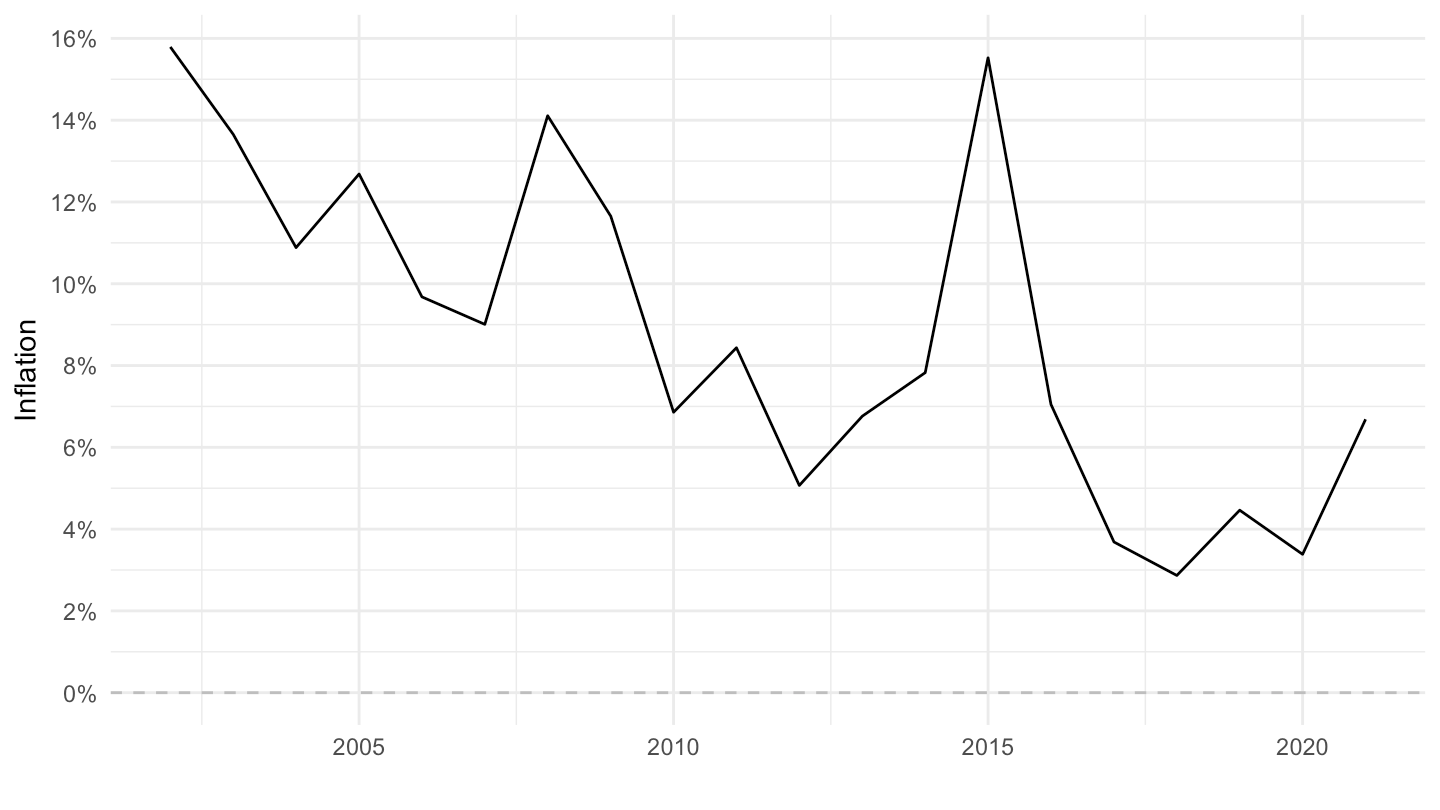
LONG_CPI |>
  filter(REF_AREA == "AE",
         UNIT_MEASURE == 771,
         FREQ == "A") |>
  year_to_date() |>
  ggplot() + geom_line() + theme_minimal() +
  aes(x = date, y = OBS_VALUE/100) + xlab("") + ylab("Inflation") +
  scale_x_date(breaks = seq(1900, 2100, 5) |> paste0("-01-01") |> as.Date(),
               labels = date_format("%Y")) +
  scale_y_continuous(breaks = 0.01*seq(-100, 10000, 2),
                     labels = percent_format(a = 1)) +
  geom_hline(yintercept = 0, linetype = "dashed", color = "grey")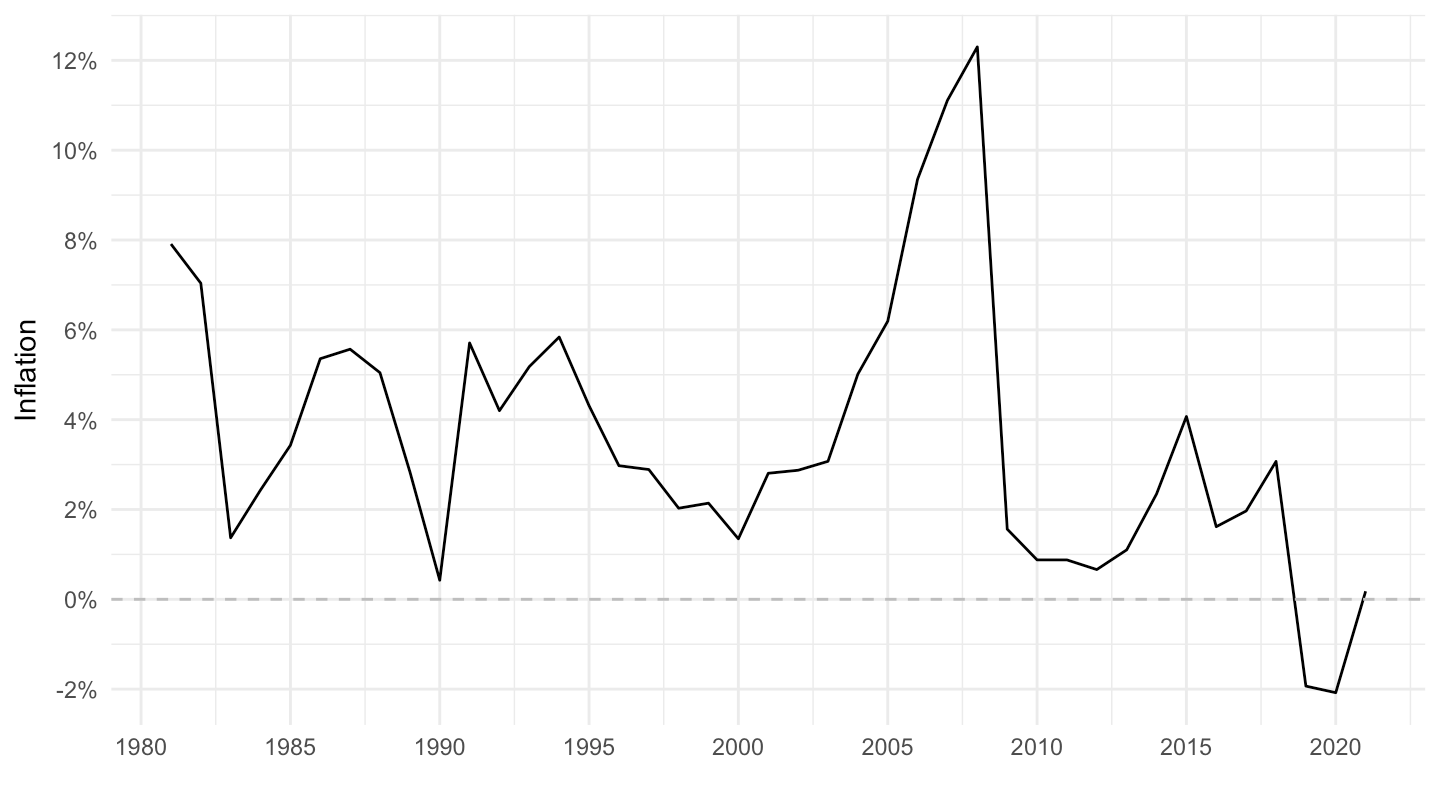
LONG_CPI |>
  filter(REF_AREA %in% c("AR"),
         UNIT_MEASURE == 628,
         FREQ == "A") |>
  year_to_date() |>
  ggplot() + geom_line(aes(x = date, y = OBS_VALUE)) +
  theme_minimal() + xlab("") + ylab("CPI (Index)") +
  scale_x_date(breaks = seq(1900, 2100, 10) |> paste0("-01-01") |> as.Date(),
               labels = date_format("%Y")) +
  scale_y_log10(breaks = seq(0, 200, 10),
                     labels = dollar_format(a = 1, p = "")) +
  scale_color_manual(values = viridis(5)[1:4]) +
  theme(legend.position = c(0.2, 0.80),
        legend.title = element_blank()) +
  geom_vline(xintercept = as.Date("2013-03-01"), linetype = "dashed", color = viridis(3)[2])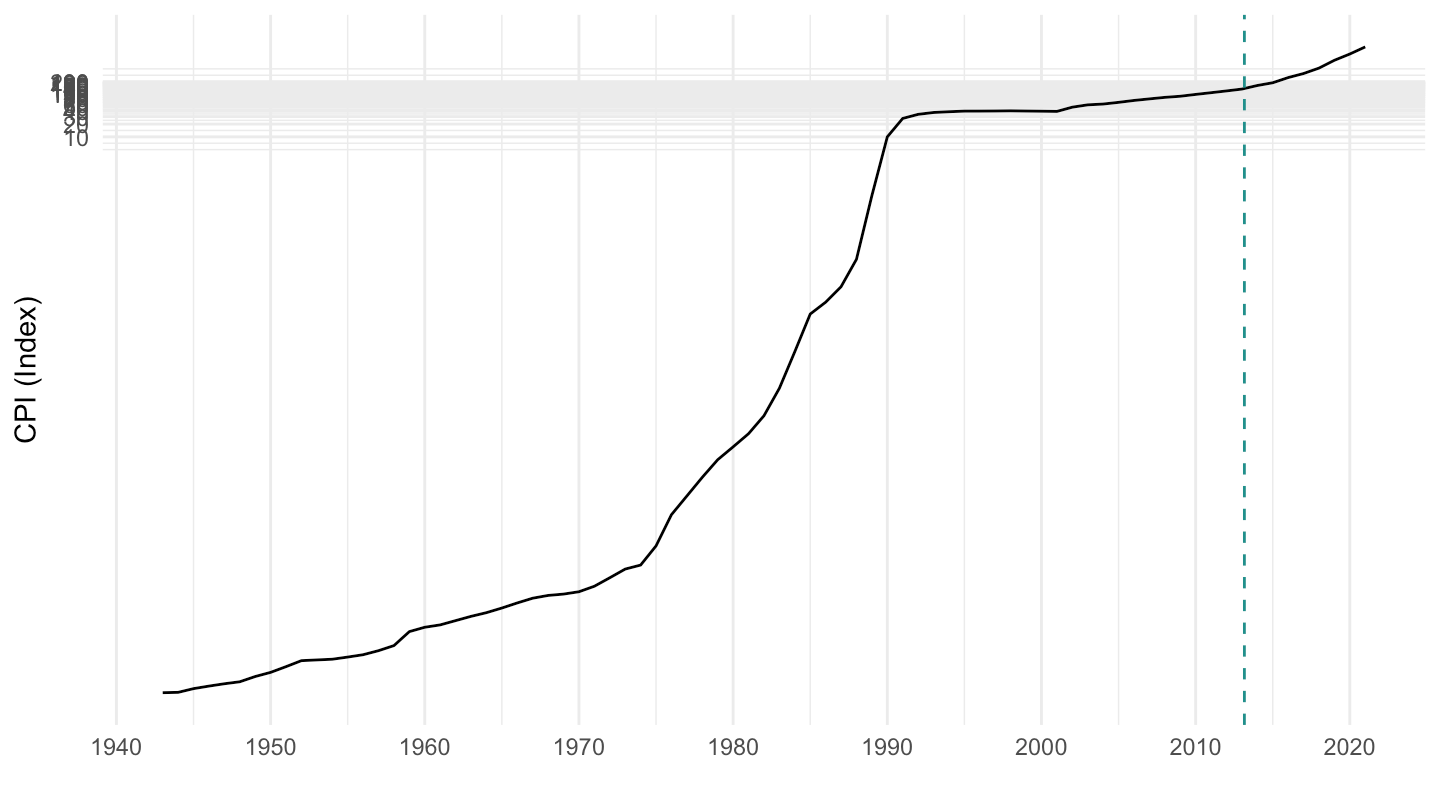
LONG_CPI |>
  filter(REF_AREA %in% c("AR"),
         UNIT_MEASURE == 628,
         FREQ == "A") |>
  filter() |>
  year_to_date() |>
  filter(date >= as.Date("1990-01-01")) |>
  ggplot() + geom_line(aes(x = date, y = OBS_VALUE)) +
  theme_minimal() + xlab("") + ylab("CPI (Index)") +
  scale_x_date(breaks = seq(1900, 2100, 5) |> paste0("-01-01") |> as.Date(),
               labels = date_format("%Y")) +
  scale_y_log10(breaks = seq(0, 200, 2),
                     labels = dollar_format(a = 1, p = "")) +
  scale_color_manual(values = viridis(3)[1:2]) +
  theme(legend.position = c(0.2, 0.80),
        legend.title = element_blank()) +
  geom_vline(xintercept = as.Date("2013-03-01"), linetype = "dashed", color = viridis(3)[2])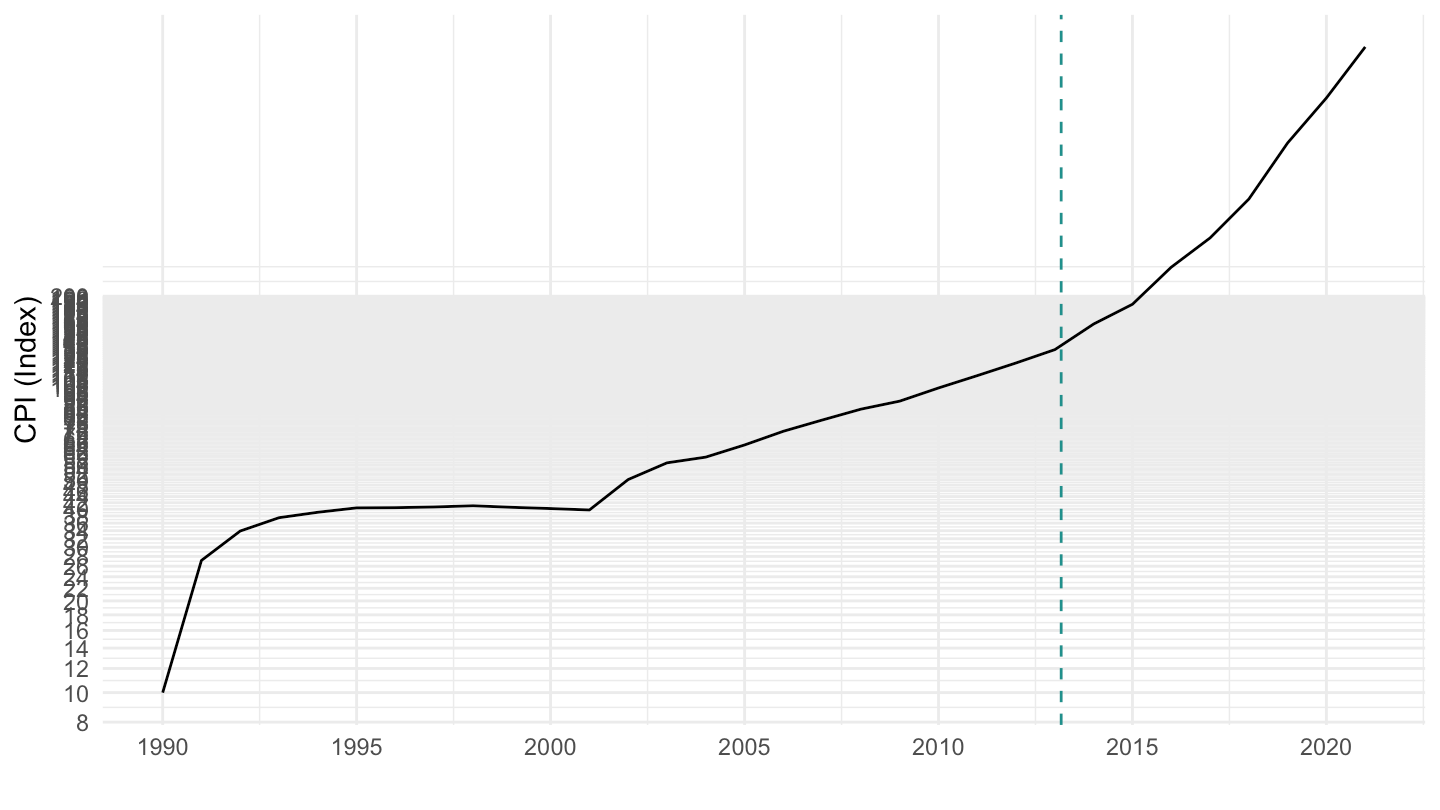
LONG_CPI |>
  filter(REF_AREA %in% c("AR"),
         UNIT_MEASURE == 628,
         FREQ == "A") |>
  year_to_date() |>
  filter(date >= as.Date("1990-01-01") & date <= as.Date("2005-01-01")) |>
  ggplot() + geom_line(aes(x = date, y = OBS_VALUE)) +
  theme_minimal() + xlab("") + ylab("CPI (Index)") +
  scale_x_date(breaks = seq(1900, 2100, 2) |> paste0("-01-01") |> as.Date(),
               labels = date_format("%Y")) +
  scale_y_log10(breaks = seq(0, 200, 10),
                     labels = dollar_format(a = 1, p = "")) +
  scale_color_manual(values = viridis(3)[1:2]) +
  theme(legend.position = c(0.2, 0.80),
        legend.title = element_blank()) +
  geom_vline(xintercept = as.Date("2013-03-01"), linetype = "dashed", color = viridis(3)[2])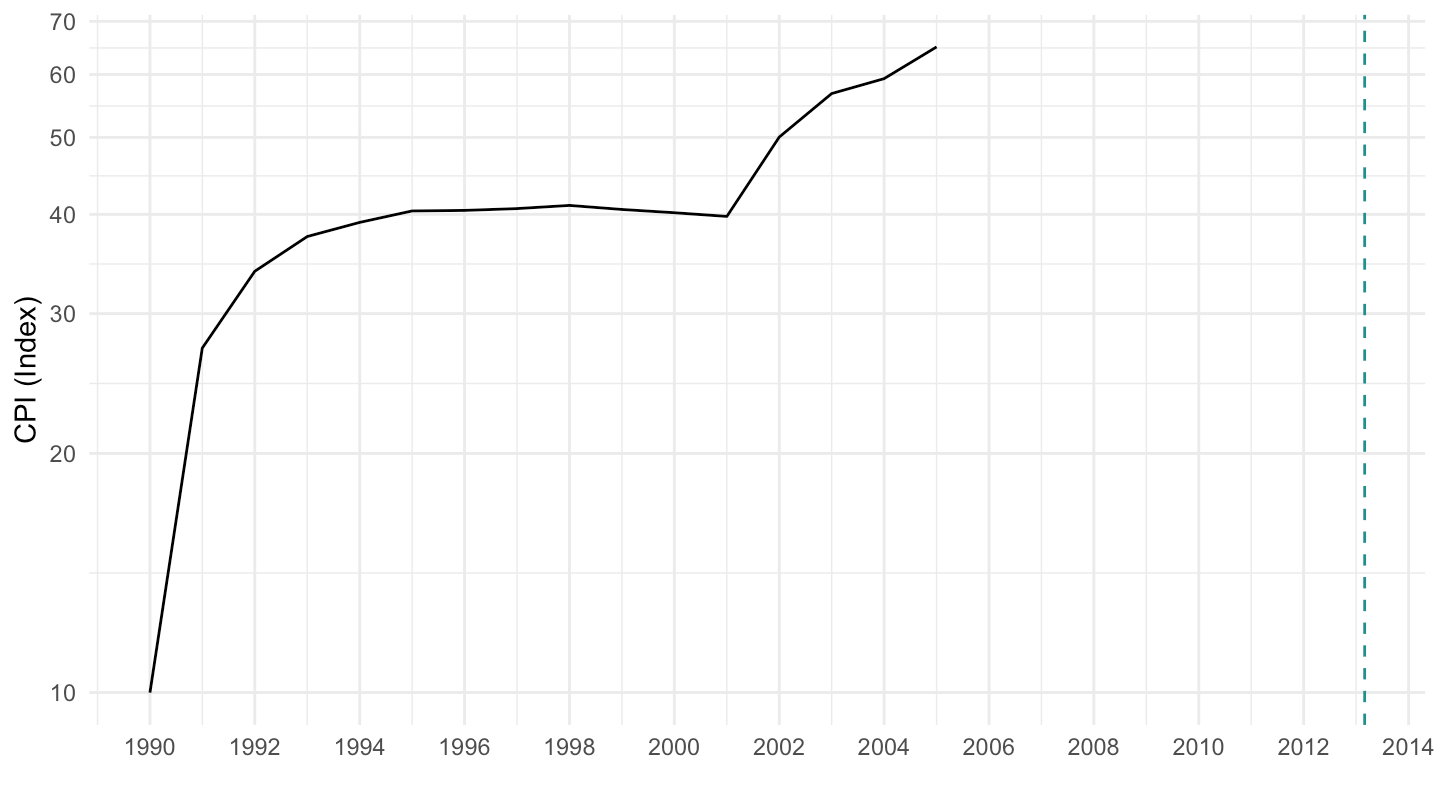
LONG_CPI |>
  filter(REF_AREA %in% c("AR"),
         UNIT_MEASURE == 628,
         FREQ == "A") |>
  year_to_date() |>
  filter(date >= as.Date("1993-01-01") & date <= as.Date("2005-01-01")) |>
  ggplot() + geom_line(aes(x = date, y = OBS_VALUE)) +
  theme_minimal() + xlab("") + ylab("CPI (Index)") +
  scale_x_date(breaks = seq(1900, 2100, 1) |> paste0("-01-01") |> as.Date(),
               labels = date_format("%Y")) +
  scale_y_log10(breaks = seq(0, 200, 5),
                     labels = dollar_format(a = 1, p = "")) +
  scale_color_manual(values = viridis(3)[1:2]) +
  theme(legend.position = c(0.2, 0.80),
        legend.title = element_blank()) +
  geom_vline(xintercept = as.Date("2013-03-01"), linetype = "dashed", color = viridis(3)[2])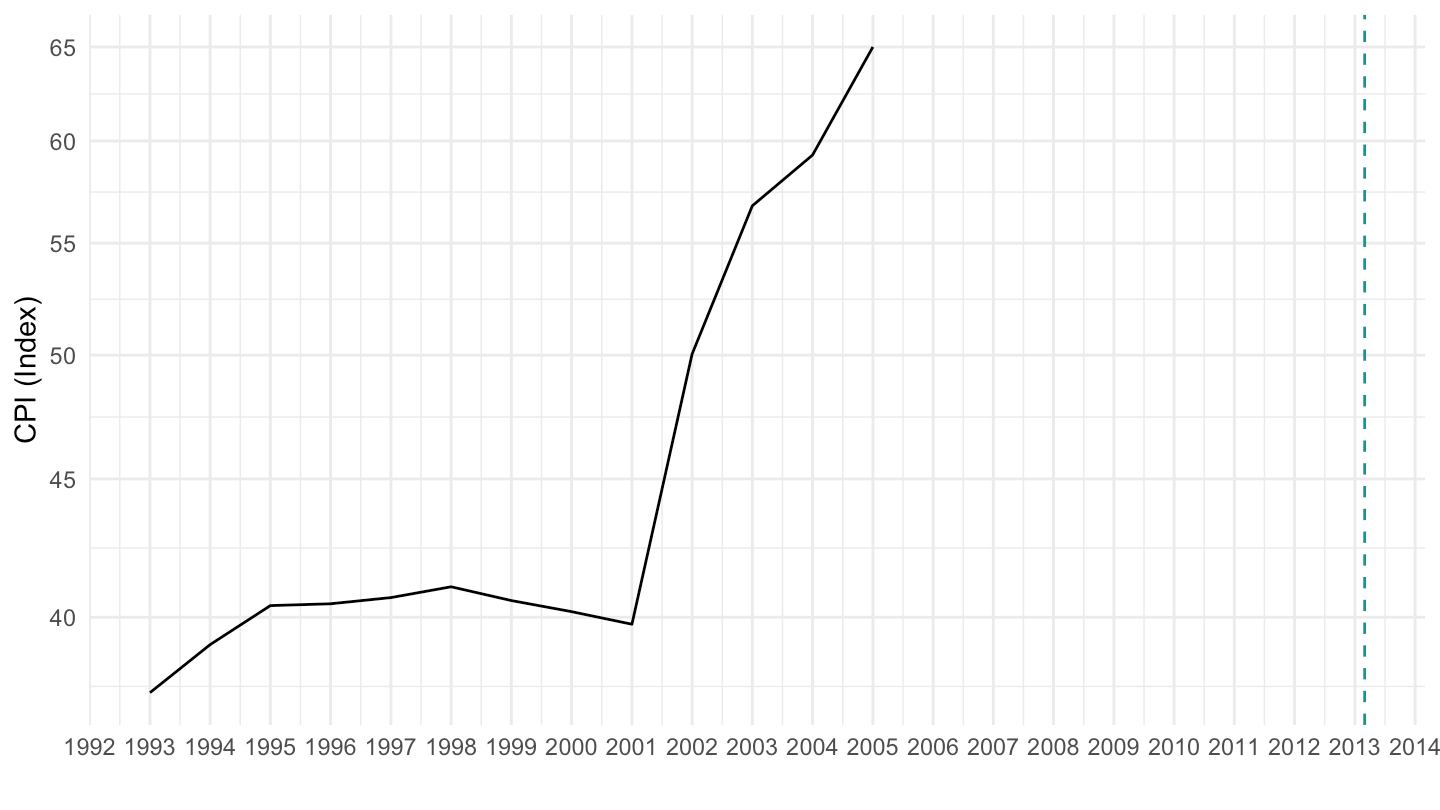
LONG_CPI |>
  filter(REF_AREA %in% c("AR"),
         UNIT_MEASURE == 628,
         FREQ == "A") |>
  filter() |>
  year_to_date() |>
  filter(date >= as.Date("1980-01-01")) |>
  ggplot() + geom_line(aes(x = date, y = OBS_VALUE)) +
  theme_minimal() + xlab("") + ylab("CPI (Index)") +
  scale_x_date(breaks = seq(1900, 2100, 5) |> paste0("-01-01") |> as.Date(),
               labels = date_format("%Y")) +
  scale_y_log10(breaks = seq(0, 200, 2),
                     labels = dollar_format(a = 1, p = "")) +
  scale_color_manual(values = viridis(3)[1:2]) +
  theme(legend.position = c(0.2, 0.80),
        legend.title = element_blank()) +
  geom_vline(xintercept = as.Date("2013-03-01"), linetype = "dashed", color = viridis(3)[2])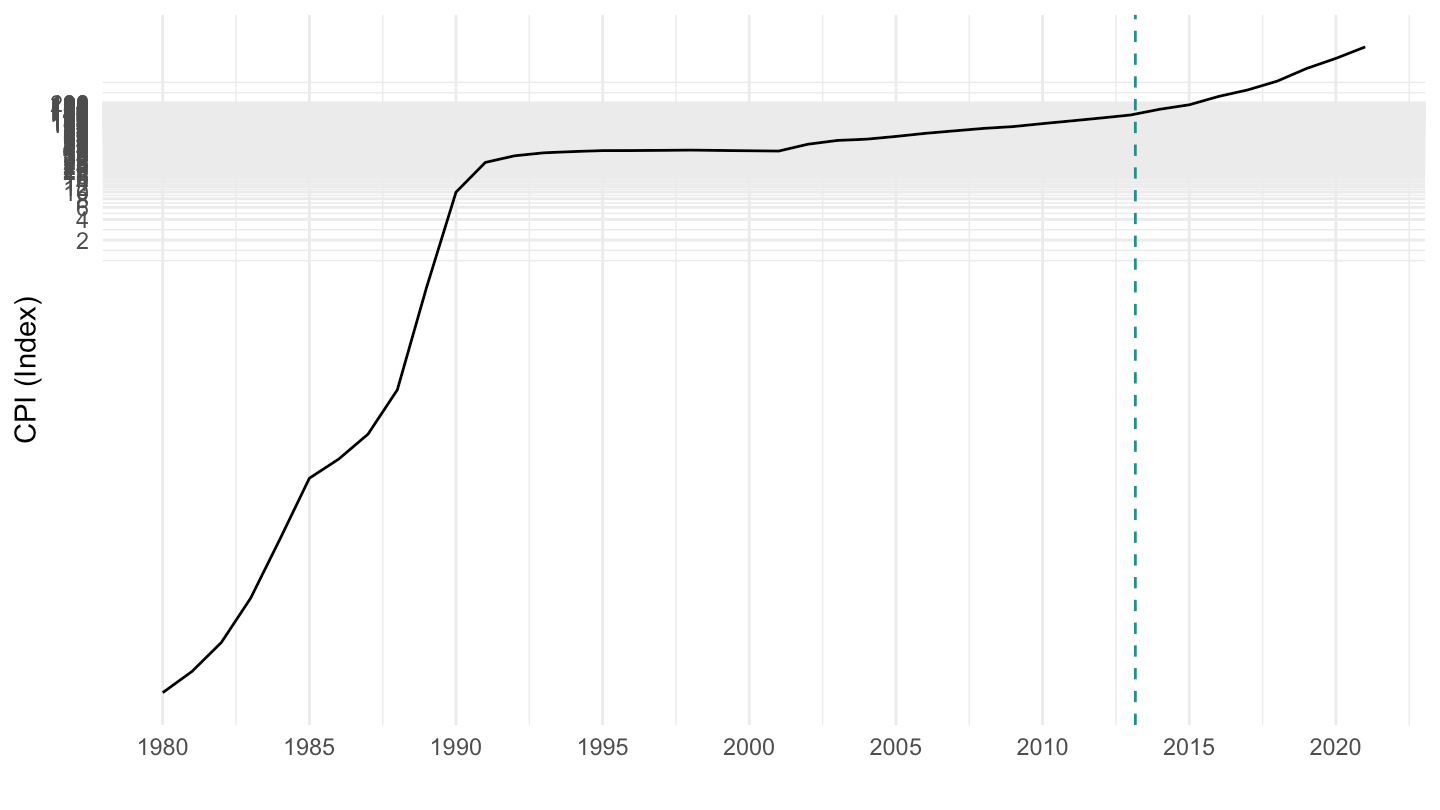
LONG_CPI |>
  filter(REF_AREA %in% c("JP"),
         UNIT_MEASURE == 628,
         FREQ == "A") |>
  year_to_date() |>
  ggplot() + geom_line(aes(x = date, y = OBS_VALUE)) +
  theme_minimal() + xlab("") + ylab("CPI (Index)") +
  scale_x_date(breaks = seq(1900, 2100, 10) |> paste0("-01-01") |> as.Date(),
               labels = date_format("%Y")) +
  scale_y_log10(breaks = seq(0, 200, 10),
                     labels = dollar_format(a = 1, p = "")) +
  scale_color_manual(values = viridis(5)[1:4]) +
  theme(legend.position = c(0.2, 0.80),
        legend.title = element_blank()) +
  geom_vline(xintercept = as.Date("2013-03-01"), linetype = "dashed", color = viridis(3)[2])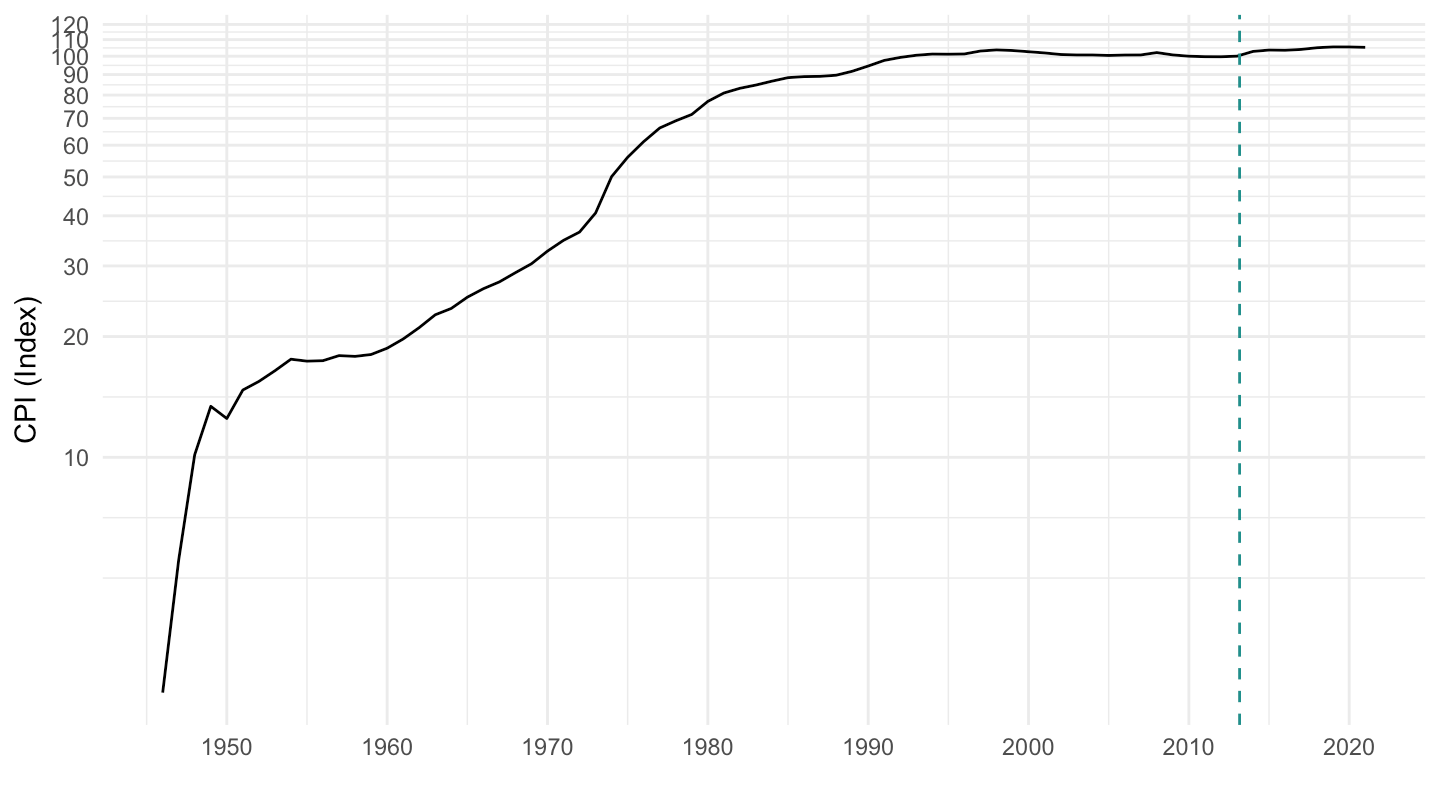
LONG_CPI |>
  filter(REF_AREA %in% c("JP"),
         UNIT_MEASURE == 628,
         FREQ == "A") |>
  year_to_date() |>
  filter(date >= as.Date("1990-01-01")) |>
  ggplot() + geom_line(aes(x = date, y = OBS_VALUE)) +
  theme_minimal() + xlab("") + ylab("CPI (Index)") +
  scale_x_date(breaks = seq(1900, 2100, 5) |> paste0("-01-01") |> as.Date(),
               labels = date_format("%Y")) +
  scale_y_log10(breaks = seq(0, 200, 2),
                     labels = dollar_format(a = 1, p = "")) +
  scale_color_manual(values = viridis(3)[1:2]) +
  theme(legend.position = c(0.2, 0.80),
        legend.title = element_blank()) +
  geom_vline(xintercept = as.Date("2013-03-01"), linetype = "dashed", color = viridis(3)[2])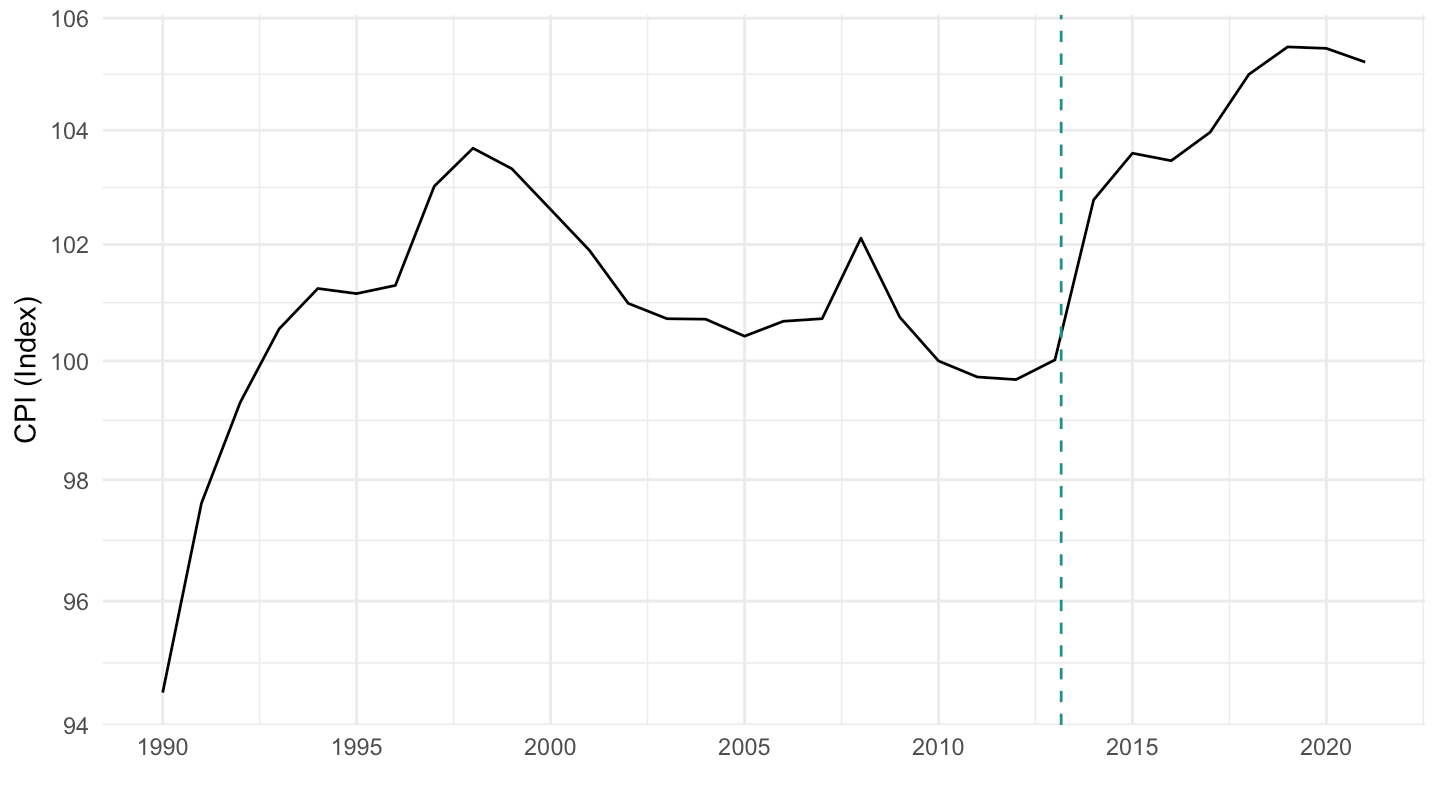
LONG_CPI |>
  filter(REF_AREA %in% c("JP"),
         UNIT_MEASURE == 628,
         FREQ == "A") |>
  year_to_date() |>
  filter(date >= as.Date("1980-01-01")) |>
  ggplot() + geom_line(aes(x = date, y = OBS_VALUE)) +
  theme_minimal() + xlab("") + ylab("CPI (Index)") +
  scale_x_date(breaks = seq(1900, 2100, 5) |> paste0("-01-01") |> as.Date(),
               labels = date_format("%Y")) +
  scale_y_log10(breaks = seq(0, 200, 2),
                     labels = dollar_format(a = 1, p = "")) +
  scale_color_manual(values = viridis(3)[1:2]) +
  theme(legend.position = c(0.2, 0.80),
        legend.title = element_blank()) +
  geom_vline(xintercept = as.Date("2013-03-01"), linetype = "dashed", color = viridis(3)[2])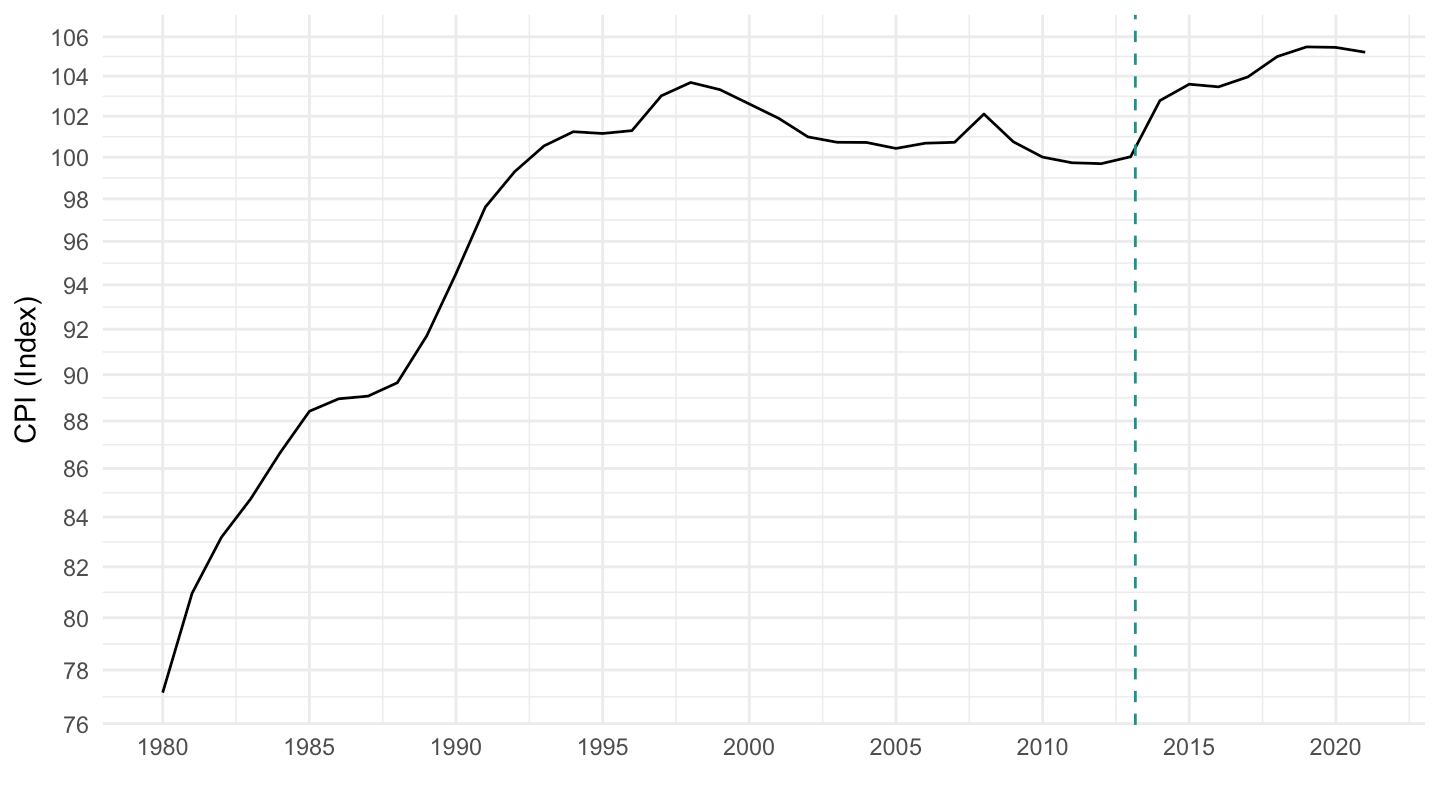
LONG_CPI |>
  filter(REF_AREA %in% c("DE", "FR", "IT", "ES"),
         UNIT_MEASURE == 628,
         FREQ == "A") |>
  year_to_date() |>
  left_join(REF_AREA, by = "REF_AREA") |>
  add_flag_color("Ref_area") |>
  ggplot() + geom_line(aes(x = date, y = OBS_VALUE, color = color)) +
  theme_minimal() + xlab("") + ylab("CPI (Index)") +
  scale_x_date(breaks = seq(1900, 2100, 10) |> paste0("-01-01") |> as.Date(),
               labels = date_format("%Y")) +
  scale_y_log10(breaks = seq(0, 200, 10),
                     labels = dollar_format(a = 1, p = "")) +
  scale_color_identity() + add_flags +
  theme(legend.position = c(0.2, 0.80),
        legend.title = element_blank())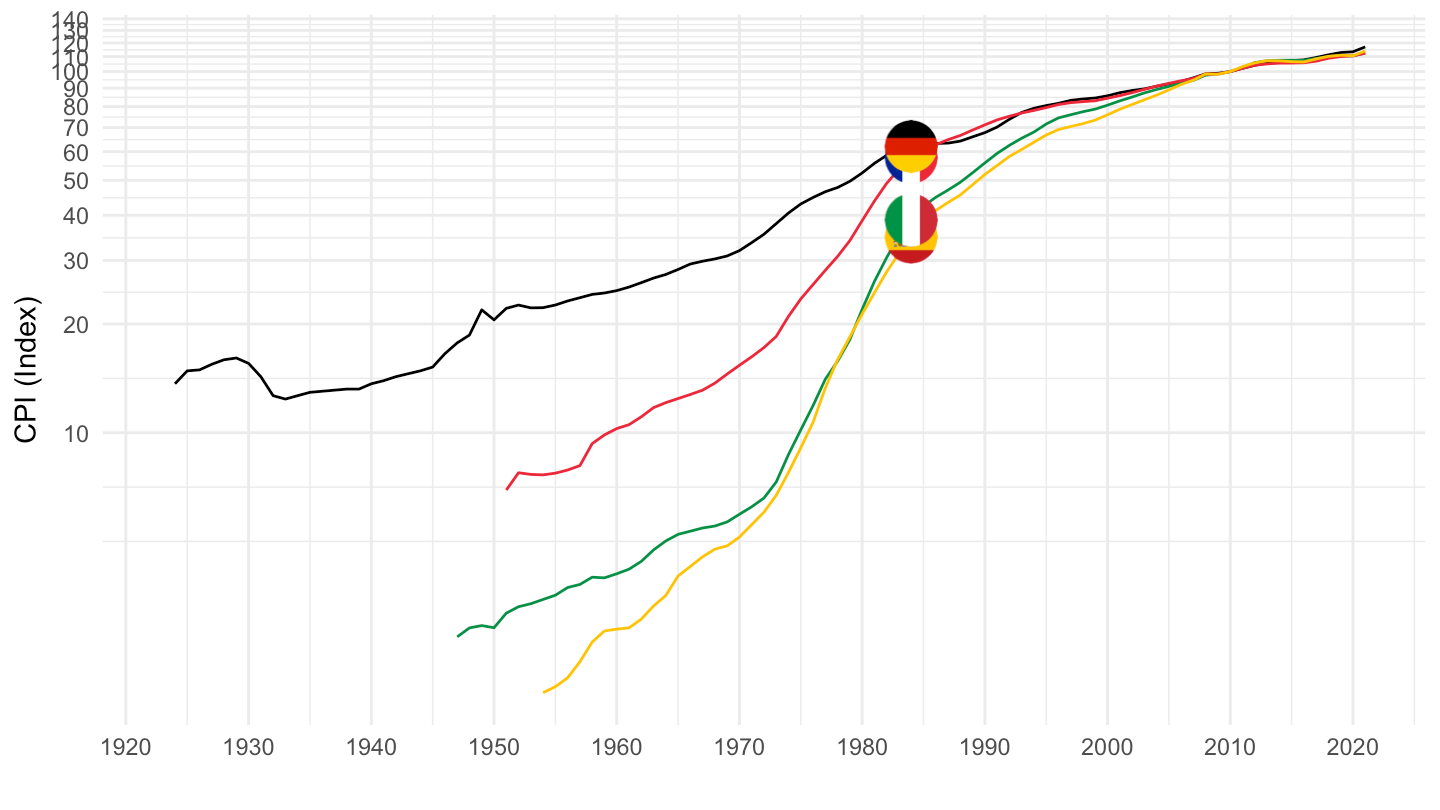
LONG_CPI |>
  filter(REF_AREA %in% c("DE", "FR", "US"),
         UNIT_MEASURE == 628,
         FREQ == "A") |>
  year_to_date() |>
  filter(date >= as.Date("1990-01-01")) |>
  group_by(REF_AREA) |>
  mutate(OBS_VALUE = 100*OBS_VALUE/OBS_VALUE[date == as.Date("1990-01-01")]) |>
  left_join(REF_AREA, by = "REF_AREA") |>
  add_flag_color("Ref_area") |>
  ggplot() + geom_line(aes(x = date, y = OBS_VALUE, color = color)) +
  theme_minimal() + xlab("") + ylab("CPI (Index)") +
  scale_x_date(breaks = seq(1900, 2100, 5) |> paste0("-01-01") |> as.Date(),
               labels = date_format("%Y")) +
  scale_y_log10(breaks = c(seq(0, 200, 10), seq(200, 1000, 20)),
                labels = dollar_format(a = 1, p = "")) +
  scale_color_identity() + add_flags +
  theme(legend.position = c(0.2, 0.80),
        legend.title = element_blank())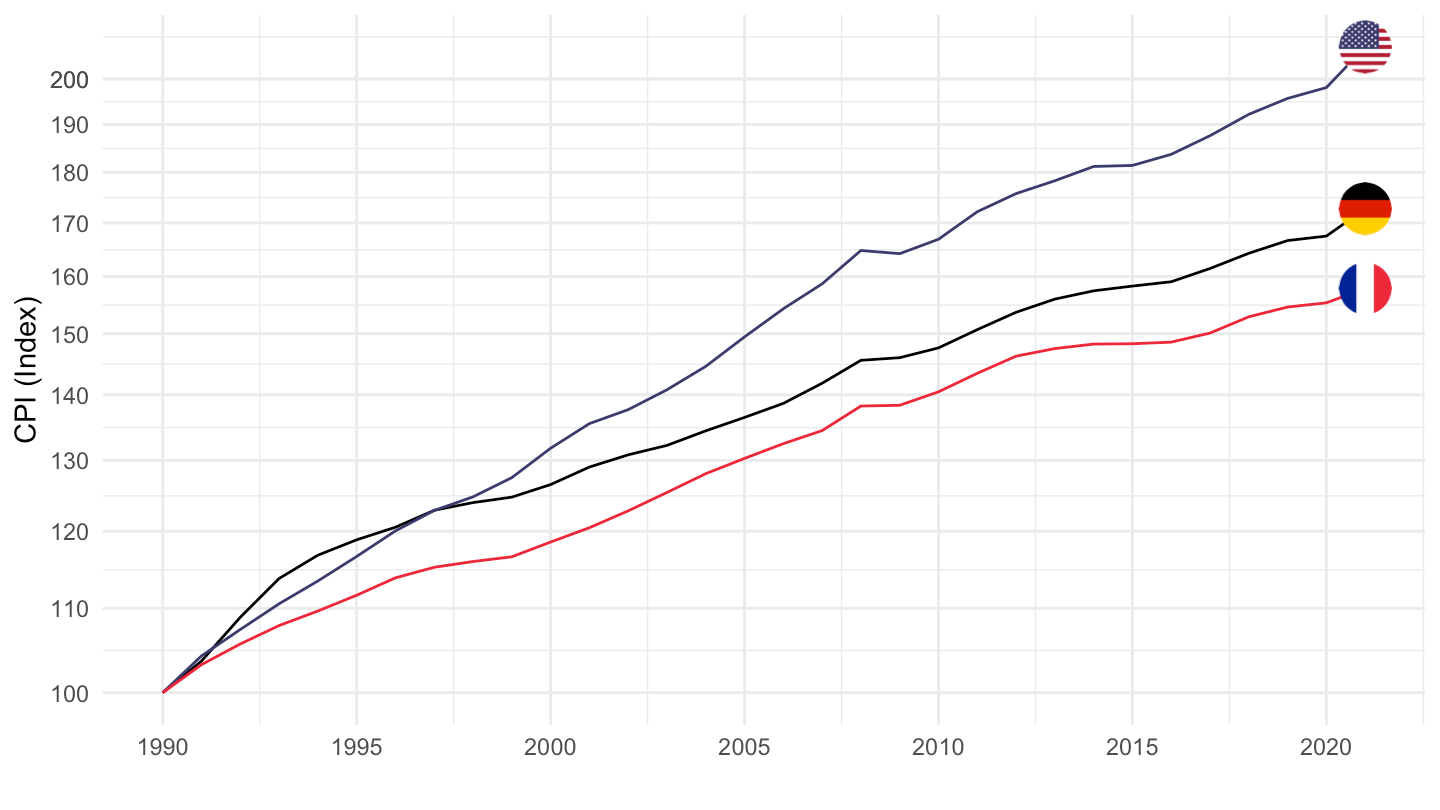
LONG_CPI |>
  filter(REF_AREA %in% c("GB", "US", "CA", "NO"),
         UNIT_MEASURE == 628,
         FREQ == "A") |>
  year_to_date() |>
  left_join(REF_AREA, by = "REF_AREA") |>
  add_flag_color("Ref_area") |>
  ggplot() + geom_line(aes(x = date, y = OBS_VALUE, color = color)) +
  theme_minimal() + xlab("") + ylab("CPI (Index)") +
  scale_x_date(breaks = seq(1600, 2100, 50) |> paste0("-01-01") |> as.Date(),
               labels = date_format("%Y")) +
  scale_y_log10(breaks = seq(0, 200, 10),
                     labels = dollar_format(accuracy = 1, prefix = "")) +
  scale_color_identity() + add_flags +
  theme(legend.position = c(0.2, 0.80),
        legend.title = element_blank())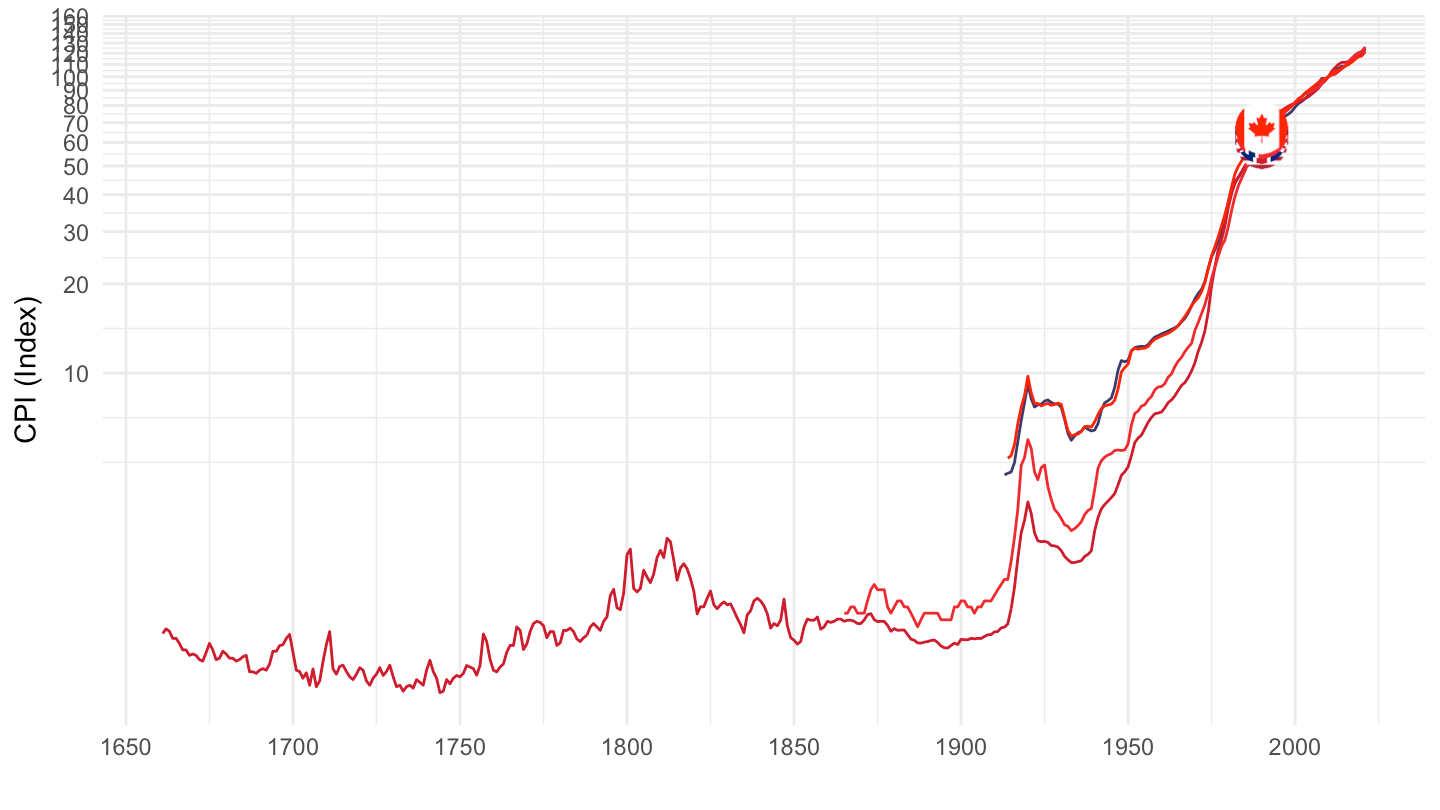
LONG_CPI |>
  filter(REF_AREA %in% c("GB", "US", "CA", "NO"),
         UNIT_MEASURE == 628,
         FREQ == "A") |>
  filter() |>
  year_to_date() |>
  filter(date >= as.Date("1910-01-01")) |>
  left_join(REF_AREA, by = "REF_AREA") |>
  add_flag_color("Ref_area") |>
  ggplot() + geom_line(aes(x = date, y = OBS_VALUE, color = color)) +
  theme_minimal() + xlab("") + ylab("CPI (Index)") +
  scale_x_date(breaks = seq(1600, 2100, 10) |> paste0("-01-01") |> as.Date(),
               labels = date_format("%Y")) +
  scale_y_log10(breaks = seq(0, 200, 10),
                labels = dollar_format(accuracy = 1, prefix = "")) +
  scale_color_identity() + add_flags +
  theme(legend.position = c(0.2, 0.80),
        legend.title = element_blank())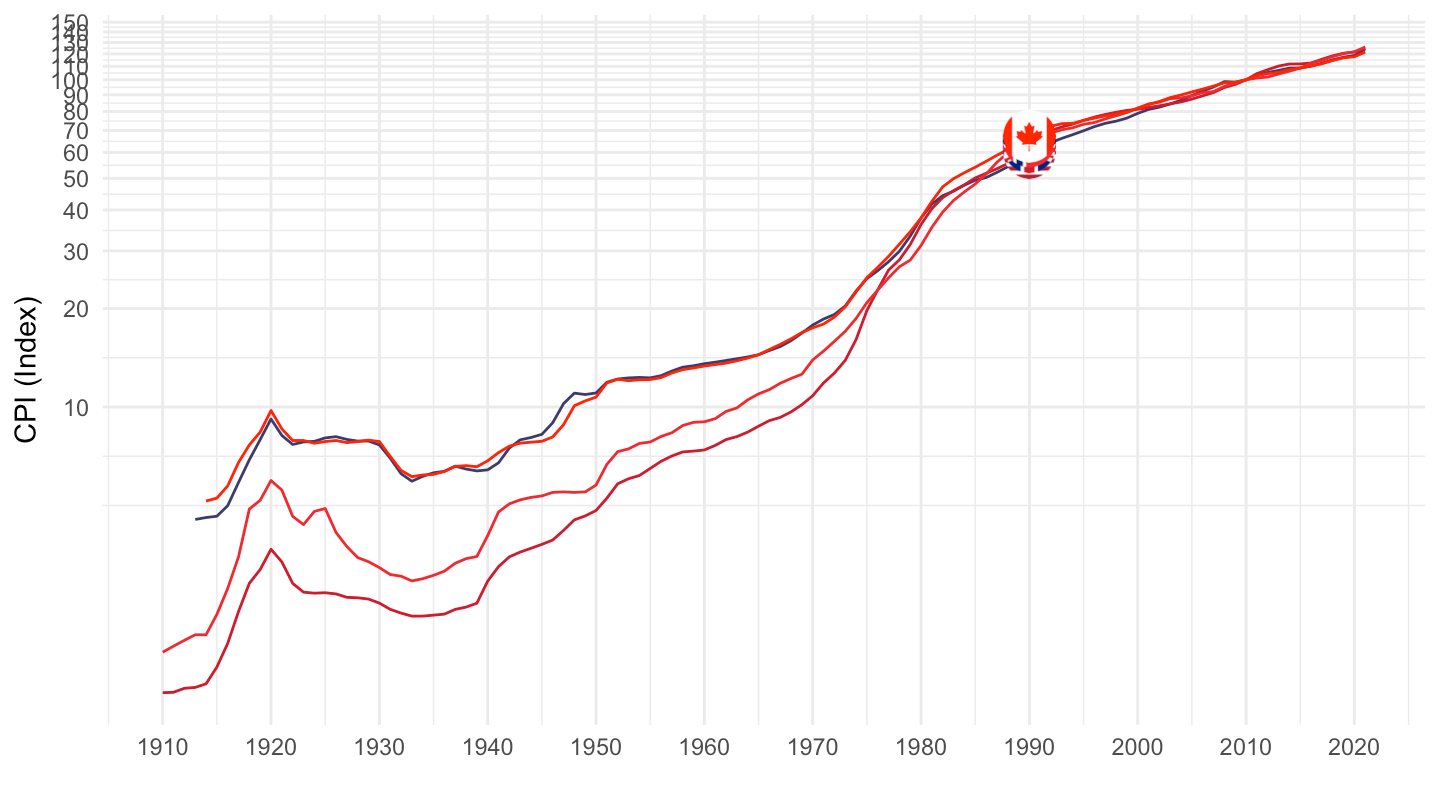
LONG_CPI |>
  filter(REF_AREA %in% c("GB", "US", "CA", "NO"),
         UNIT_MEASURE == 628,
         FREQ == "A") |>
  year_to_date() |>
  filter(date >= as.Date("1910-01-01") & date <= as.Date("1950-01-01")) |>
  left_join(REF_AREA, by = "REF_AREA") |>
  add_flag_color("Ref_area") |>
  ggplot() + geom_line(aes(x = date, y = OBS_VALUE, color = color)) +
  theme_minimal() + xlab("") + ylab("CPI (Index)") +
  scale_x_date(breaks = seq(1600, 2100, 10) |> paste0("-01-01") |> as.Date(),
               labels = date_format("%Y")) +
  scale_y_log10(breaks = seq(0, 20, 1),
                labels = dollar_format(accuracy = 1, prefix = "")) +
  scale_color_identity() + add_flags +
  theme(legend.position = c(0.1, 0.85),
        legend.title = element_blank())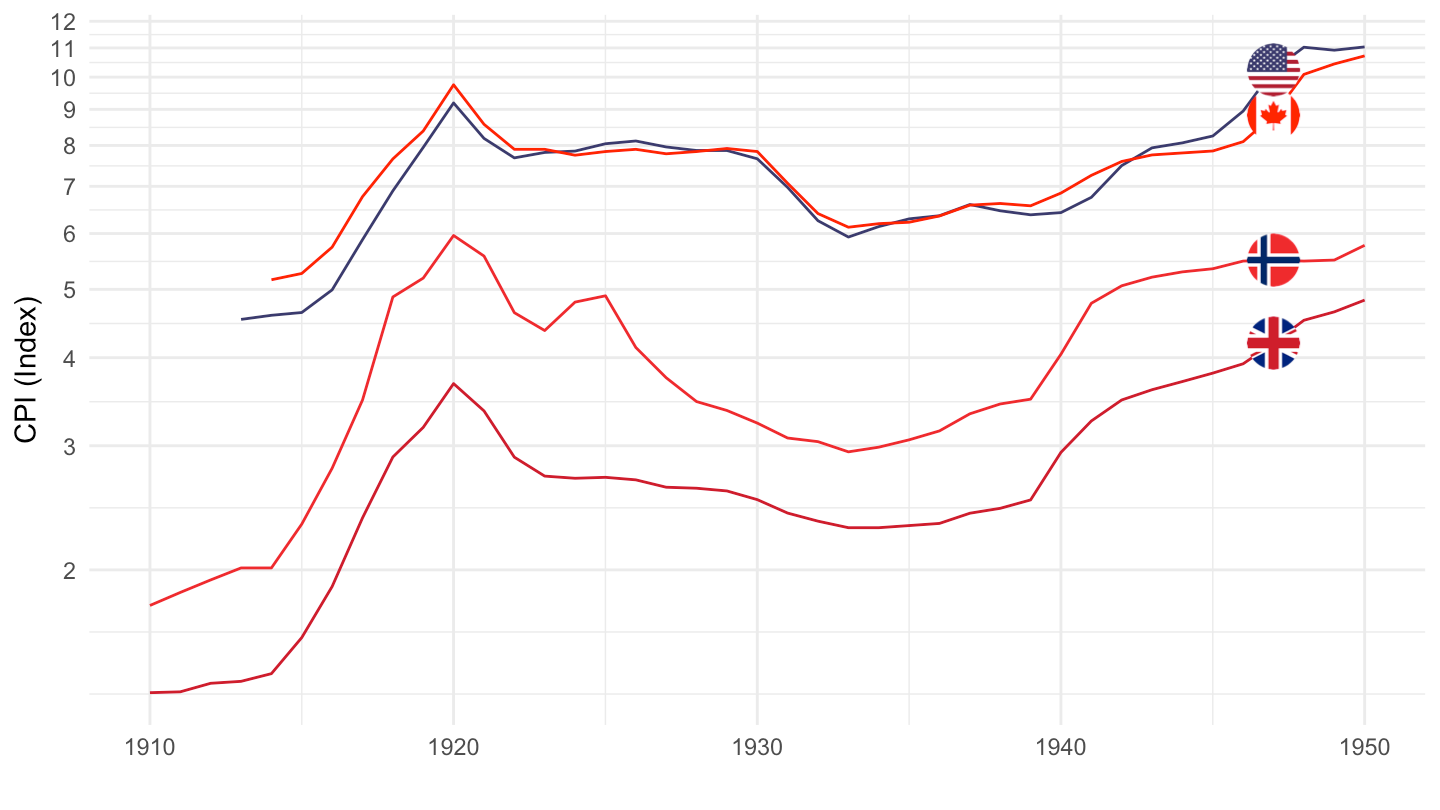
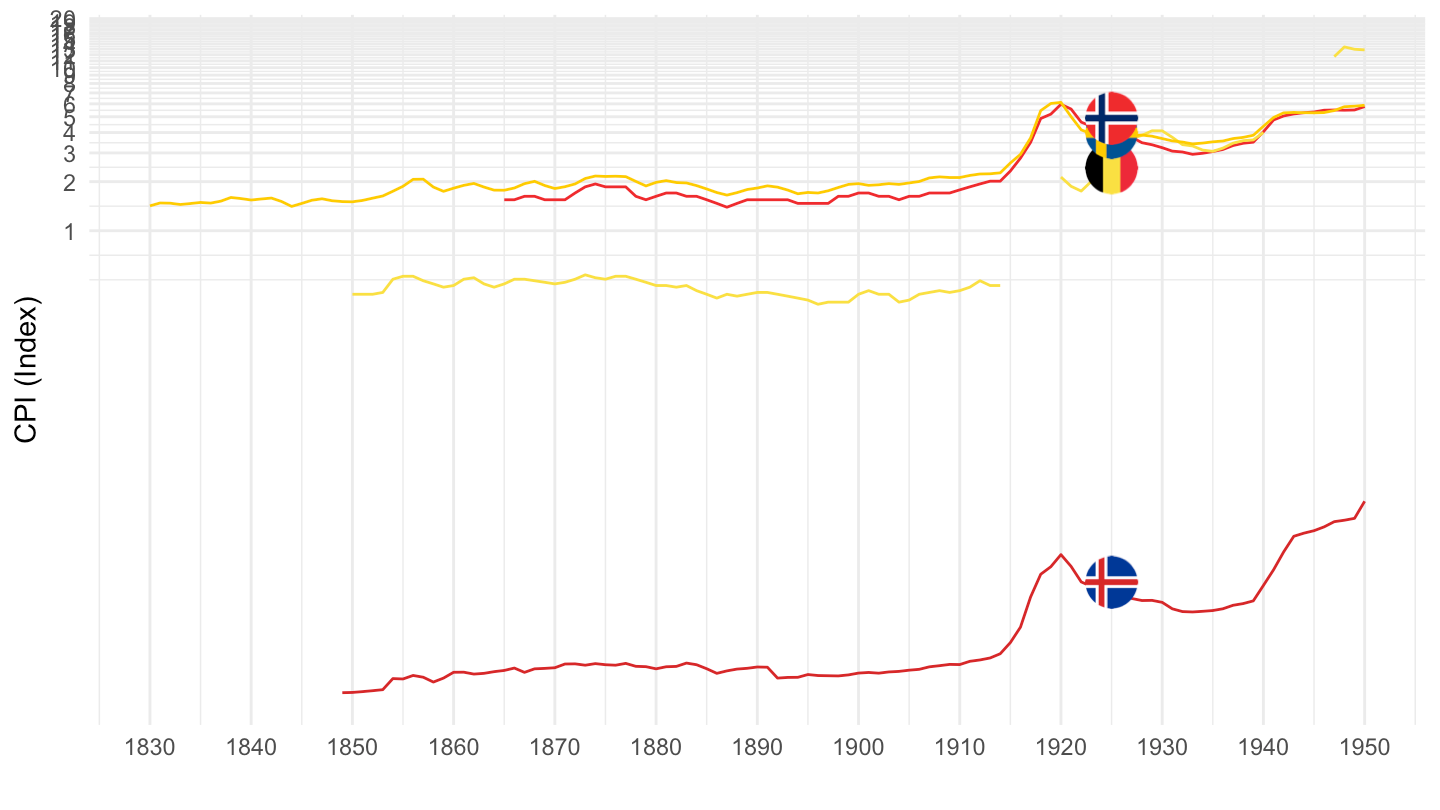
LONG_CPI |>
  filter(REF_AREA %in% c("SE", "IS", "BE", "NO"),
         UNIT_MEASURE == 628,
         FREQ == "A") |>
  year_to_date() |>
  filter(date >= as.Date("1800-01-01") & date <= as.Date("1950-01-01")) |>
  left_join(REF_AREA, by = "REF_AREA") |>
  add_flag_color("Ref_area") |>
  ggplot() + geom_line(aes(x = date, y = OBS_VALUE, color = color)) +
  theme_minimal() + xlab("") + ylab("CPI (Index)") +
  scale_x_date(breaks = seq(1600, 2100, 10) |> paste0("-01-01") |> as.Date(),
               labels = date_format("%Y")) +
  scale_y_log10(breaks = seq(0, 20, 1),
                labels = dollar_format(accuracy = 1, prefix = "")) +
  scale_color_identity() + add_flags +
  theme(legend.position = c(0.1, 0.45),
        legend.title = element_blank())