Code
load_data("bea/T10105.RData")
load_data("bea/UnderlyingGDPbyIndustry.RData")
load_data("us/nber_recessions.RData")Data - BEA
load_data("bea/T10105.RData")
load_data("bea/UnderlyingGDPbyIndustry.RData")
load_data("us/nber_recessions.RData")paste0("https://apps.bea.gov/api/data/?&",
"UserID=", bea_key, "&",
"method=GetParameterList&",
"DataSetName=UnderlyingGDPbyIndustry&") %>%
fromJSON(.) %>%
pluck("BEAAPI", "Results", "Parameter") %>%
select(ParameterName, ParameterDataType, ParameterDescription) %>%
{if (is_html_output()) print_table(.) else .}| ParameterName | ParameterDataType | ParameterDescription |
|---|---|---|
| Frequency | string | Q-Quarterly |
| Industry | string | List of industries to retrieve (ALL for All) |
| TableID | integer | The unique Underlying GDP by Industry table identifier (ALL for All) |
| Year | integer | List of year(s) of data to retrieve (ALL for All) |
paste0("https://apps.bea.gov/api/data/?&",
       "UserID=", bea_key, "&",
       "method=GetParameterValues&",
       "DataSetName=UnderlyingGDPbyIndustry&",
       "ParameterName=TableID&") %>%
  fromJSON(.) %>%
  pluck("BEAAPI", "Results", "ParamValue") %>%
  select(Key, Desc) %>%
{if (is_html_output()) datatable(., filter = 'top', rownames = F) else .}UnderlyingGDPbyIndustry %>%
filter(TableID == "211",
DataValue >= 3,
date == as.Date("2018-01-01")) %>%
select(Industry, IndustrYDescription, DataValue) %>%
mutate(DataValue = paste0(DataValue, " %")) %>%
{if (is_html_output()) datatable(., filter = 'top', rownames = F) else .}UnderlyingGDPbyIndustry %>%
filter(TableID == "211",
DataValue >= 1,
date == as.Date("2018-01-01")) %>%
select(Industry, IndustrYDescription, DataValue) %>%
mutate(DataValue = paste0(DataValue, " %")) %>%
{if (is_html_output()) datatable(., filter = 'top', rownames = F) else .}UnderlyingGDPbyIndustry %>%
filter(TableID == "211",
date == as.Date("2018-01-01")) %>%
select(Industry, IndustrYDescription, DataValue) %>%
arrange(-DataValue) %>%
{if (is_html_output()) datatable(., filter = 'top', rownames = F) else .}UnderlyingGDPbyIndustry %>%
filter(TableID == "211",
Industry %in% c("FIRE", "PGOOD", "31G", "531")) %>%
ggplot + ylab("% of GDP") + xlab("") + theme_minimal() +
geom_line(aes(x = date, y = DataValue/100, color = IndustrYDescription, linetype = IndustrYDescription)) +
geom_rect(data = nber_recessions %>%
filter(Peak > as.Date("1927-01-01")),
aes(xmin = Peak, xmax = Trough, ymin = -Inf, ymax = +Inf),
fill = 'grey', alpha = 0.5) +
scale_x_date(breaks = "2 years",
minor_breaks = "1 years",
labels = date_format("%y"),
limits = c(1997, 2019) %>% paste0("-01-01") %>% as.Date) +
scale_y_continuous(breaks = 0.01*seq(0, 160, 2),
labels = scales::percent_format(accuracy = 1)) +
scale_color_manual(values = viridis(5)[1:4]) +
theme(legend.position = c(0.7, 0.9),
legend.title = element_blank(),
legend.text = element_text(size = 8),
legend.key.size = unit(0.9, 'lines'))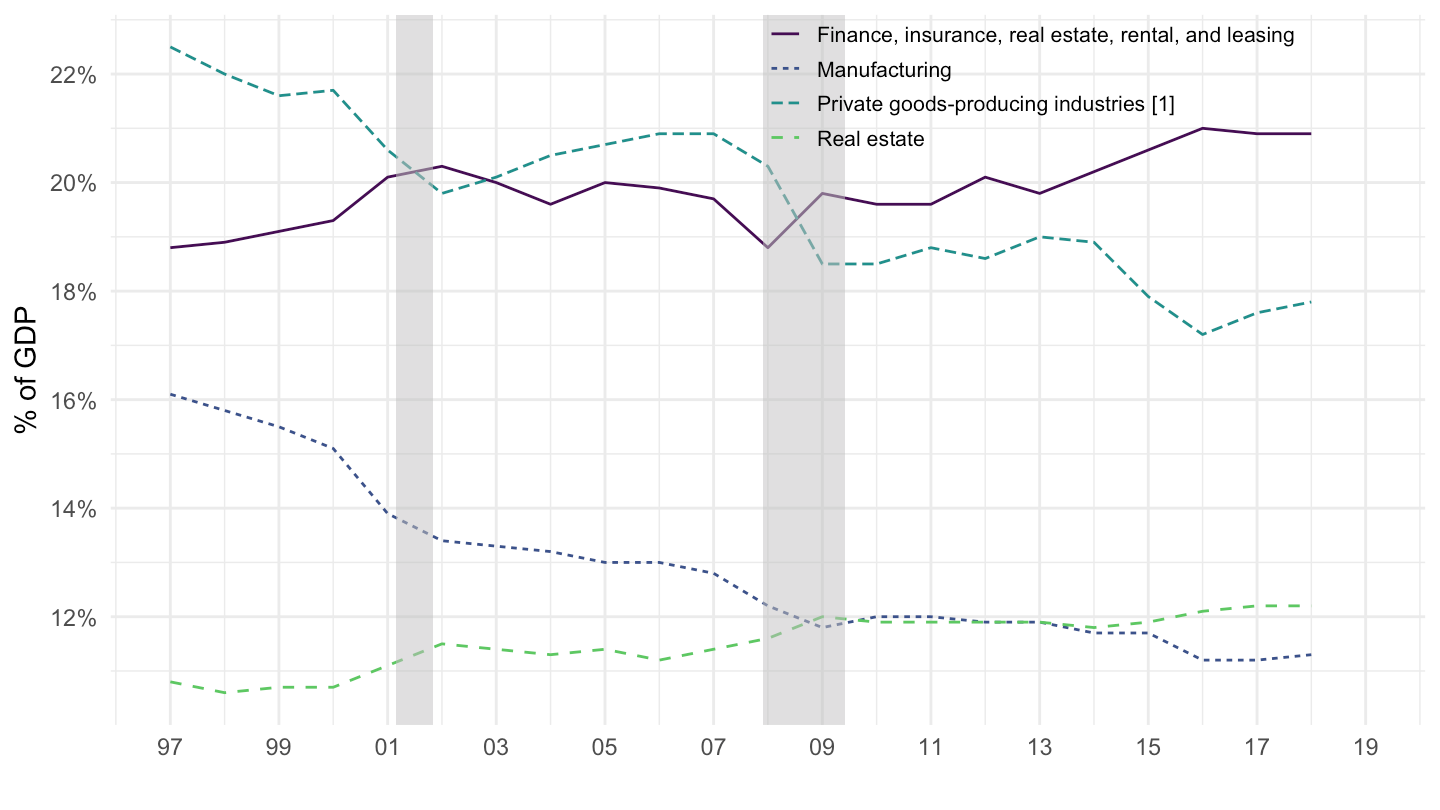
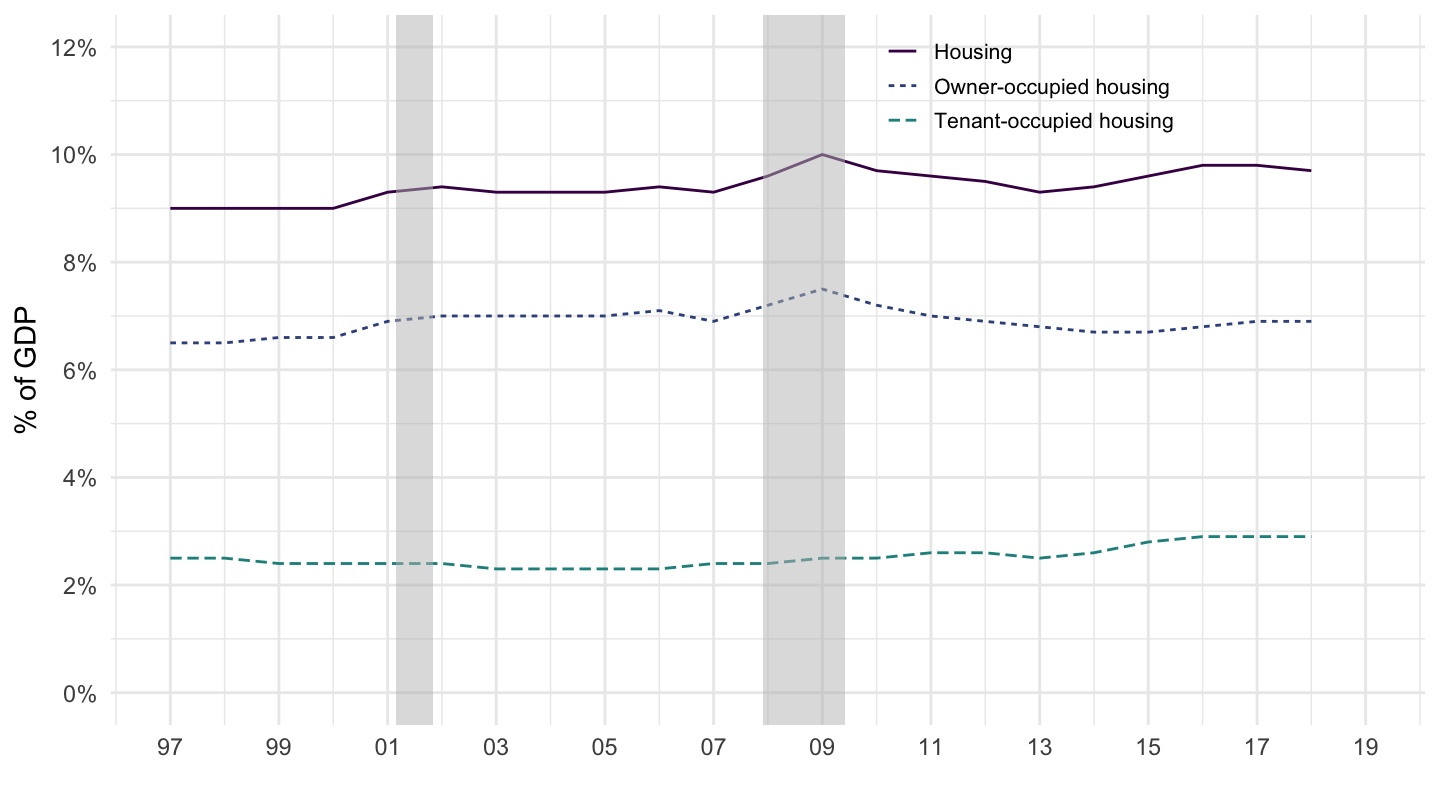
UnderlyingGDPbyIndustry %>%
  filter(TableID == "211",
         Industry %in% c("HS", "HSO", "HST")) %>%
  ggplot + ylab("% of GDP") + xlab("") + theme_minimal() +
  geom_line(aes(x = date, y = DataValue/100, color = IndustrYDescription, linetype = IndustrYDescription)) +
  geom_rect(data = nber_recessions %>%
              filter(Peak > as.Date("1927-01-01")),
            aes(xmin = Peak, xmax = Trough, ymin = -Inf, ymax = +Inf),
            fill = 'grey', alpha = 0.5) +
  scale_x_date(breaks = "2 years",
               minor_breaks = "1 years",
               labels = date_format("%y"),
               limits = c(1997, 2019) %>% paste0("-01-01") %>% as.Date) +
  scale_y_continuous(breaks = 0.01*seq(0, 160, 2),
                     labels = scales::percent_format(accuracy = 1),
                     limits = c(0, 0.12)) +
  scale_color_manual(values = viridis(5)[1:4]) +
  theme(legend.position = c(0.7, 0.9),
        legend.title = element_blank(),
        legend.text = element_text(size = 8),
        legend.key.size = unit(0.9, 'lines'))