Table 2.4.5U. Personal Consumption Expenditures by Type of Product (A) (Q) (M) - U20405

Data - BEA

Code
gdp_adjustment <- read_parquet("gdp_adjustment.parquet")
nber_recessions <- read_parquet(here::here("data", "us", "nber_recessions.parquet"))
U20405 <- read_parquet("U20405.parquet")
U20405_M <- U20405 |> filter(FREQ == "M")
U20405_A <- U20405 |> filter(FREQ == "A")
US_presidents <- read_parquet(here::here("data", "us", "US_presidents.parquet"))

Ex 1: Changes in 2006-2009

Code
U20405_M |>
  filter(date %in% as.Date(c("2009-12-01", "2006-01-01"))) |>
  group_by(line, line_desc) |>
  arrange(date) |>
  summarise(value = value[2] - value[1]) %>%
  mutate(value = (value/1000) |> round() |> paste0(" Bn") %>% paste0("$ ", .)) |>
  select(Line = line, `Description` = line_desc, `Change 06-09` = value) %>%
  right_join(U20405_M |>
               filter(date == "2019-03-01",
                      value > 100000) %>%
               mutate(value = (value/1000) |> round() |> paste0(" Bn") %>% paste0("$ ", .)) |>
               select(Line = line, `Description` = line_desc, `March 2019` = value)) %>%
  {if (is_html_output()) datatable(., filter = 'top', rownames = F) else .}

Ex 2: 1979, 1989, 1999, 2009, 2019 Tables

Percentage

Code
U20405_M |>
  mutate(year = year(date)) |>
  filter(year %in% c(1959, 1979, 1999, 2019),
         month(date) == 1) |>
  group_by(year) |>
  mutate(value = round(100*value/value[1], 1)) |>
  ungroup() |>
  select(line, line_desc, year, value) |>
  spread(year, value) %>%
  {if (is_html_output()) datatable(., filter = 'top', rownames = F) else .}

Billions

Code
U20405_M |>
  mutate(year = year(date)) |>
  filter(year %in% c(1959, 1979, 1999, 2019),
         month(date) == 1) |>
  group_by(year) %>%
  mutate(value = (value/1000) |> round()) |>
  ungroup() |>
  select(line, line_desc, year, value) |>
  spread(year, value) %>%
  {if (is_html_output()) datatable(., filter = 'top', rownames = F) else .}

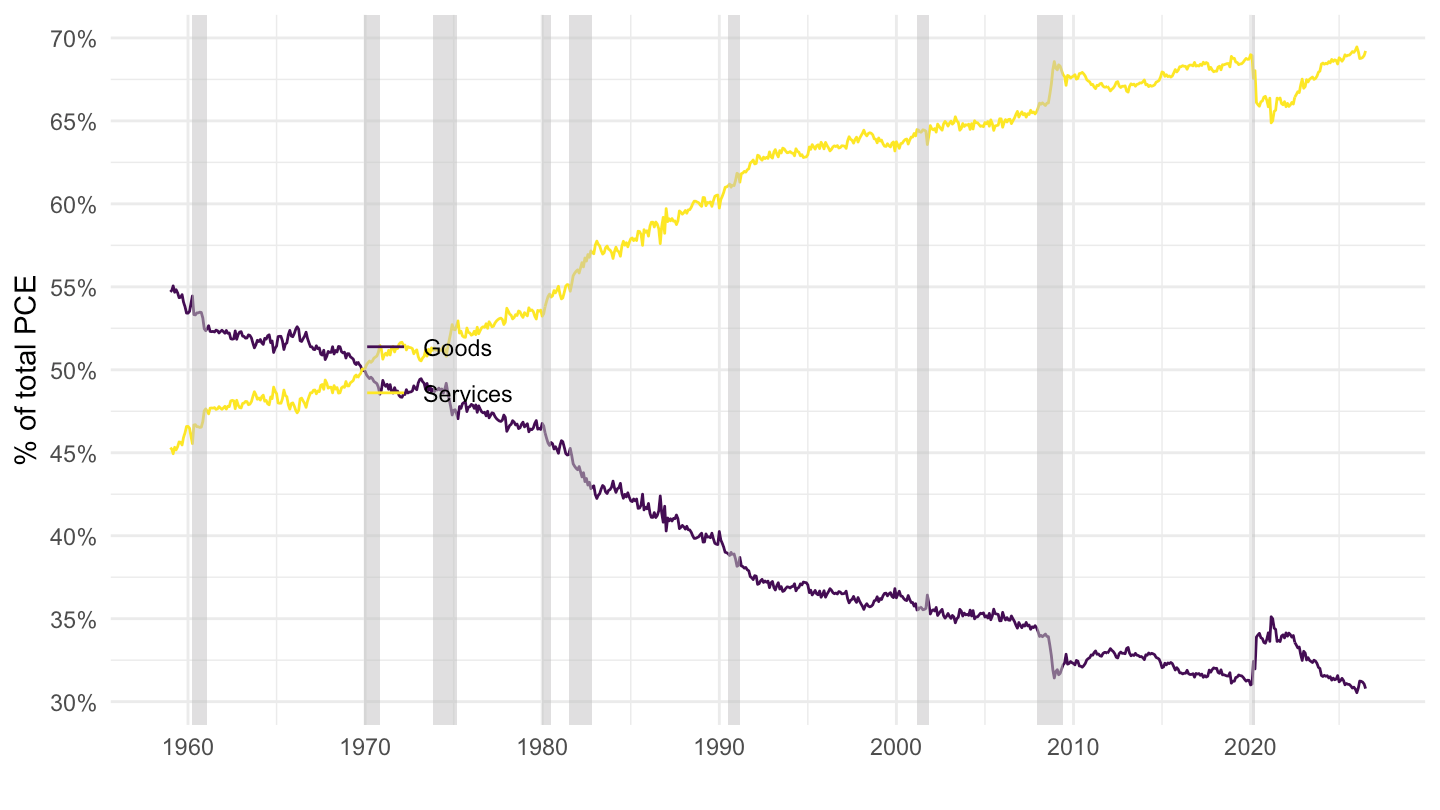
Ex 3: Goods vs Services

Code
pce_total <- U20405_M |> filter(line == 1) |> select(date, total = value)

U20405_M |>
  filter(line %in% c(2, 150)) |>
  left_join(pce_total, by = "date") |>
  mutate(share = value/total) |>
  ggplot() + theme_minimal() +
  geom_line(aes(x = date, y = share, color = line_desc)) +
  geom_rect(data = nber_recessions |>
              filter(Peak > as.Date("1959-01-01")),
            aes(xmin = Peak, xmax = Trough, ymin = -Inf, ymax = +Inf),
            fill = 'grey', alpha = 0.5) +
  scale_x_date(breaks = seq(1930, 2100, 10) |> paste0("-01-01") |> as.Date(),
               labels = date_format("%Y")) +
  scale_y_continuous(breaks = 0.05*seq(0, 20, 1),
                     labels = scales::percent_format(accuracy = 1)) +
  scale_color_manual(values = viridis(2)) +
  theme(legend.title = element_blank(),
        legend.position = c(0.25, 0.5)) +
  ylab("% of total PCE") + xlab("")

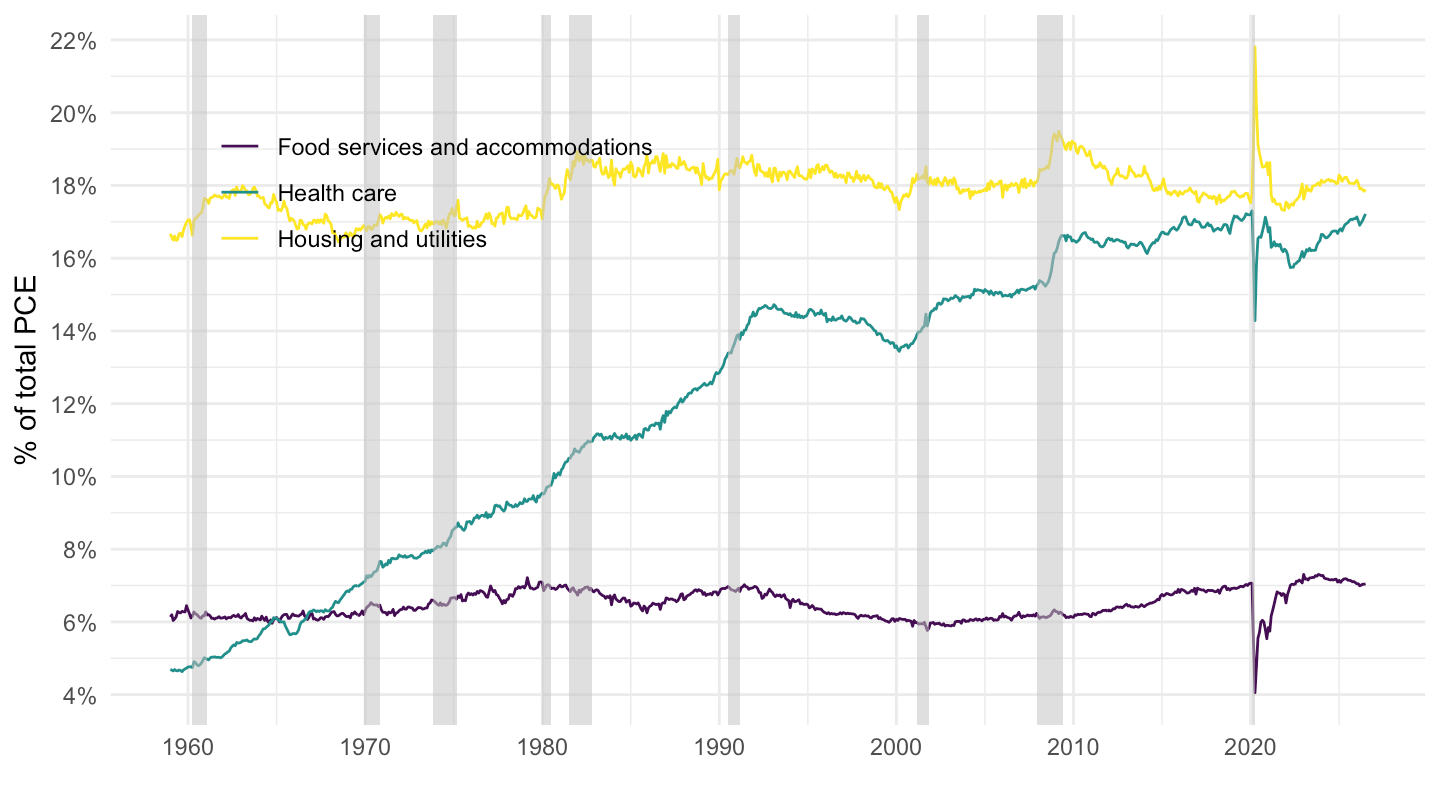
Ex 4: Composition of Services

Code
U20405_M |>
  filter(line %in% c(152, 172, 234)) |>
  left_join(pce_total, by = "date") |>
  mutate(share = value/total) |>
  ggplot() + theme_minimal() +
  geom_line(aes(x = date, y = share, color = line_desc)) +
  geom_rect(data = nber_recessions |>
              filter(Peak > as.Date("1959-01-01")),
            aes(xmin = Peak, xmax = Trough, ymin = -Inf, ymax = +Inf),
            fill = 'grey', alpha = 0.5) +
  scale_x_date(breaks = seq(1930, 2100, 10) |> paste0("-01-01") |> as.Date(),
               labels = date_format("%Y")) +
  scale_y_continuous(breaks = 0.02*seq(0, 20, 1),
                     labels = scales::percent_format(accuracy = 1)) +
  scale_color_manual(values = viridis(3)) +
  theme(legend.title = element_blank(),
        legend.position = c(0.25, 0.75)) +
  ylab("% of total PCE") + xlab("")

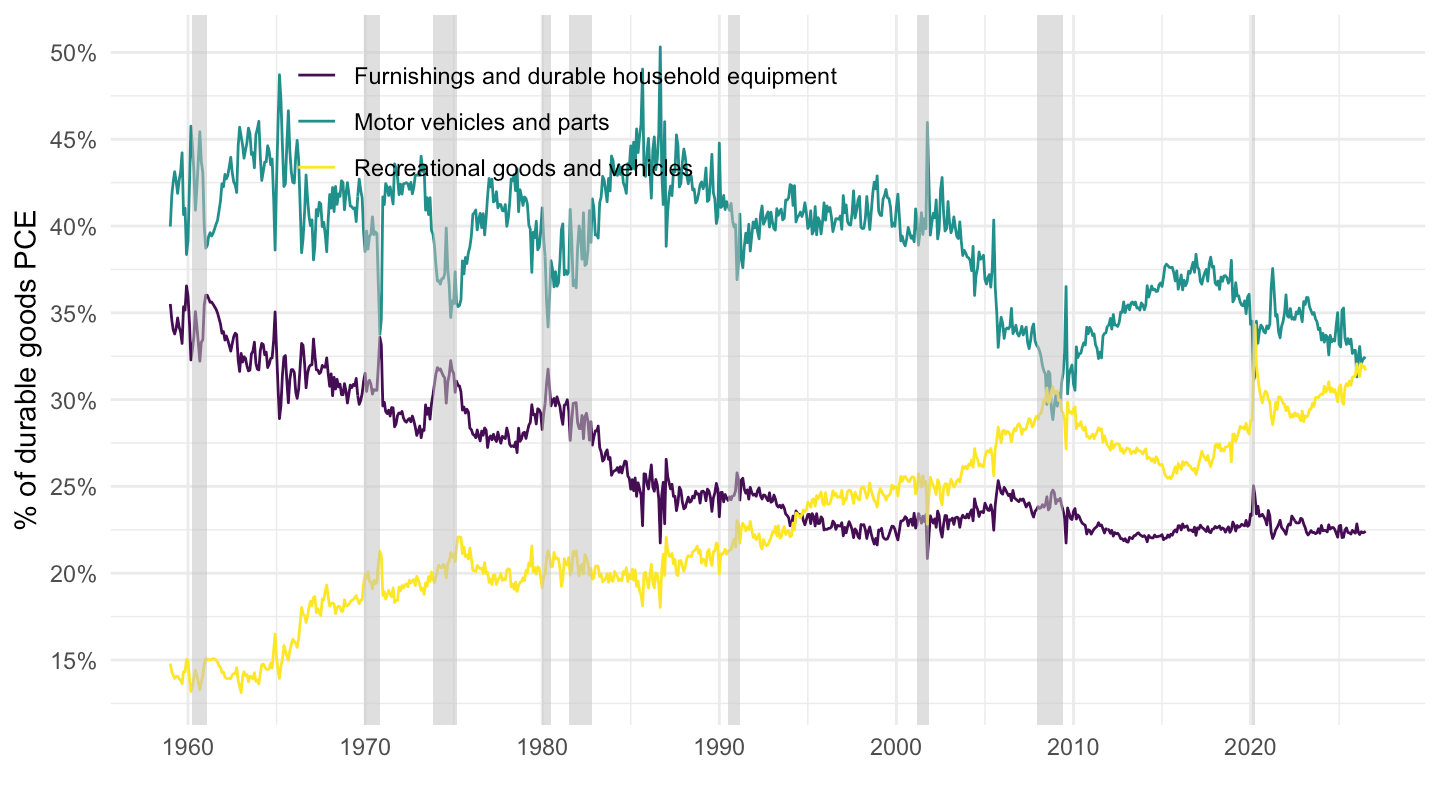
Ex 5: Composition of Durable Goods

Code
durables_total <- U20405_M |> filter(line == 3) |> select(date, total = value)

U20405_M |>
  filter(line %in% c(4, 23, 38)) |>
  left_join(durables_total, by = "date") |>
  mutate(share = value/total) |>
  ggplot() + theme_minimal() +
  geom_line(aes(x = date, y = share, color = line_desc)) +
  geom_rect(data = nber_recessions |>
              filter(Peak > as.Date("1959-01-01")),
            aes(xmin = Peak, xmax = Trough, ymin = -Inf, ymax = +Inf),
            fill = 'grey', alpha = 0.5) +
  scale_x_date(breaks = seq(1930, 2100, 10) |> paste0("-01-01") |> as.Date(),
               labels = date_format("%Y")) +
  scale_y_continuous(breaks = 0.05*seq(0, 20, 1),
                     labels = scales::percent_format(accuracy = 1)) +
  scale_color_manual(values = viridis(3)) +
  theme(legend.title = element_blank(),
        legend.position = c(0.35, 0.85)) +
  ylab("% of durable goods PCE") + xlab("")

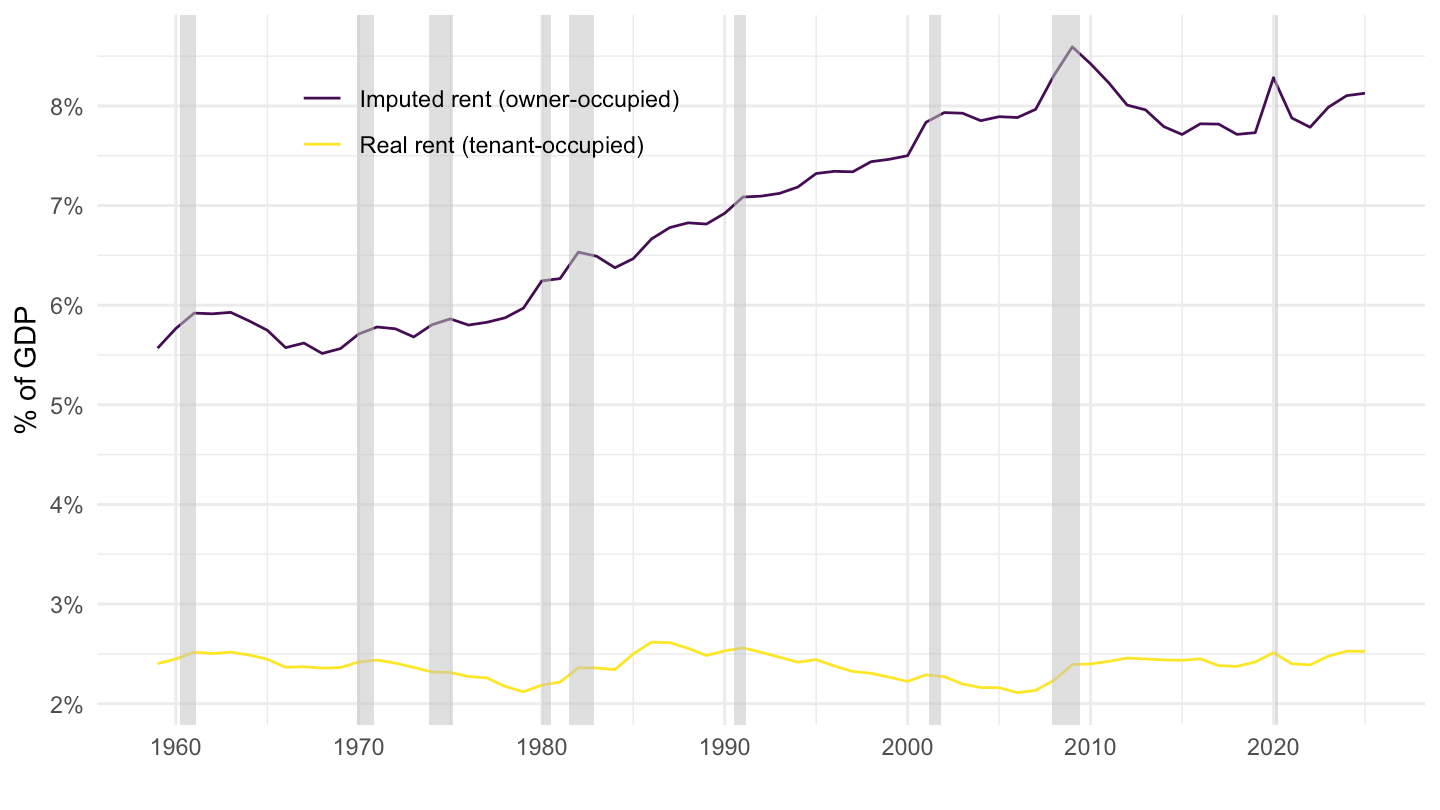
Ex 6: Rental Housing (Real vs Imputed) as % of GDP

Code
gdp_A <- read_parquet("gdp_A.parquet") |>
  mutate(year = year(date)) |>
  select(year, gdp = value)

U20405_A |>
  filter(line %in% c(154, 160)) |>
  mutate(year = year(date),
         line_desc = case_when(line == 154 ~ "Real rent (tenant-occupied)",
                                line == 160 ~ "Imputed rent (owner-occupied)")) |>
  left_join(gdp_A, by = "year") |>
  mutate(share = value/gdp) |>
  ggplot() + theme_minimal() +
  geom_line(aes(x = date, y = share, color = line_desc)) +
  geom_rect(data = nber_recessions |>
              filter(Peak > as.Date("1959-01-01")),
            aes(xmin = Peak, xmax = Trough, ymin = -Inf, ymax = +Inf),
            fill = 'grey', alpha = 0.5) +
  scale_x_date(breaks = seq(1930, 2100, 10) |> paste0("-01-01") |> as.Date(),
               labels = date_format("%Y")) +
  scale_y_continuous(breaks = 0.01*seq(0, 10, 1),
                     labels = scales::percent_format(accuracy = 1)) +
  scale_color_manual(values = viridis(2)) +
  theme(legend.title = element_blank(),
        legend.position = c(0.3, 0.85)) +
  ylab("% of GDP") + xlab("")

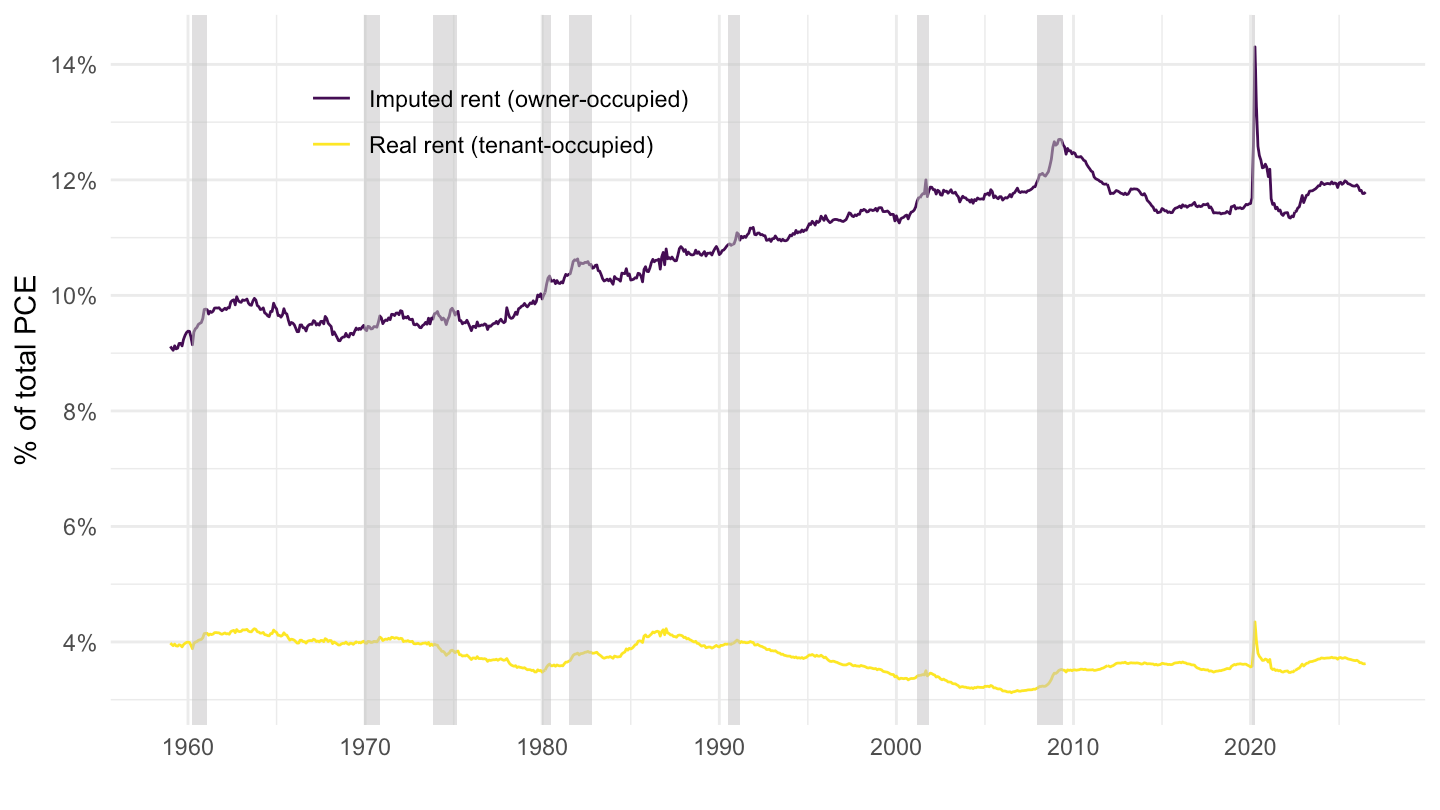
Ex 7: Rental Housing (Real vs Imputed) as % of PCE

Code
U20405_M |>
  filter(line %in% c(154, 160)) |>
  mutate(line_desc = case_when(line == 154 ~ "Real rent (tenant-occupied)",
                                line == 160 ~ "Imputed rent (owner-occupied)")) |>
  left_join(pce_total, by = "date") |>
  mutate(share = value/total) |>
  ggplot() + theme_minimal() +
  geom_line(aes(x = date, y = share, color = line_desc)) +
  geom_rect(data = nber_recessions |>
              filter(Peak > as.Date("1959-01-01")),
            aes(xmin = Peak, xmax = Trough, ymin = -Inf, ymax = +Inf),
            fill = 'grey', alpha = 0.5) +
  scale_x_date(breaks = seq(1930, 2100, 10) |> paste0("-01-01") |> as.Date(),
               labels = date_format("%Y")) +
  scale_y_continuous(breaks = 0.02*seq(0, 20, 1),
                     labels = scales::percent_format(accuracy = 1)) +
  scale_color_manual(values = viridis(2)) +
  theme(legend.title = element_blank(),
        legend.position = c(0.3, 0.85)) +
  ylab("% of total PCE") + xlab("")