Last observation: 2025 (N = 43)
First observation: 1929 (N = 43)
Last data update: 15 oct. 2026, 22:20
Last compile: 15 oct. 2026, 22:25
T11400_A |>
  year_to_date() |>
  mutate(year = year(date)) |>
  filter(year %in% c(1929, 1949, 1969, 1989, 2009, 2019)) |>
  group_by(year) |>
  mutate(value = round(100*DataValue/DataValue[1], 1)) |>
  ungroup() |>
  select(LineNumber, LineDescription, year, value) |>
  spread(year, value) %>%
{if (is_html_output()) datatable(., filter = 'top', rownames = F) else .}nva_total <- T11400_A |> filter(LineNumber == 3) |> select(TimePeriod, total = DataValue)
T11400_A |>
filter(LineNumber %in% c(4, 8)) |>
left_join(nva_total, by = "TimePeriod") |>
mutate(share = DataValue/total,
LineDescription = ifelse(LineNumber == 4, "Compensation of employees",
"Net operating surplus (profit margin)")) |>
year_to_date() |>
ggplot() + theme_minimal() +
geom_line(aes(x = date, y = share, color = LineDescription)) +
geom_rect(data = nber_recessions |>
filter(Peak > as.Date("1929-01-01")),
aes(xmin = Peak, xmax = Trough, ymin = -Inf, ymax = +Inf),
fill = 'grey', alpha = 0.5) +
scale_x_date(breaks = seq(1920, 2100, 10) |> paste0("-01-01") |> as.Date(),
labels = date_format("%Y")) +
scale_y_continuous(labels = scales::percent_format(accuracy = 1)) +
scale_color_manual(values = viridis(2)) +
theme(legend.title = element_blank(),
legend.position = "bottom") +
ylab("% of net value added, corporate business") + xlab("")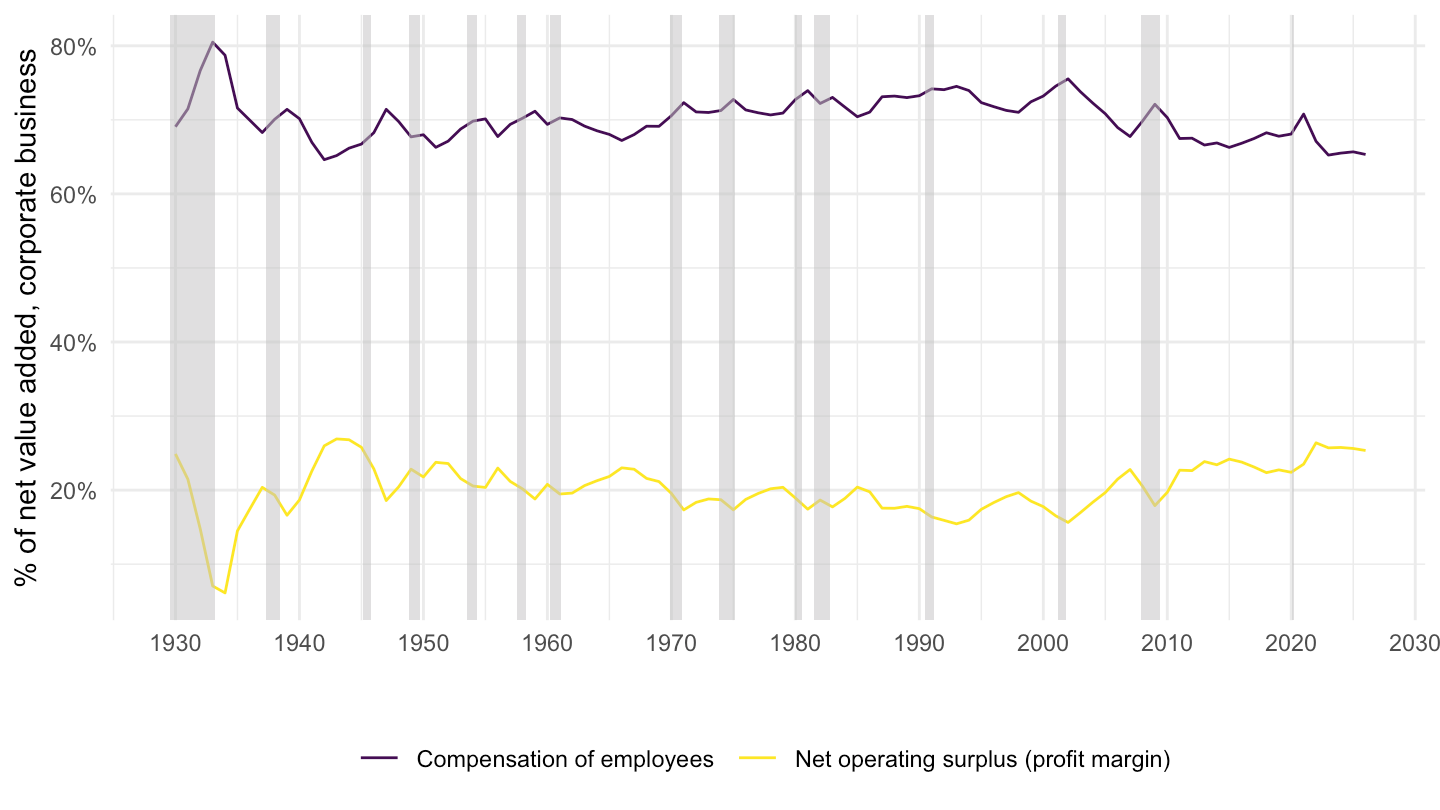
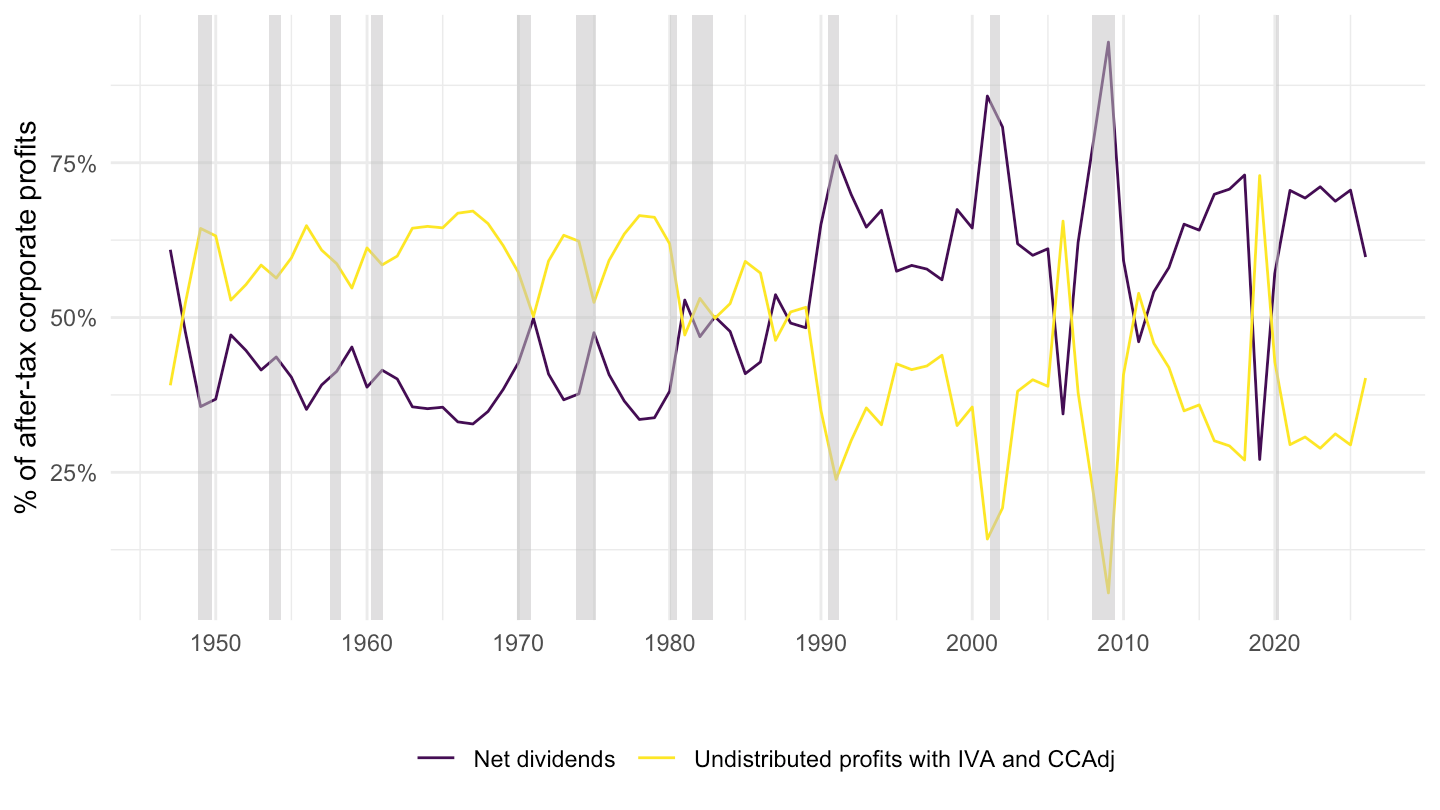
profits_total <- T11400_A |> filter(LineNumber == 13) |> select(TimePeriod, total = DataValue)

T11400_A |>
  filter(LineNumber %in% c(14, 15)) |>
  left_join(profits_total, by = "TimePeriod") |>
  mutate(share = DataValue/total) |>
  year_to_date() |>
  filter(date >= as.Date("1946-01-01")) |>
  ggplot() + theme_minimal() +
  geom_line(aes(x = date, y = share, color = LineDescription)) +
  geom_rect(data = nber_recessions |>
              filter(Peak > as.Date("1946-01-01")),
            aes(xmin = Peak, xmax = Trough, ymin = -Inf, ymax = +Inf),
            fill = 'grey', alpha = 0.5) +
  scale_x_date(breaks = seq(1920, 2100, 10) |> paste0("-01-01") |> as.Date(),
               labels = date_format("%Y")) +
  scale_y_continuous(labels = scales::percent_format(accuracy = 1)) +
  scale_color_manual(values = viridis(2)) +
  theme(legend.title = element_blank(),
        legend.position = "bottom") +
  ylab("% of after-tax corporate profits") + xlab("")