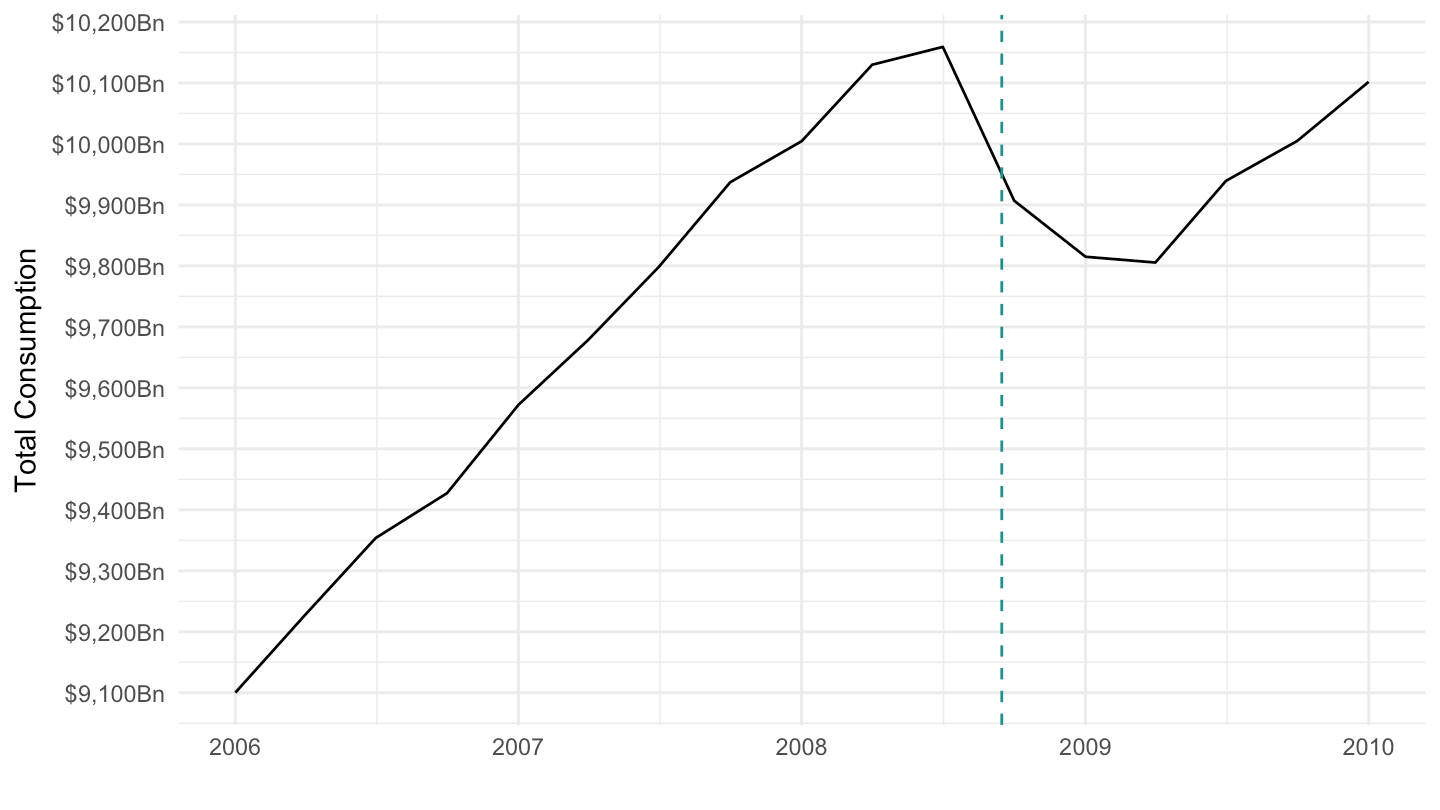
paste0("https://apps.bea.gov/api/data/?&",
       "UserID=", bea_key, "&",
       "method=GetData&",
       "DataSetName=NIUnderlyingDetail&",
       "TableName=U20405&",
       "Frequency=Q&",
       "Year=ALL&",
       "ResultFormat=JSON") |>
  fromJSON() |>
  pluck("BEAAPI", "Results", "Data") %>%
  mutate(DataValue = DataValue %>% gsub(",", "", .) |> as.numeric()) %>%
  mutate(year = substr(TimePeriod, 1, 4),
         qtr = substr(TimePeriod, 6, 6) |> as.numeric(),
         month = ((qtr-1)*3+1) |> str_pad(2, pad = "0"),
         date = paste0(year, "-", month, "-01") |> as.Date()) |>
  filter(LineNumber == 1,
         date >= as.Date("2006-01-01"),
         date <= as.Date("2010-01-01")) |>
  mutate(DataValue = DataValue/1000) |>
  ggplot() + geom_line(aes(x = date, y = DataValue)) + theme_minimal() +
  scale_x_date(breaks = seq(1870, 2100, 1) |> paste0("-01-01") |> as.Date(),
               labels = date_format("%Y")) +
  scale_y_continuous(breaks = function(x) seq(1000*floor(min(x)/1000), max(x), 100),
                     labels = dollar_format(suffix = "Bn", prefix = "$")) +
  xlab("") + ylab("Total Consumption") +
  geom_vline(xintercept = as.Date("2008-09-15"), linetype = "dashed", color = viridis(3)[2])
 Data - BEA