
Last observation: 2025 (N = 2128) · déc. 2025 (N = 4423)
First observation: 1990 (N = 12) · janv. 1995 (N = 29)
Last data update: 18 sept. 2026, 00:26
Last compile: 07 oct. 2026, 00:53
Taux de croissance annuel de l’indice des prix à la consommation harmonisé (IPCH), tous postes.
ICP |>


  filter(variable %in% c("ICP.M.FR.N.000000.4.ANR",
                          "ICP.M.DE.N.000000.4.ANR",
                          "ICP.M.IT.N.000000.4.ANR",
                          "ICP.M.ES.N.000000.4.ANR")) |>
  add_flag_color("Ref_area") |>
  mutate(value = value/100) |>
  na.omit() |>
  ggplot() + geom_line(aes(x = date, y = value, color = color)) +
  geom_hline(yintercept = 0, linetype = "dashed", color = "black") +
  xlab("") + ylab("") + theme_minimal() + scale_color_identity() + add_4flags +
  scale_x_date(breaks = seq(1960, 2100, 2) |> paste0("-01-01") |> as.Date(),
               labels = date_format("%Y")) +
  scale_y_continuous(labels = percent_format(accuracy = 1))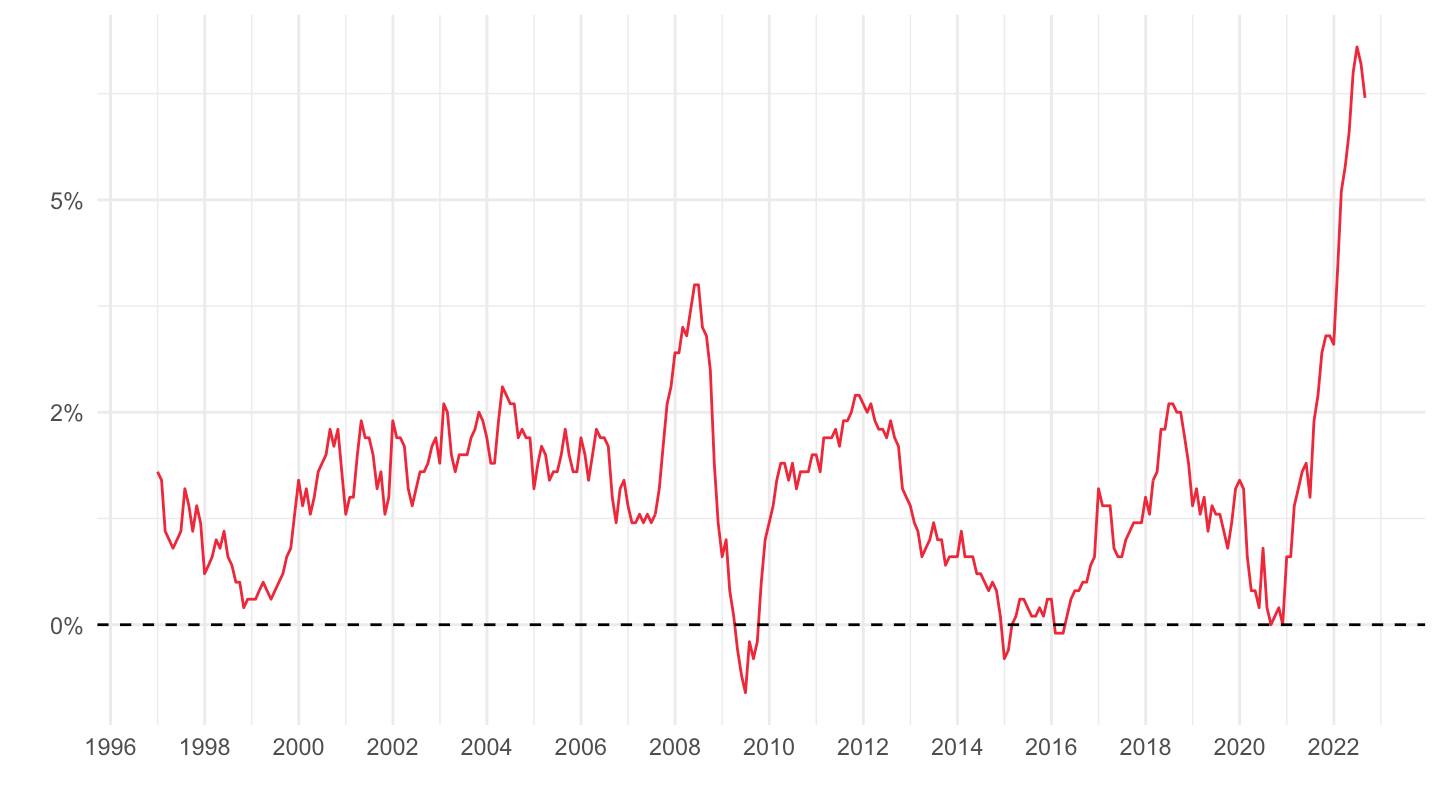
ICP |>


  filter(variable %in% c("ICP.M.FR.N.000000.4.ANR",
                          "ICP.M.DE.N.000000.4.ANR",
                          "ICP.M.IT.N.000000.4.ANR",
                          "ICP.M.ES.N.000000.4.ANR")) |>
  add_flag_color("Ref_area") |>
  mutate(value = value/100) |>
  filter(date >= as.Date("2015-01-01")) |>
  na.omit() |>
  ggplot() + geom_line(aes(x = date, y = value, color = color)) +
  geom_hline(yintercept = 0, linetype = "dashed", color = "black") +
  xlab("") + ylab("") + theme_minimal() + scale_color_identity() + add_4flags +
  scale_x_date(breaks = "1 year",
               labels = date_format("%Y")) +
  scale_y_continuous(labels = percent_format(accuracy = 1))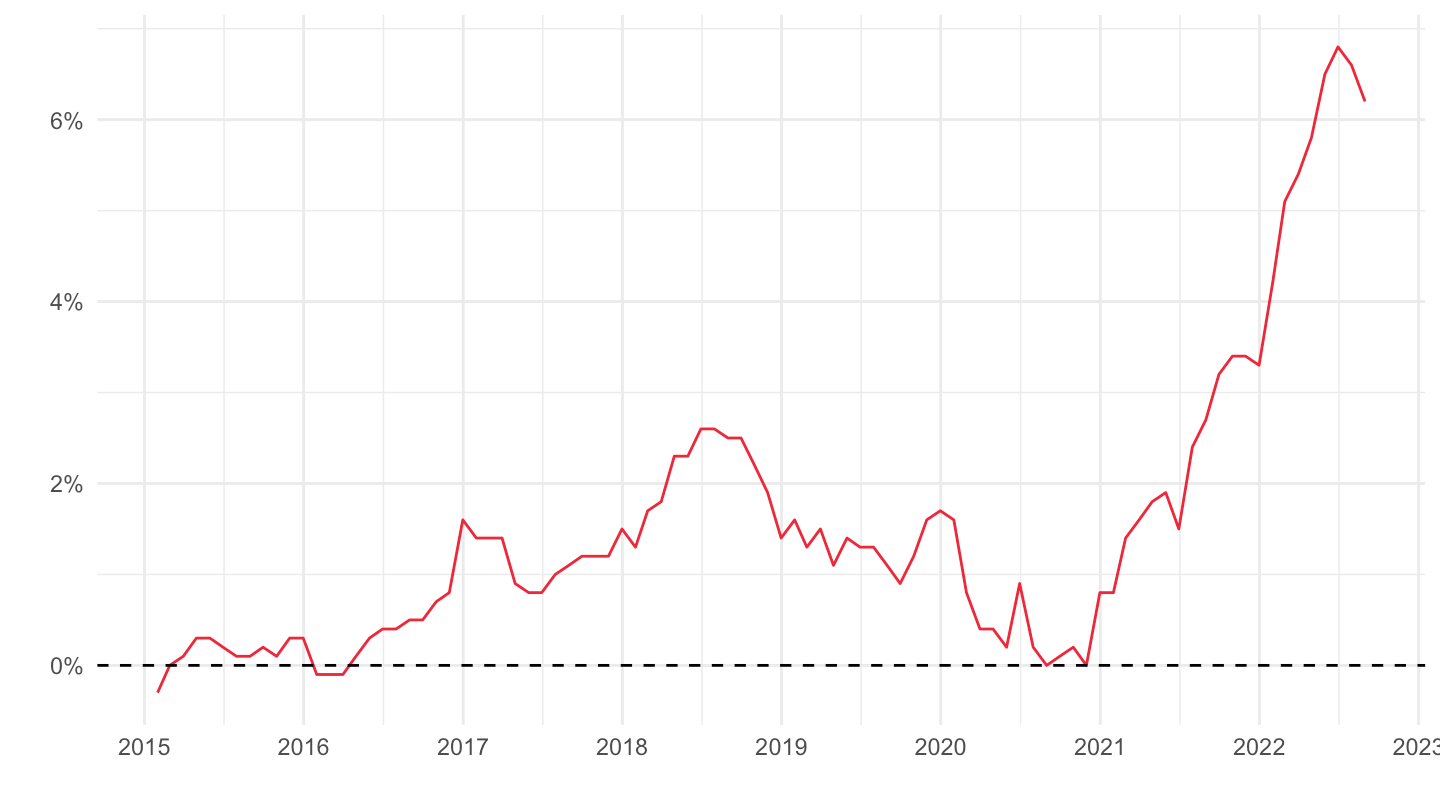
ICP |>

  filter(variable %in% c("ICP.M.FR.N.000000.4.ANR",
                          "ICP.M.U2.N.000000.4.ANR")) |>
  mutate(Variable = ifelse(REF_AREA == "U2", "Zone euro", "France")) |>
  mutate(value = value/100) |>
  na.omit() |>
  ggplot() + geom_line(aes(x = date, y = value, color = Variable)) +
  geom_hline(yintercept = 0, linetype = "dashed", color = "black") +
  xlab("") + ylab("") + theme_minimal() +
  scale_x_date(breaks = seq(1960, 2100, 2) |> paste0("-01-01") |> as.Date(),
               labels = date_format("%Y")) +
  scale_y_continuous(labels = percent_format(accuracy = 1)) +
  theme(legend.position = c(0.15, 0.85),
        legend.title = element_blank())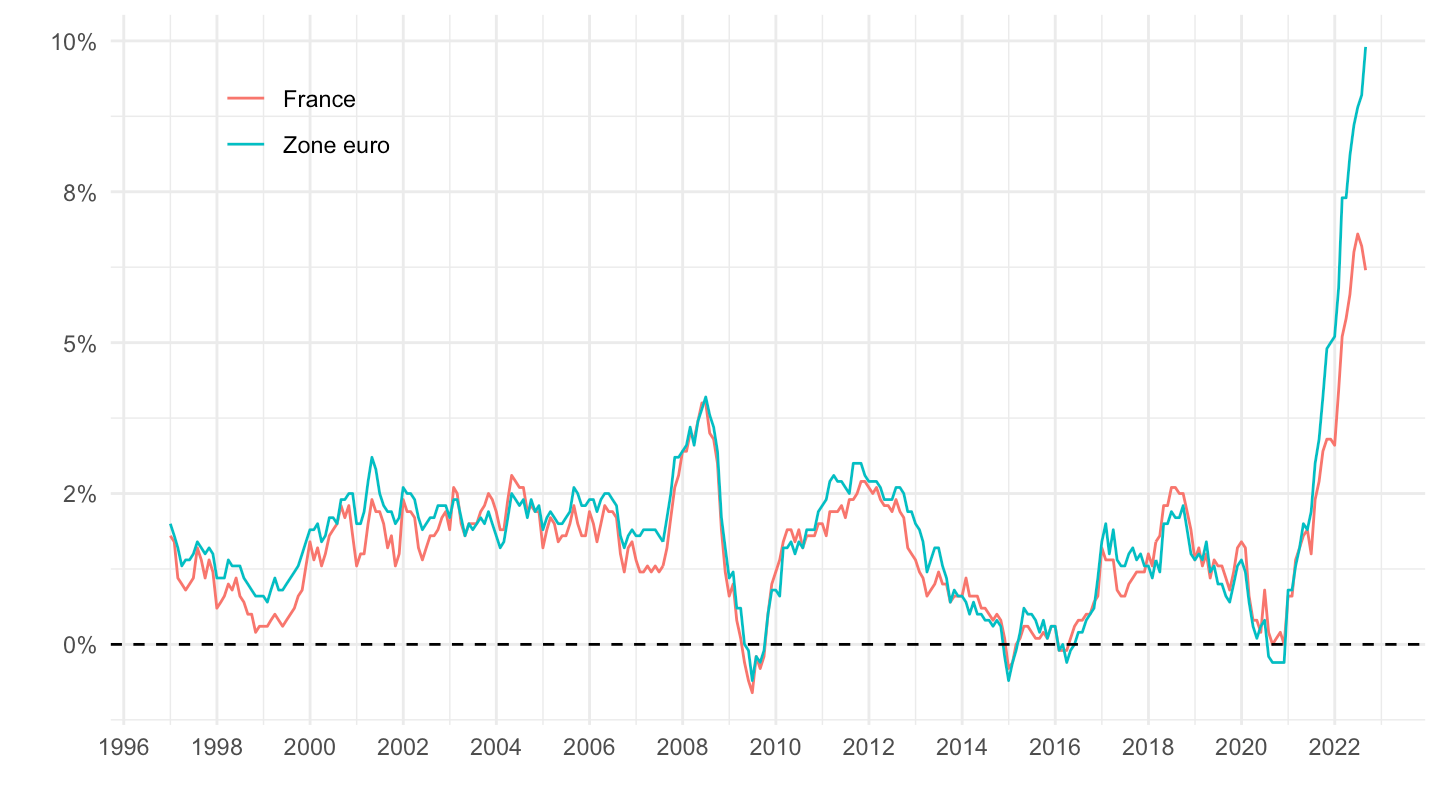
ICP |>


  filter(ICP_SUFFIX == "ANR",
         ICP_ITEM == "000000",
         FREQ == "M",
         REF_AREA %in% c("FR", "DE", "IT", "ES", "U2")) |>
  na.omit() |>
  group_by(Ref_area) |>
  filter(date == max(date)) |>
  ungroup() |>
  select(Pays = Ref_area, date, value) |>
  arrange(desc(value)) |>
print_table_conditional()| Pays | date | value |
|---|---|---|
| Espagne | 2025-12-31 | 3.0 |
| Allemagne | 2025-12-31 | 2.0 |
| Zone Euro (composition évolutive) | 2025-12-31 | 1.9 |
| Italie | 2025-12-31 | 1.2 |
| France | 2025-12-31 | 0.7 |