Last observation: M: 2022-08-31 (N = 529) · Q: 2022-06-30 (N = 30)
First observation: M: 1995-12-31 (N = 2526) · Q: 1996-03-31 (N = 240)
Last data update: 16 août 2026, 00:01. Last compile: 30 août 2026, 10:25
 Data - Banque de France
Last observation: M: 2022-08-31 (N = 529) · Q: 2022-06-30 (N = 30)
First observation: M: 1995-12-31 (N = 2526) · Q: 1996-03-31 (N = 240)
Last data update: 16 août 2026, 00:01. Last compile: 30 août 2026, 10:25
| LAST_DOWNLOAD |
|---|
| 2026-08-15 |
The manufacturing business climate indicator summarises, region by region, the responses of business leaders surveyed as part of the Banque de France’s monthly business surveys. It is built to have a long-term average equal to 100.
CONJ2 |>


  filter(ENQCNJ_QUESTION == "ICAIN000",
         FREQ == "M",
         REF_AREA %in% c("R11", "R84", "R32", "R75", "R76")) |>
  na.omit() |>
  ggplot() + geom_line(aes(x = date, y = value, color = Ref_area)) +
  geom_hline(yintercept = 100, linetype = "dashed", color = "black") +
  xlab("") + ylab("") + theme_minimal() +
  scale_x_date(breaks = seq(1960, 2100, 5) |> paste0("-01-01") |> as.Date(),
               labels = date_format("%Y")) +
  scale_y_continuous(breaks = seq(0, 150, 10)) +
  theme(legend.position = c(0.2, 0.2),
        legend.title = element_blank(),
        legend.direction = "vertical")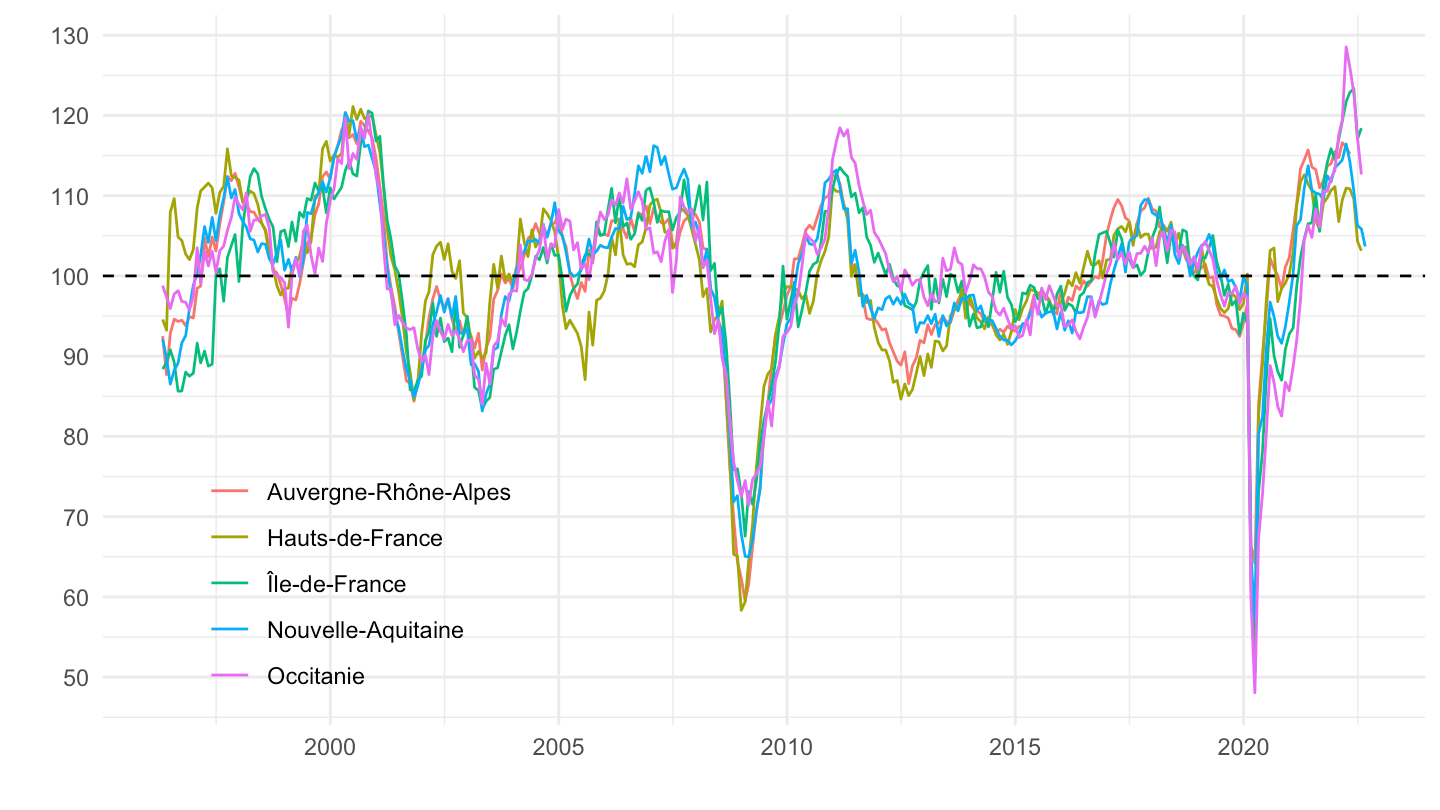
CONJ2 |>


  filter(ENQCNJ_QUESTION == "ICAIN000",
         FREQ == "M",
         REF_AREA %in% c("R11", "R84", "R32", "R75", "R76")) |>
  na.omit() |>
  filter(date >= max(date) - years(5)) |>
  ggplot() + geom_line(aes(x = date, y = value, color = Ref_area)) +
  geom_hline(yintercept = 100, linetype = "dashed", color = "black") +
  xlab("") + ylab("") + theme_minimal() +
  scale_x_date(breaks = "6 months",
               labels = date_format("%b %Y")) +
  scale_y_continuous(breaks = seq(0, 150, 5)) +
  theme(legend.position = c(0.2, 0.2),
        legend.title = element_blank(),
        legend.direction = "vertical",
        axis.text.x = element_text(angle = 45, vjust = 1, hjust = 1))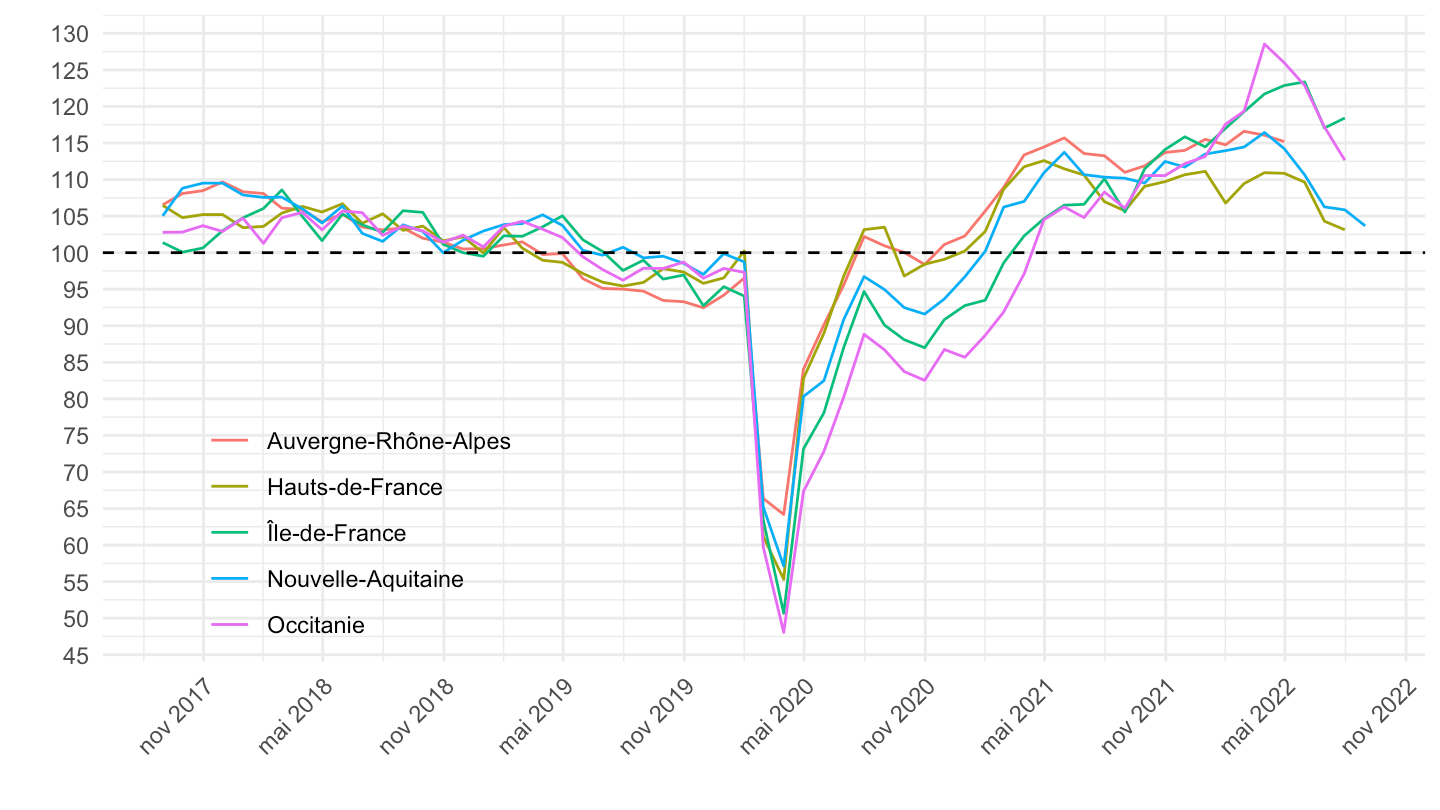
CONJ2 |>


  filter(ENQCNJ_QUESTION == "ICAIN000",
         FREQ == "M") |>
  na.omit() |>
  group_by(Ref_area) |>
  filter(date == max(date)) |>
  ungroup() |>
  select(Region = Ref_area, date, value) |>
  arrange(desc(value)) |>
print_table_conditional()| Region | date | value |
|---|---|---|
| Île-de-France | 2022-07-31 | 118.42 |
| Grand Est | 2022-01-31 | 116.25 |
| Auvergne-Rhône-Alpes | 2022-04-30 | 115.19 |
| Occitanie | 2022-07-31 | 112.64 |
| Provence-Alpes-Côte d'Azur | 2022-07-31 | 112.63 |
| Corse | 2021-10-31 | 108.61 |
| Normandie | 2022-07-31 | 107.93 |
| Pays de la Loire | 2022-07-31 | 107.04 |
| Centre-Val de Loire | 2022-08-31 | 104.66 |
| Nouvelle-Aquitaine | 2022-08-31 | 103.66 |
| Bretagne | 2022-07-31 | 103.44 |
| Hauts-de-France | 2022-07-31 | 103.13 |
| Bourgogne-Franche-Comté | 2022-07-31 | 102.64 |