Last observation: Q: 2026-03-31 (N = 3719)
First observation: Q: 1995-12-31 (N = 3719)
Last data update: 15 août 2026, 23:28. Last compile: 30 août 2026, 10:25
 Data - Banque de France
Last observation: Q: 2026-03-31 (N = 3719)
First observation: Q: 1995-12-31 (N = 3719)
Last data update: 15 août 2026, 23:28. Last compile: 30 août 2026, 10:25
Balance of financial claims and liabilities (quarterly flows, non-consolidated).
CNF |>

  filter(variable %in% c("CNF.Q.N.FR.W0.S11.S1.N.N.B9F.F._Z._Z.XDC._T.S.V.N._T",
                          "CNF.Q.N.FR.W0.S1M.S1.N.N.B9F.F._Z._Z.XDC._T.S.V.N._T",
                          "CNF.Q.N.FR.W0.S13.S1.N.N.B9F.F._Z._Z.XDC._T.S.V.N._T",
                          "CNF.Q.N.FR.W0.S1.S1.N.N.B9F.F._Z._Z.XDC._T.S.V.N._T")) |>
  mutate(Sector = case_when(REF_SECTOR == "S11" ~ "Non-financial corporations",
                              REF_SECTOR == "S1M" ~ "Households",
                              REF_SECTOR == "S13" ~ "General government",
                              REF_SECTOR == "S1" ~ "Total economy"),
         value = value/1000) |>
  ggplot() + geom_line(aes(x = date, y = value, color = Sector)) +
  geom_hline(yintercept = 0, linetype = "dashed", color = "black") +
  theme_minimal() + xlab("") + ylab("") +
  scale_x_date(breaks = seq(1960, 2100, 5) |> paste0("-01-01") |> as.Date(),
               labels = date_format("%Y")) +
  scale_y_continuous(labels = dollar_format(accuracy = 1, prefix = "", suffix = " €bn")) +
  theme(legend.position = c(0.25, 0.2),
        legend.title = element_blank(),
        legend.text = element_text(size = 7))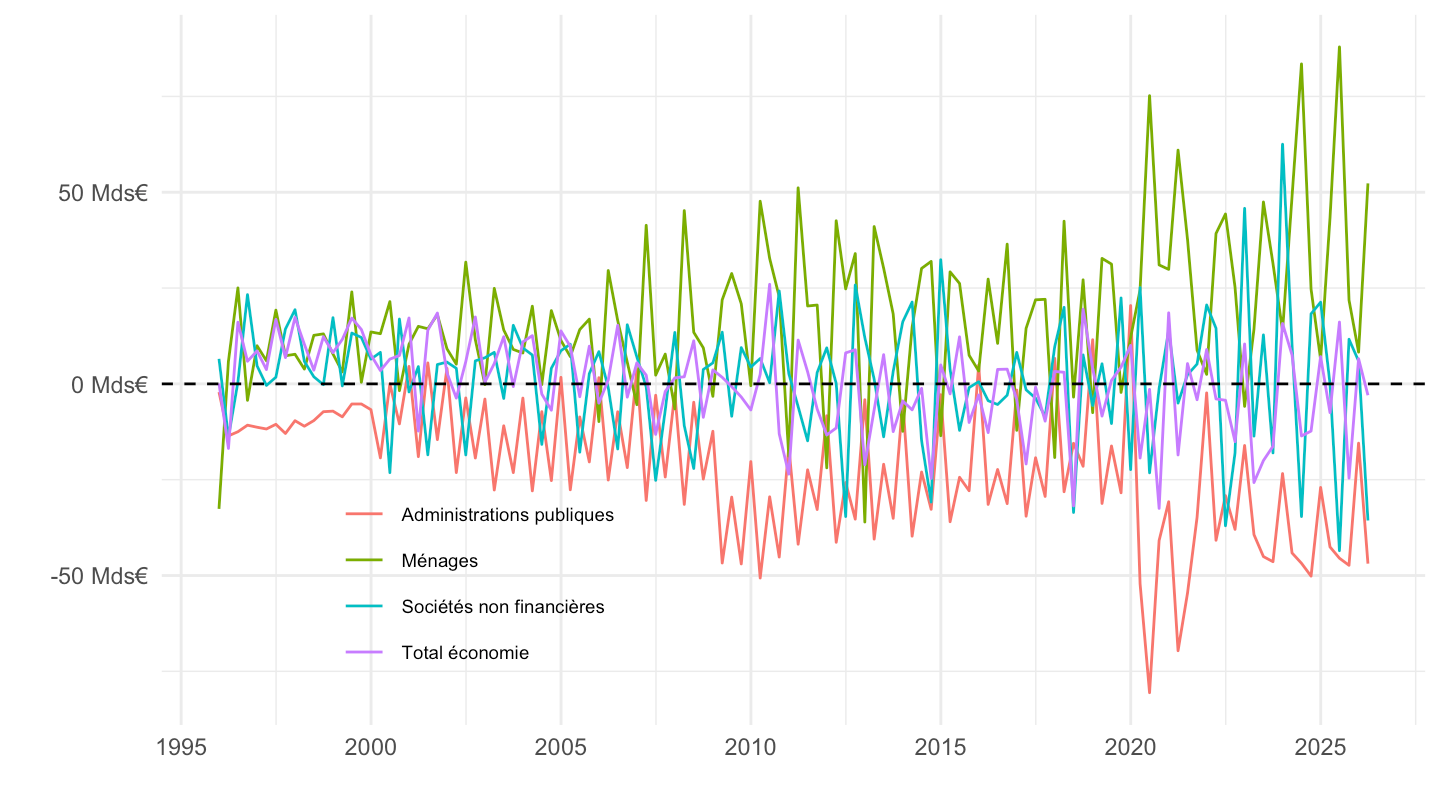
CNF |>

  filter(variable %in% c("CNF.Q.N.FR.W0.S11.S1.N.N.B9F.F._Z._Z.XDC._T.S.V.N._T",
                          "CNF.Q.N.FR.W0.S1M.S1.N.N.B9F.F._Z._Z.XDC._T.S.V.N._T",
                          "CNF.Q.N.FR.W0.S13.S1.N.N.B9F.F._Z._Z.XDC._T.S.V.N._T",
                          "CNF.Q.N.FR.W0.S1.S1.N.N.B9F.F._Z._Z.XDC._T.S.V.N._T")) |>
  filter(date >= as.Date("2015-01-01")) |>
  mutate(Sector = case_when(REF_SECTOR == "S11" ~ "Non-financial corporations",
                              REF_SECTOR == "S1M" ~ "Households",
                              REF_SECTOR == "S13" ~ "General government",
                              REF_SECTOR == "S1" ~ "Total economy"),
         value = value/1000) |>
  ggplot() + geom_line(aes(x = date, y = value, color = Sector)) +
  geom_point(aes(x = date, y = value, color = Sector)) +
  geom_hline(yintercept = 0, linetype = "dashed", color = "black") +
  theme_minimal() + xlab("") + ylab("") +
  scale_x_date(breaks = "1 year",
               labels = date_format("%Y")) +
  scale_y_continuous(labels = dollar_format(accuracy = 1, prefix = "", suffix = " €bn")) +
  theme(legend.position = c(0.25, 0.15),
        legend.title = element_blank(),
        legend.text = element_text(size = 7),
        axis.text.x = element_text(angle = 45, vjust = 1, hjust = 1))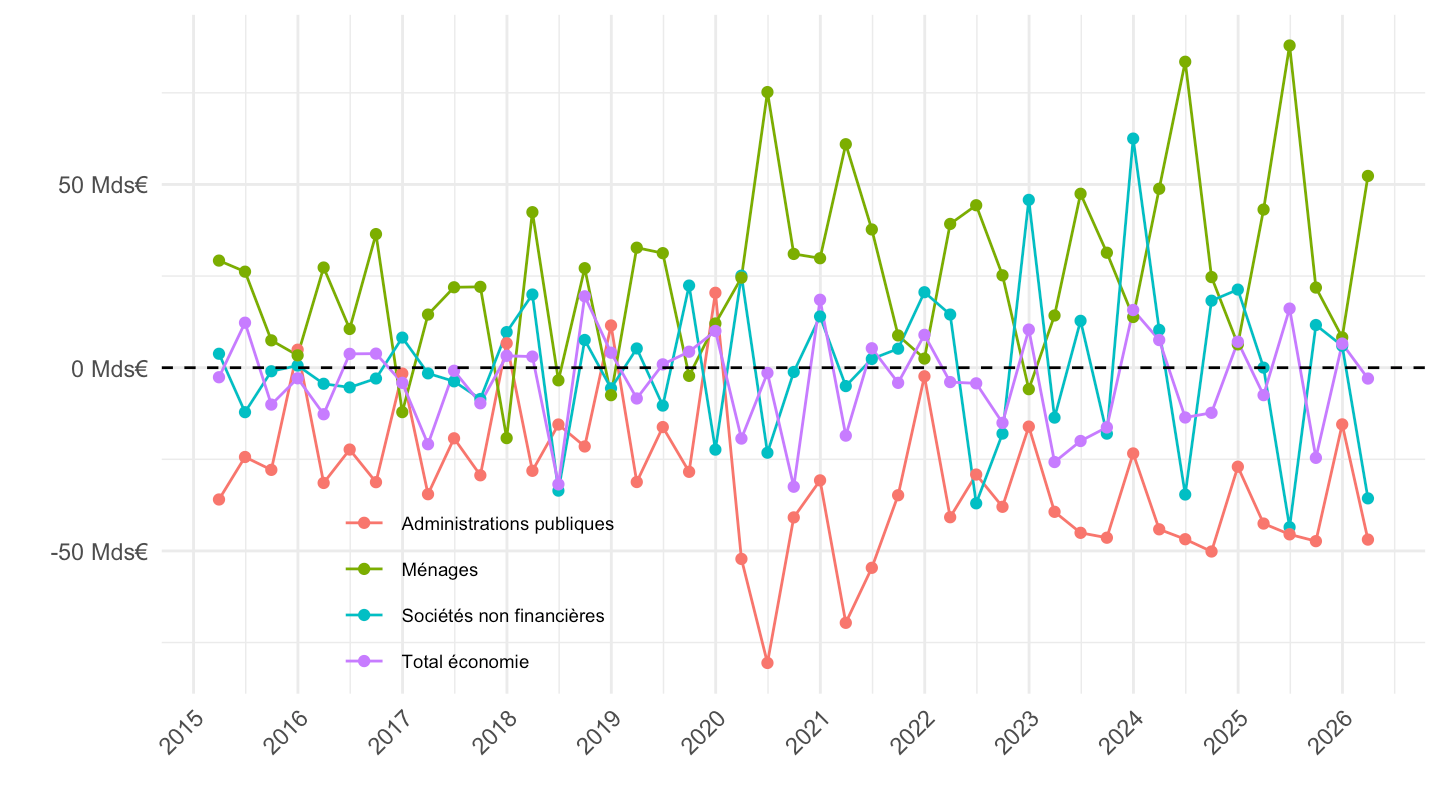
CNF |>

  filter(variable %in% c("CNF.Q.N.FR.W0.S11.S1.N.N.B9F.F._Z._Z.XDC._T.S.V.N._T",
                          "CNF.Q.N.FR.W0.S1M.S1.N.N.B9F.F._Z._Z.XDC._T.S.V.N._T",
                          "CNF.Q.N.FR.W0.S13.S1.N.N.B9F.F._Z._Z.XDC._T.S.V.N._T",
                          "CNF.Q.N.FR.W0.S1.S1.N.N.B9F.F._Z._Z.XDC._T.S.V.N._T")) |>
  filter(!is.na(value)) |>
  mutate(Sector = case_when(REF_SECTOR == "S11" ~ "Non-financial corporations",
                              REF_SECTOR == "S1M" ~ "Households",
                              REF_SECTOR == "S13" ~ "General government",
                              REF_SECTOR == "S1" ~ "Total economy"),
         value = value/1000) |>
  filter(date == max(date)) |>
  select(Sector, date, "€bn" = value) |>
  arrange(desc(`€bn`)) |>
print_table_conditional()| Sector | date | €bn |
|---|---|---|
| Households | 2026-03-31 | 52.320 |
| Total economy | 2026-03-31 | -2.966 |
| Non-financial corporations | 2026-03-31 | -35.664 |
| General government | 2026-03-31 | -46.910 |