
Last observation: 2025 (N = 1175)
First observation: 2006 (N = 4)
Last data update: 15 oct. 2026, 23:51
Last compile: 26 oct. 2026, 00:07
ACPR |>

  filter(variable %in% c("ACPR.A.BQ.PRUDENTIEL.RATIO_CET1.361._Z._Z.PHNC._Z.TOP6_AUT_GROUPES",
                          "ACPR.A.BQ.PRUDENTIEL.GB_COR_LEVIER_DISTRIB001_26.144._Z._Z.PHNC._Z.TOP6_AUT_GROUPES")) |>
  mutate(Serie = ifelse(MNE == "RATIO_CET1", "Ratio de solvabilité CET1", "Ratio de levier (médiane)"),
         value = value/100) |>
  ggplot() + geom_line(aes(x = date, y = value, color = Serie)) +
  geom_point(aes(x = date, y = value, color = Serie)) +
  theme_minimal() + xlab("") + ylab("") +
  scale_x_date(breaks = seq(1960, 2100, 1) |> paste0("-01-01") |> as.Date(),
               labels = date_format("%Y")) +
  scale_y_continuous(labels = scales::percent_format(accuracy = 1)) +
  theme(legend.position = c(0.3, 0.85),
        legend.title = element_blank())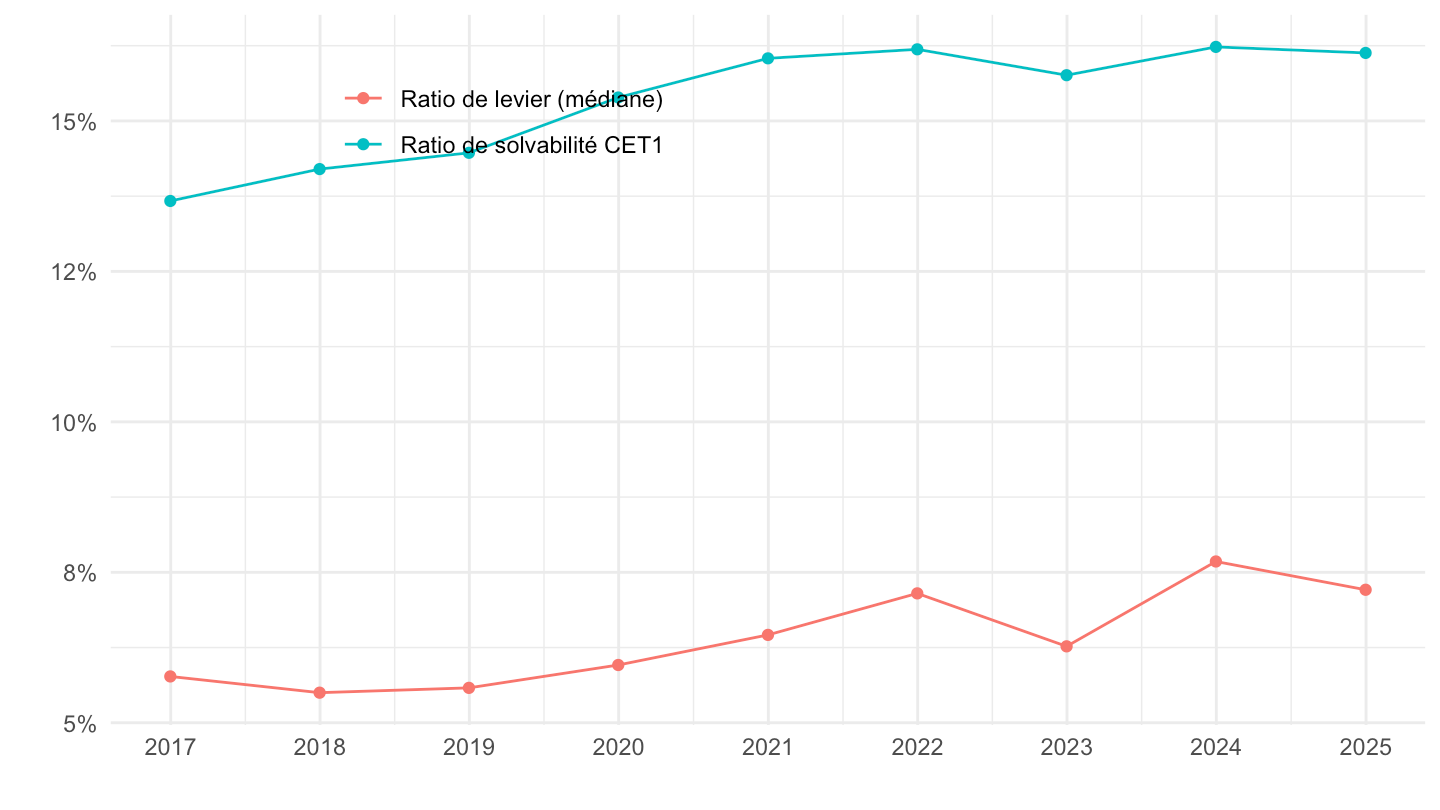
ACPR |>

  filter(variable %in% c("ACPR.A.BQ.PRUDENTIEL.GB_COR_LCR9719_50.140._Z._Z.PHNC._Z.TOP6_AUT_GROUPES",
                          "ACPR.A.BQ.PRUDENTIEL.NSFR1239300.633._Z._Z.PHNC._Z.TOP6_AUT_GROUPES")) |>
  mutate(Serie = ifelse(MNE == "GB_COR_LCR9719_50", "LCR (médiane)", "NSFR"),
         value = value/100) |>
  ggplot() + geom_line(aes(x = date, y = value, color = Serie)) +
  geom_point(aes(x = date, y = value, color = Serie)) +
  geom_hline(yintercept = 1, linetype = "dashed", color = "black") +
  theme_minimal() + xlab("") + ylab("") +
  scale_x_date(breaks = seq(1960, 2100, 1) |> paste0("-01-01") |> as.Date(),
               labels = date_format("%Y")) +
  scale_y_continuous(labels = scales::percent_format(accuracy = 1)) +
  theme(legend.position = c(0.3, 0.85),
        legend.title = element_blank())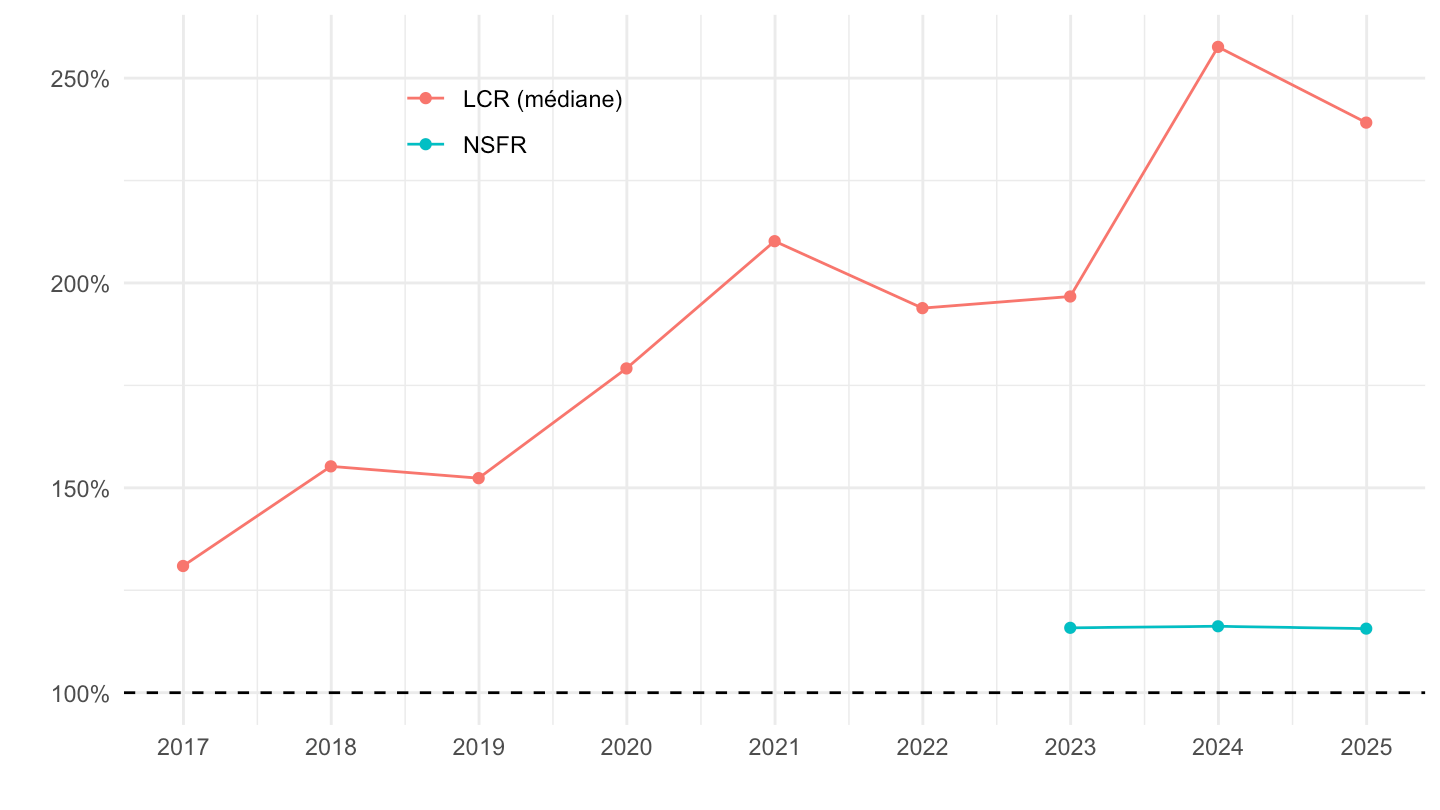
ACPR |>

  filter(variable %in% c("ACPR.A.BQ.PRUDENTIEL.RATIO_CET1.361._Z._Z.PHNC._Z.TOP6_AUT_GROUPES",
                          "ACPR.A.BQ.PRUDENTIEL.GB_COR_LEVIER_DISTRIB001_26.144._Z._Z.PHNC._Z.TOP6_AUT_GROUPES",
                          "ACPR.A.BQ.PRUDENTIEL.GB_COR_LCR9719_50.140._Z._Z.PHNC._Z.TOP6_AUT_GROUPES",
                          "ACPR.A.BQ.PRUDENTIEL.NSFR1239300.633._Z._Z.PHNC._Z.TOP6_AUT_GROUPES")) |>
  mutate(Serie = case_when(MNE == "RATIO_CET1" ~ "Ratio de solvabilité CET1",
                            MNE == "GB_COR_LEVIER_DISTRIB001_26" ~ "Ratio de levier (médiane)",
                            MNE == "GB_COR_LCR9719_50" ~ "LCR (médiane)",
                            MNE == "NSFR1239300" ~ "NSFR")) |>
  filter(date == max(date)) |>
  select(Serie, date, value) |>
  arrange(Serie) |>
print_table_conditional()| Serie | date | value |
|---|---|---|
| LCR (médiane) | 2025-12-31 | 238.82 |
| NSFR | 2025-12-31 | 115.19 |
| Ratio de levier (médiane) | 2025-12-31 | 7.28 |
| Ratio de solvabilité CET1 | 2025-12-31 | 16.21 |
ACPR |>

  filter(MNE == "SCR",
         CONSOLIDATION == "SOLO",
         POPULATION %in% c("_Z", "VM", "NV", "BA", "RE")) |>
  mutate(Segment = case_when(POPULATION == "_Z" ~ "Ensemble du secteur",
                              POPULATION == "VM" ~ "Assurance vie",
                              POPULATION == "NV" ~ "Assurance non-vie",
                              POPULATION == "BA" ~ "Bancassureurs",
                              POPULATION == "RE" ~ "Réassurance et holdings"),
         value = value/100) |>
  ggplot() + geom_line(aes(x = date, y = value, color = Segment)) +
  geom_point(aes(x = date, y = value, color = Segment)) +
  geom_hline(yintercept = 1, linetype = "dashed", color = "black") +
  theme_minimal() + xlab("") + ylab("") +
  scale_x_date(breaks = seq(1960, 2100, 1) |> paste0("-01-01") |> as.Date(),
               labels = date_format("%Y")) +
  scale_y_continuous(labels = scales::percent_format(accuracy = 1)) +
  theme(legend.position = c(0.25, 0.25),
        legend.title = element_blank())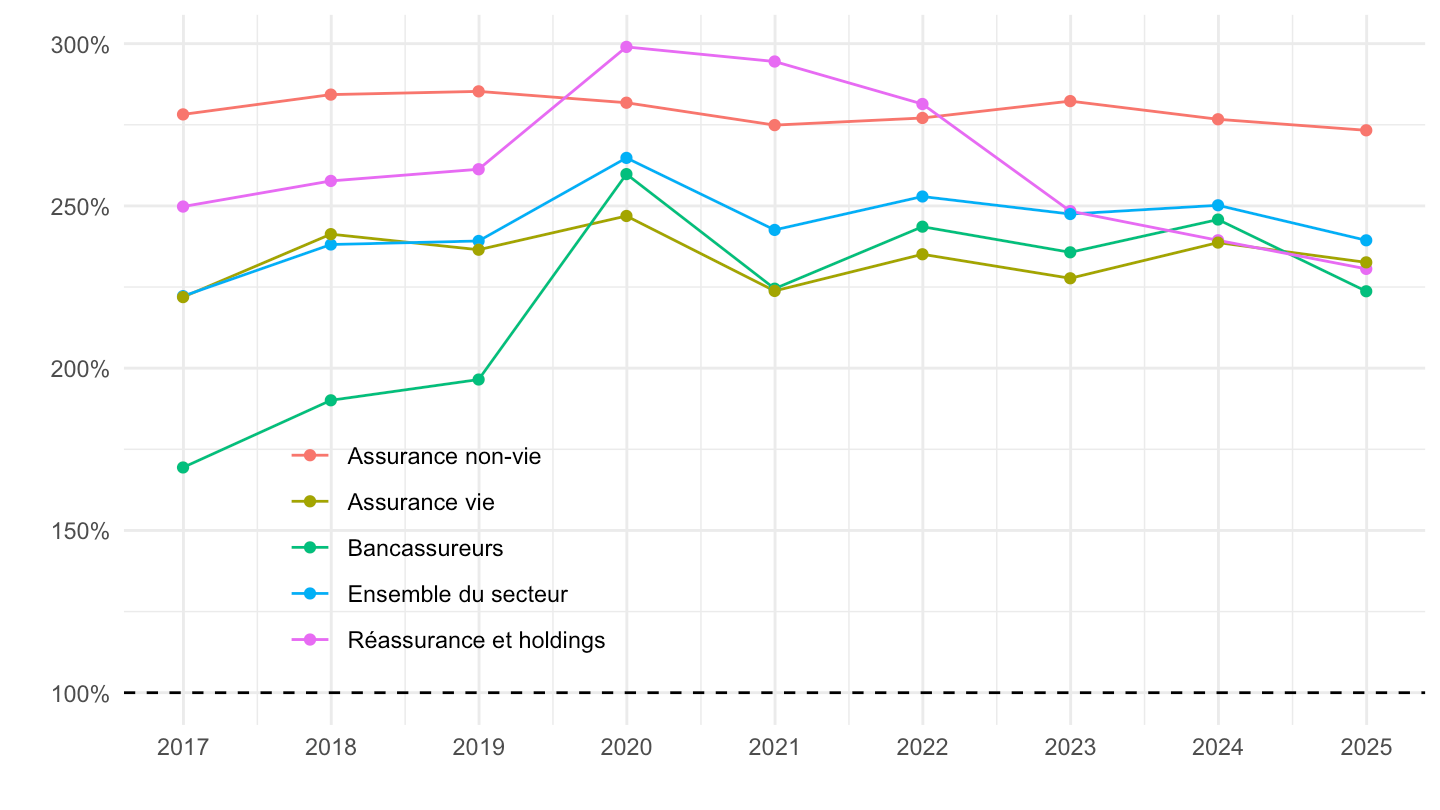
ACPR |>

  filter(MNE == "SCR",
         CONSOLIDATION == "SOLO",
         POPULATION %in% c("_Z", "VM", "NV", "BA", "RE")) |>
  mutate(Segment = case_when(POPULATION == "_Z" ~ "Ensemble du secteur",
                              POPULATION == "VM" ~ "Assurance vie",
                              POPULATION == "NV" ~ "Assurance non-vie",
                              POPULATION == "BA" ~ "Bancassureurs",
                              POPULATION == "RE" ~ "Réassurance et holdings")) |>
  filter(date == max(date)) |>
  select(Segment, date, value) |>
  arrange(desc(value)) |>
print_table_conditional()| Segment | date | value |
|---|---|---|
| Assurance non-vie | 2024-12-31 | 273.3 |
| Ensemble du secteur | 2024-12-31 | 239.4 |
| Assurance vie | 2024-12-31 | 232.6 |
| Réassurance et holdings | 2024-12-31 | 230.6 |
| Bancassureurs | 2024-12-31 | 223.7 |