Last observation: 2027 (N = 328)
First observation: 1960 (N = 1968)
Last data update: 01 oct. 2026, 22:36
Last compile: 24 oct. 2026, 00:04
General government net lending and gross debt (Maastricht, % of GDP). Black: latest vintage.
vintages |>
  filter(VAR == "UBLG", COU %in% countries_4) |>
  mutate(value = value / 100) |>
  plot_vintage_paths("Net lending (% of GDP)", from = 2005)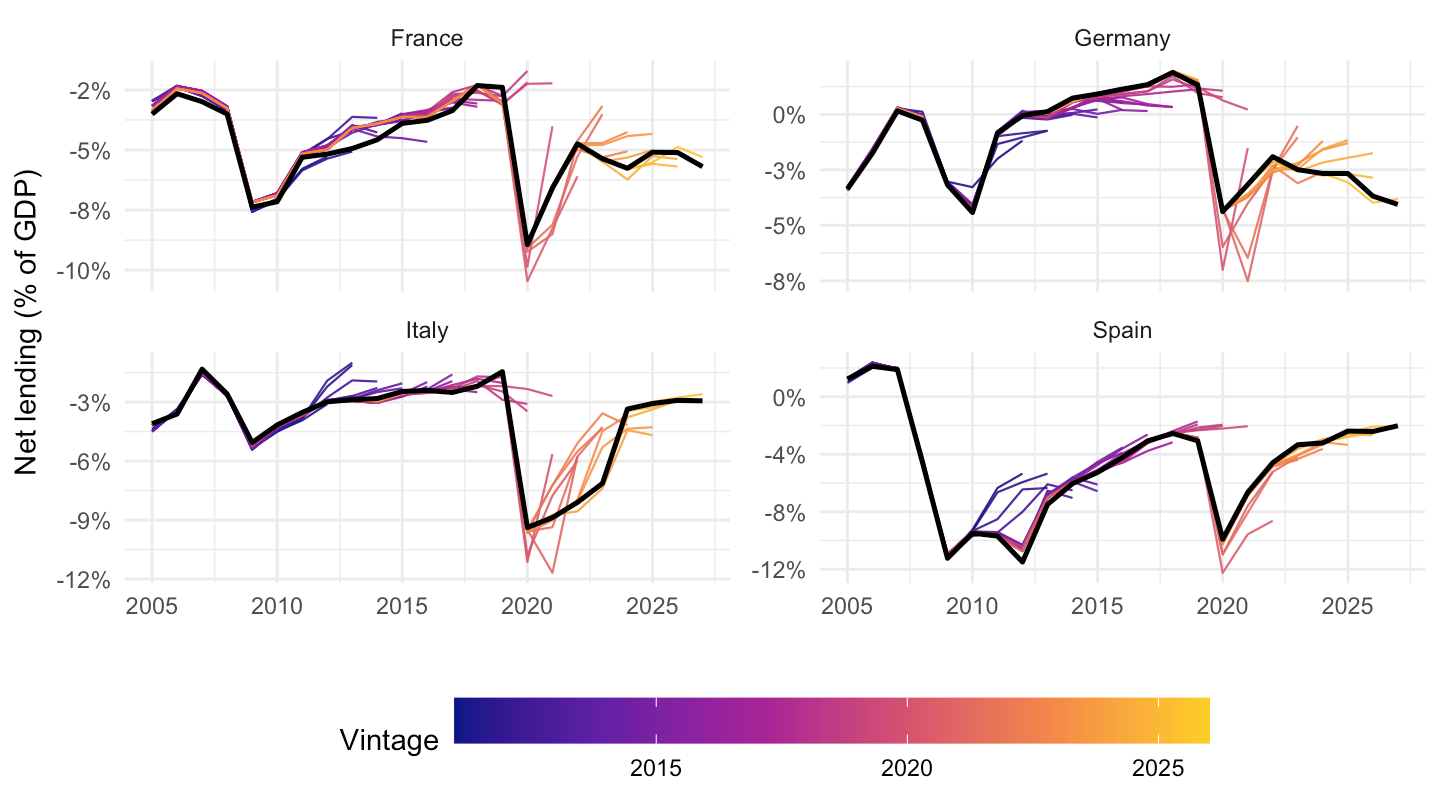
vintages |>
  filter(VAR == "UBLG", COU %in% countries_4) |>
  mutate(value = value / 100) |>
  plot_target_year(c(2020, 2022, 2024, 2026), "Net lending (% of GDP)")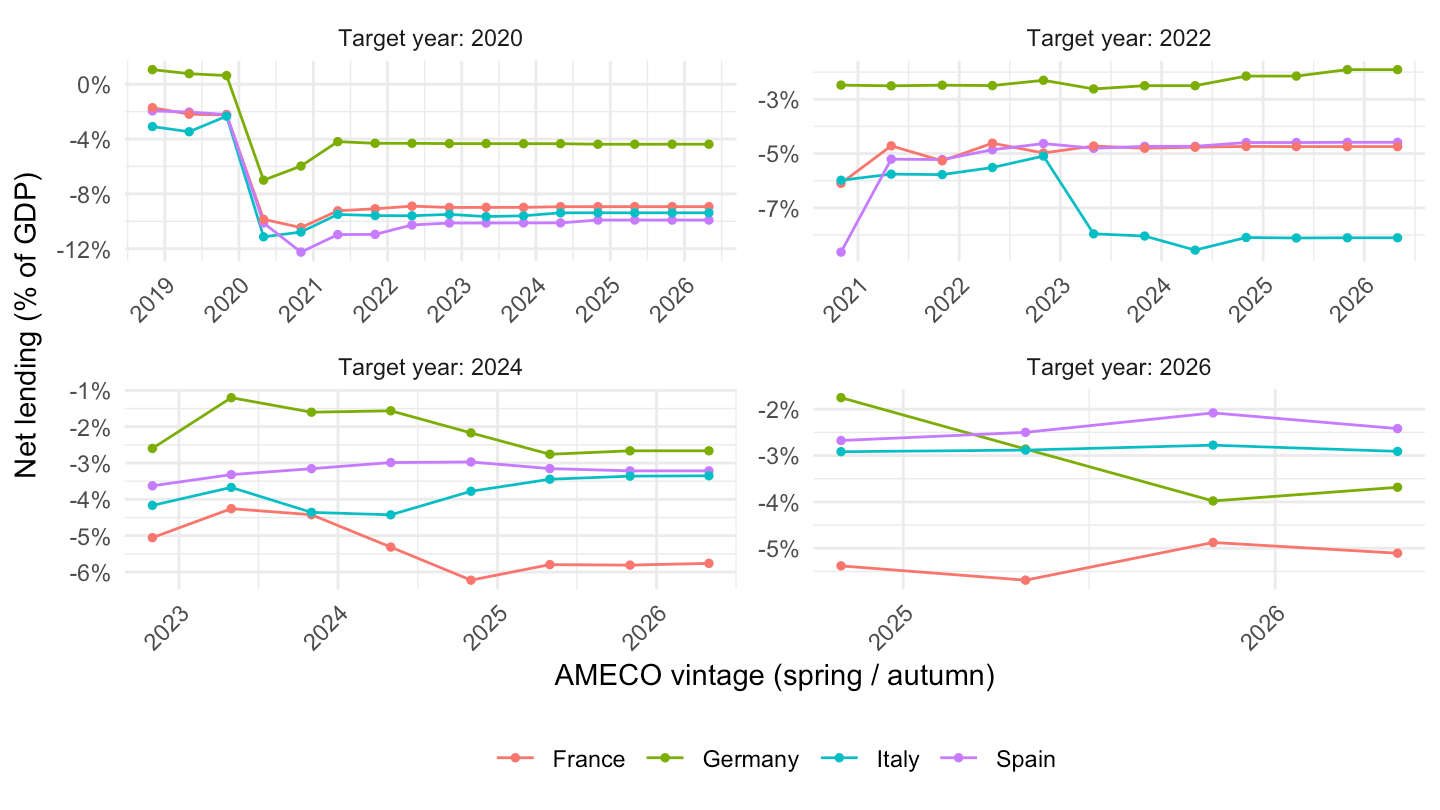
vintages |>
  filter(VAR == "UBLG", COU %in% countries_10) |>
  mutate(value = value / 100) |>
  error_heatmap(lag_years = 1, years = 2012:2025, limit = 5)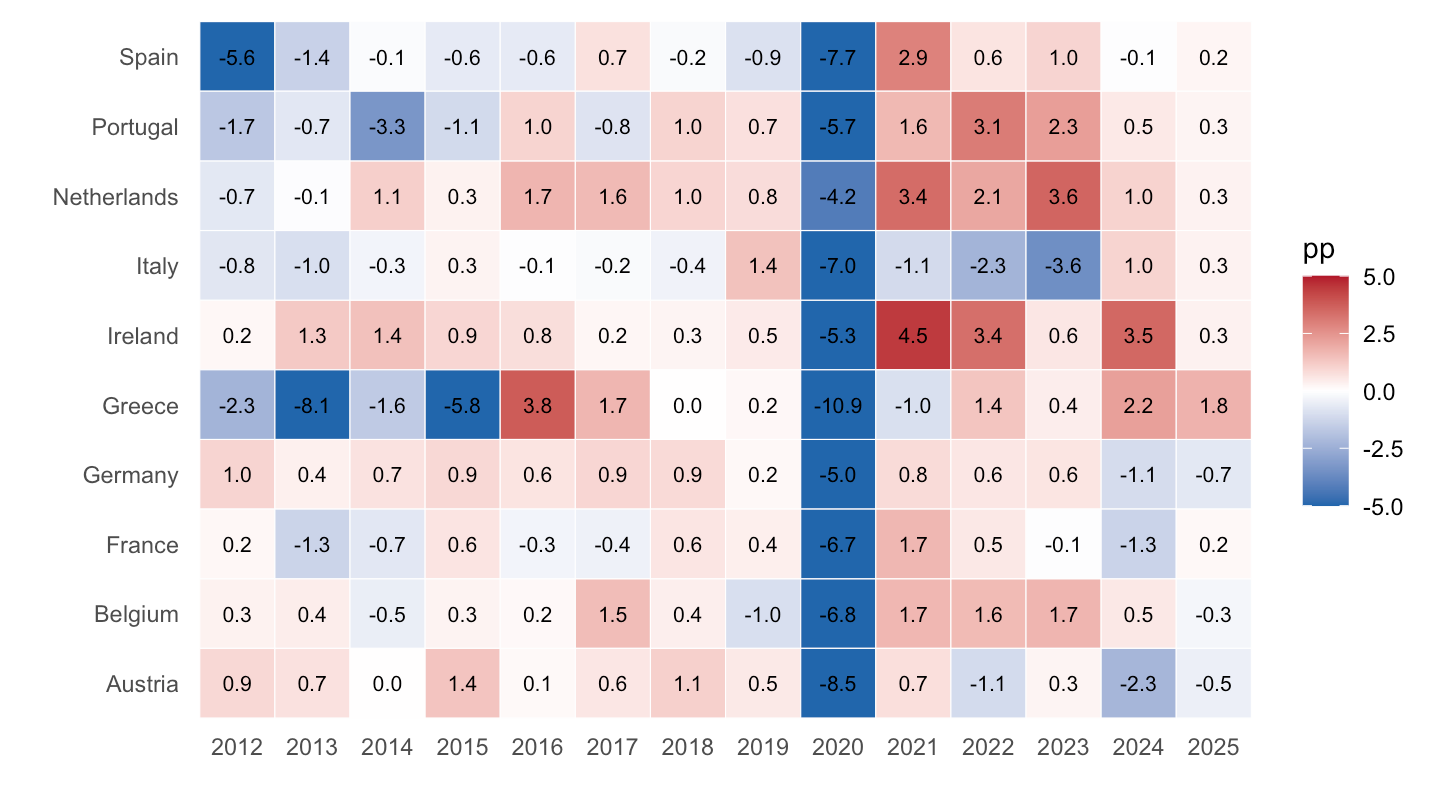
vintages |>
  filter(VAR == "UDGG", COU %in% c("FRA", "ITA", "GRC", "PRT")) |>
  mutate(value = value / 100) |>
  plot_vintage_paths("Gross debt (% of GDP)", from = 2005)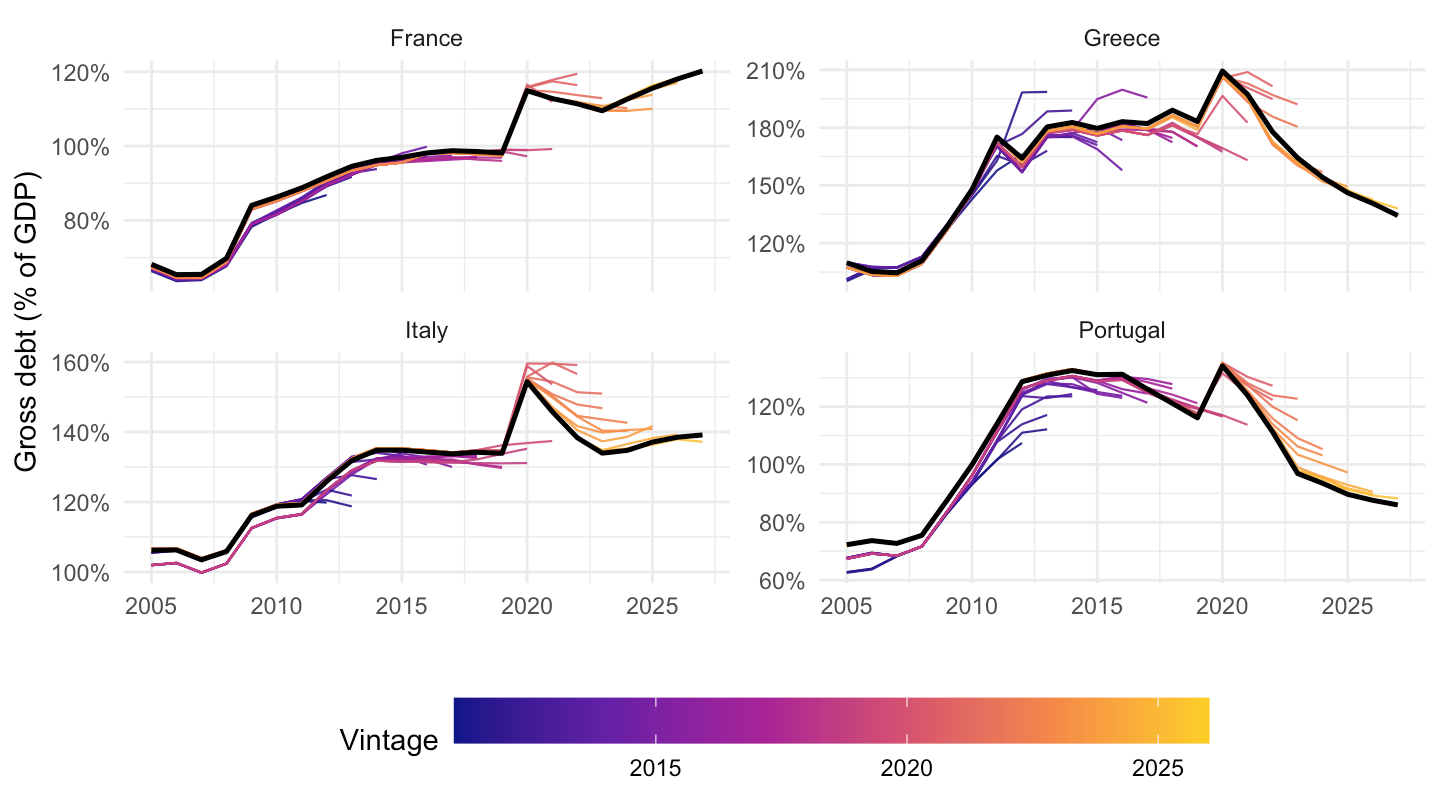
d <- vintages |> filter(VAR == "UDGG") |> mutate(value = value / 100)
inner_join(d |> filter(season == "autumn", year == vintage_year + 2) |> select(COUNTRY, year, projected = value),
           d |> filter(vintage == latest_vintage) |> select(COUNTRY, year, latest = value),
           by = c("COUNTRY", "year")) |>
  filter(year <= 2025) |>
  ggplot(aes(x = projected, y = latest, color = year)) + theme_minimal() +
  geom_abline(slope = 1, intercept = 0, linetype = "dashed") +
  geom_point(alpha = 0.8) + scale_color_viridis_c(option = "plasma", end = 0.9) +
  xlab("Debt (% of GDP) projected two years ahead (autumn t-2)") + ylab("Latest estimate") +
  scale_x_continuous(labels = percent_format(accuracy = 1)) +
  scale_y_continuous(labels = percent_format(accuracy = 1))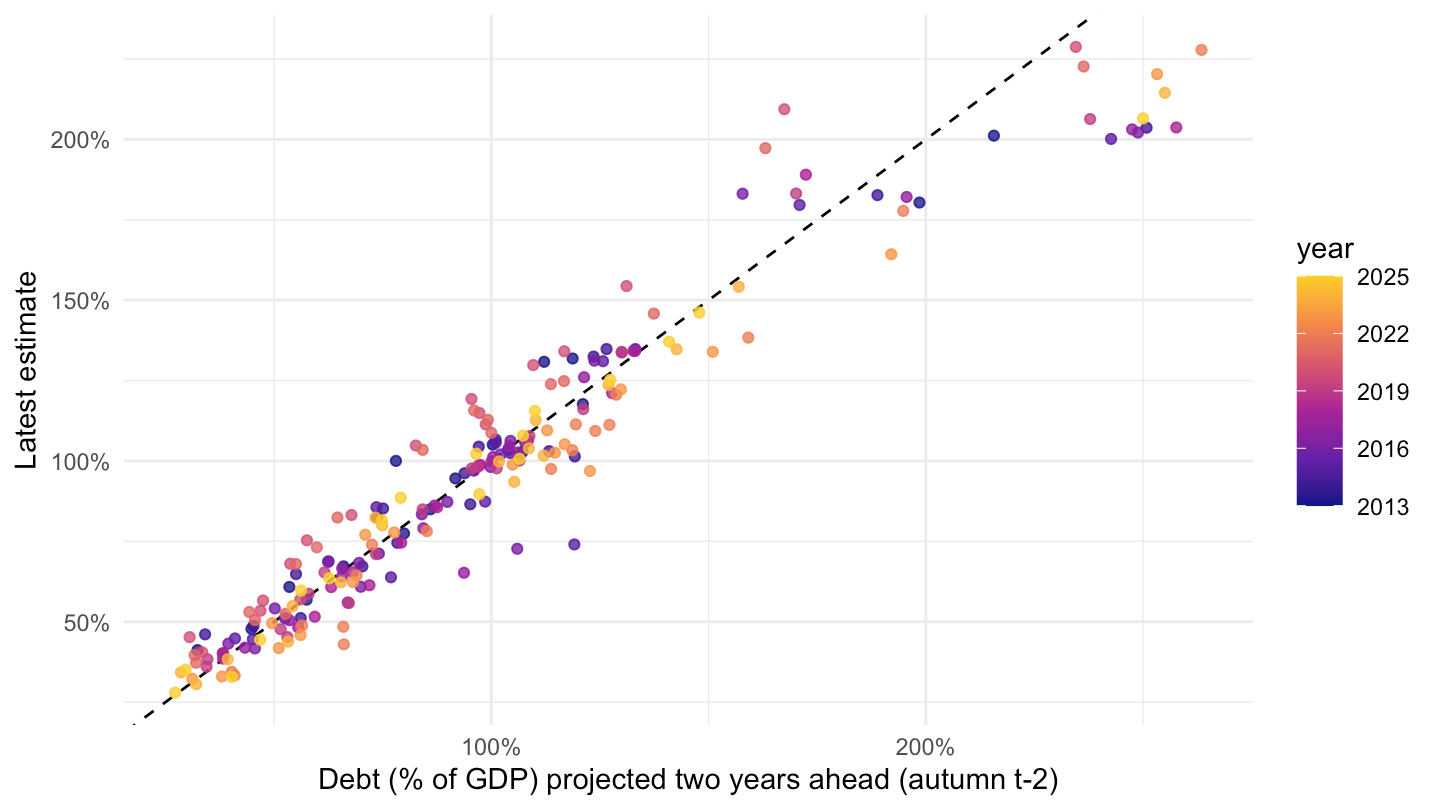
vintages |>
  filter(VAR == "UBCA", COU %in% countries_4) |>
  mutate(value = value / 100) |>
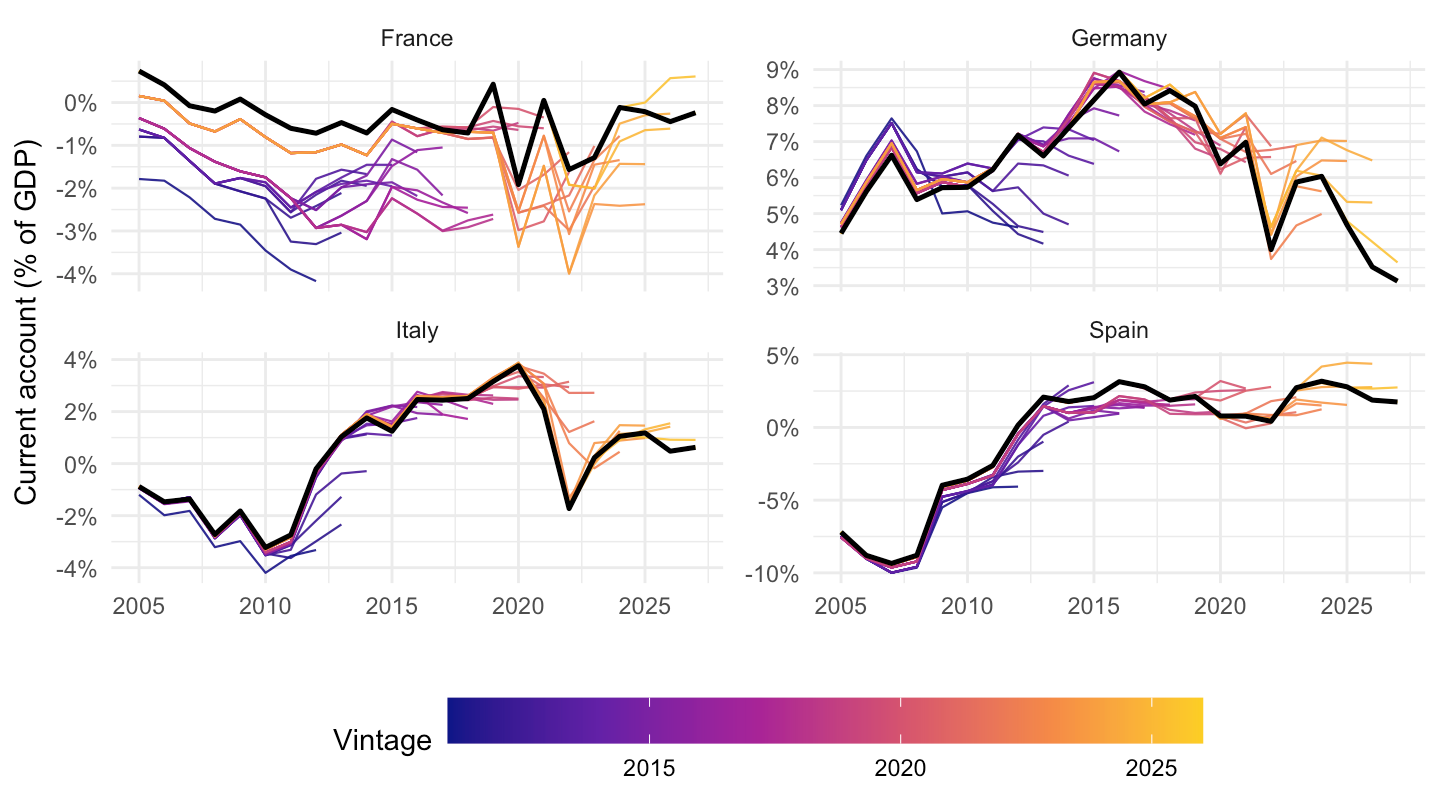
  plot_vintage_paths("Current account (% of GDP)", from = 2005)