Last observation: 2027 (N = 328)
First observation: 1960 (N = 1968)
Last data update: 01 oct. 2026, 22:36
Last compile: 24 oct. 2026, 00:03
The NAWRU (non-accelerating wage rate of unemployment) is the Commission’s estimate of structural unemployment; it is re-estimated in every vintage. Black: latest vintage.
vintages |>
  filter(VAR == "ZNAWRU", COU %in% c("FRA", "ITA", "ESP", "GRC")) |>
  mutate(value = value / 100) |>
  plot_vintage_paths("NAWRU", from = 2000)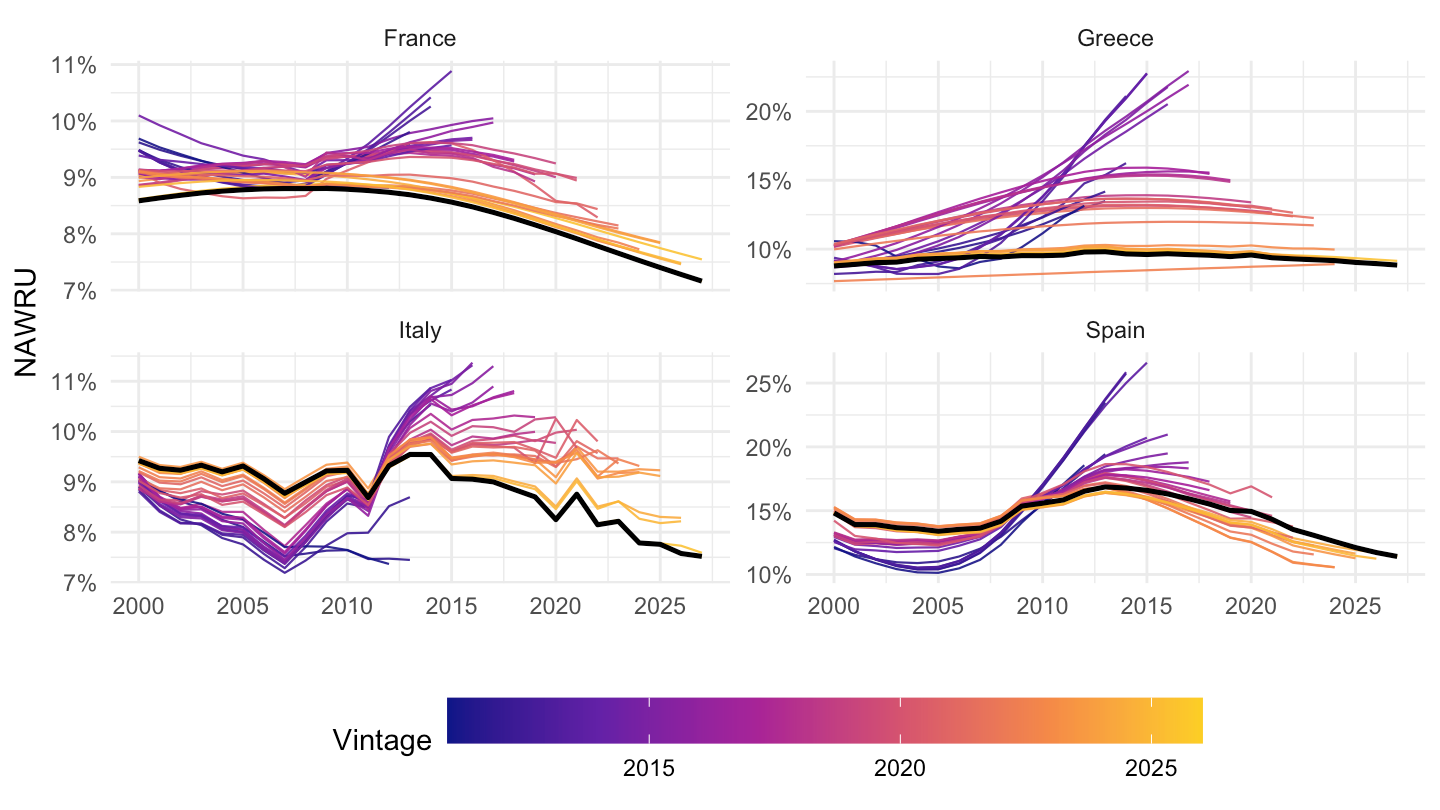
u <- vintages |> filter(VAR == "ZUTN", vintage == latest_vintage) |> select(COUNTRY, date, unemployment = value)
nawru_latest <- vintages |> filter(VAR == "ZNAWRU", vintage == latest_vintage) |> select(COUNTRY, date, `NAWRU, latest` = value)
nawru_rt <- vintages |> filter(VAR == "ZNAWRU", season == "autumn", year == vintage_year) |> select(COUNTRY, date, `NAWRU, real time` = value)
u |>
  left_join(nawru_latest, by = c("COUNTRY", "date")) |>
  left_join(nawru_rt, by = c("COUNTRY", "date")) |>
  filter(COUNTRY %in% c("France", "Italy", "Spain", "Germany"), date >= "2000-01-01", date <= "2025-01-01") |>
  pivot_longer(c(unemployment, `NAWRU, latest`, `NAWRU, real time`), names_to = "series") |>
  mutate(series = ifelse(series == "unemployment", "Unemployment rate", series), value = value / 100) |>
  ggplot(aes(x = date, y = value, color = series, linetype = series)) + theme_minimal() +
  geom_line() + facet_wrap(~COUNTRY, scales = "free_y") + xlab("") + ylab("") +
  scale_color_manual(values = c("black", "#2166ac", "#d95f02")) +
  scale_linetype_manual(values = c("solid", "solid", "dashed")) +
  scale_x_date(breaks = seq(1920, 2100, 5) |> paste0("-01-01") |> as.Date(), labels = date_format("%Y")) +
  scale_y_continuous(labels = percent_format(accuracy = 1)) +
  theme(legend.position = "bottom", legend.title = element_blank())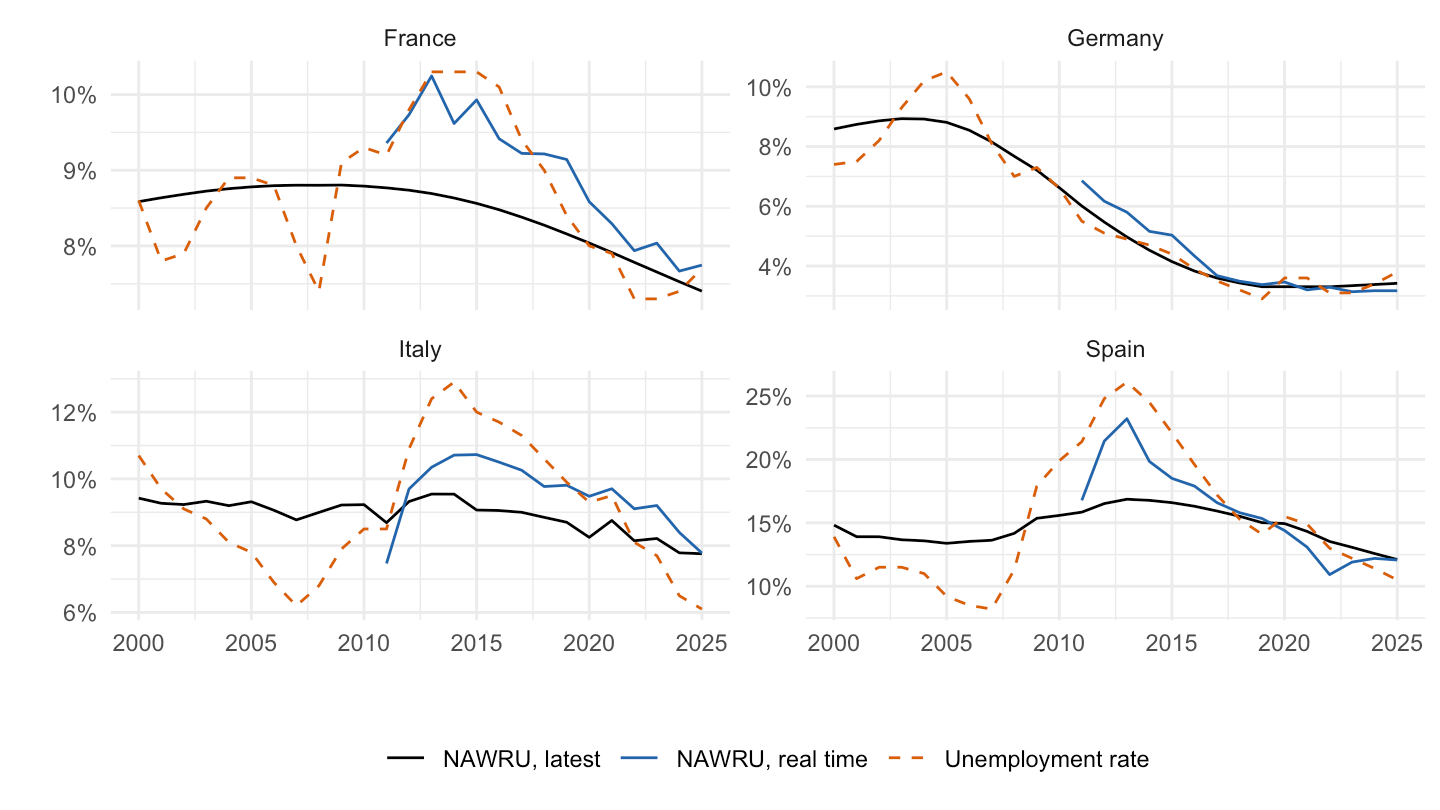
u_rt <- vintages |> filter(VAR == "ZUTN", season == "autumn", year == vintage_year) |> select(COUNTRY, date, u_rt = value)
nawru_rt |>
  inner_join(u_rt, by = c("COUNTRY", "date")) |>
  inner_join(nawru_latest |> inner_join(u, by = c("COUNTRY", "date")), by = c("COUNTRY", "date")) |>
  transmute(COUNTRY, date,
            `Real time` = (u_rt - `NAWRU, real time`) / 100,
            Latest = (unemployment - `NAWRU, latest`) / 100) |>
  pivot_longer(c(`Real time`, Latest)) |>
  filter(COUNTRY %in% c("France", "Italy", "Spain", "Germany"), date >= "2000-01-01") |>
  ggplot(aes(x = date, y = value, color = name)) + theme_minimal() +
  geom_hline(yintercept = 0, linewidth = 0.3) + geom_line() + facet_wrap(~COUNTRY) + xlab("") +
  ylab("Unemployment gap (U - NAWRU)") +
  scale_color_manual(values = c("black", "#d95f02")) +
  scale_x_date(breaks = seq(1920, 2100, 5) |> paste0("-01-01") |> as.Date(), labels = date_format("%Y")) +
  scale_y_continuous(labels = percent_format(accuracy = 1)) +
  theme(legend.position = "bottom", legend.title = element_blank())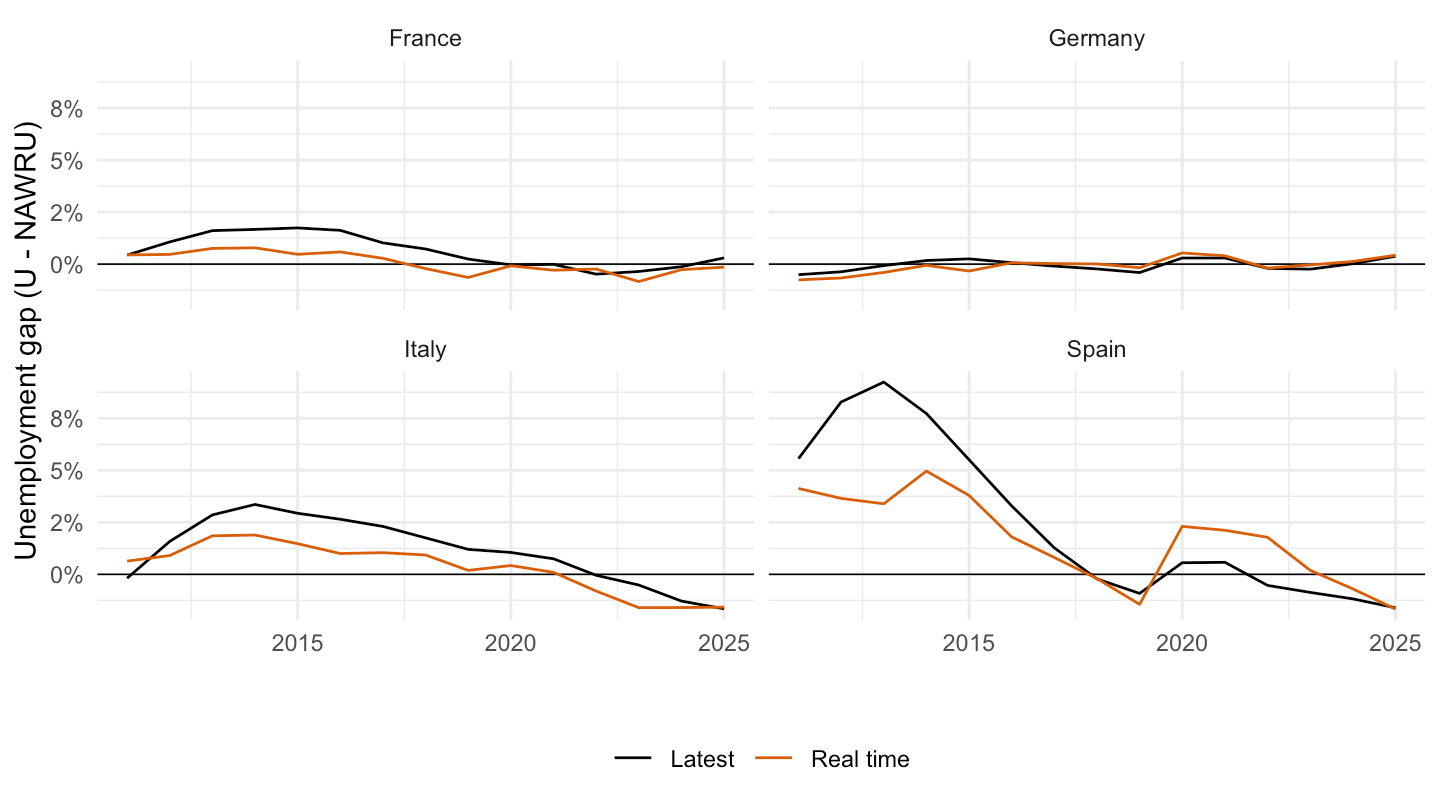
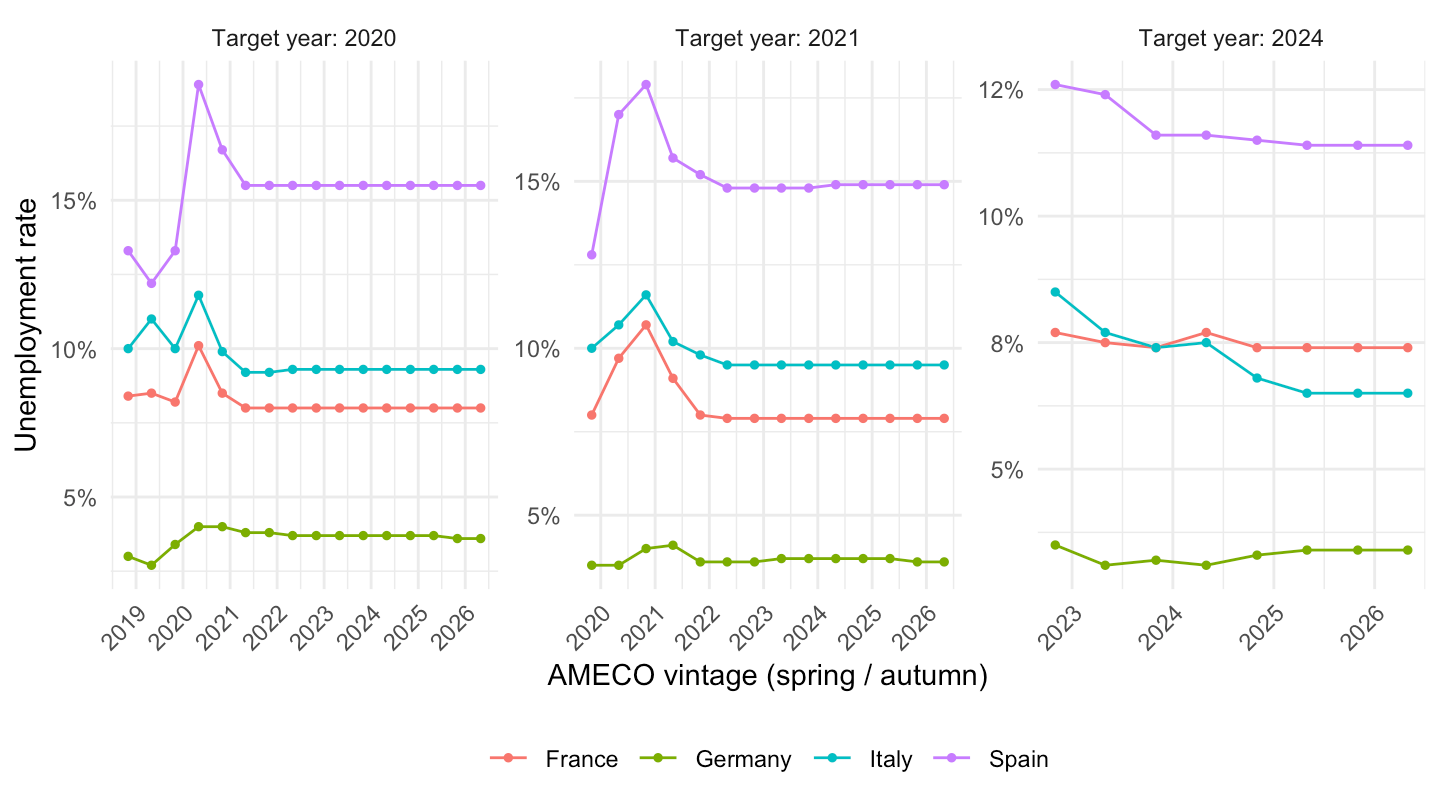
vintages |>
  filter(VAR == "ZUTN", COU %in% countries_4) |>
  mutate(value = value / 100) |>
  plot_target_year(c(2020, 2021, 2024), "Unemployment rate")