Code
PMGN %>%
  group_by(series_code, series_name) %>%
  summarise(Nobs = n()) %>%
print_table_conditional()Data - AMECO
PMGN %>%
group_by(series_code, series_name) %>%
summarise(Nobs = n()) %>%
print_table_conditional()PMGN %>%
group_by(unit, Unit) %>%
summarise(Nobs = n()) %>%
print_table_conditional()| unit | Unit | Nobs |
|---|---|---|
| 2015-100-weighted-mean-of-t-t-1-national-growth-rates-weights-current-prices-in-ecu-eur | (2015 = 100), Weighted mean of t/t-1 national growth rates (weights: current prices in ECU/EUR) | 252 |
| 2015-100-weighted-mean-of-t-t-1-national-growth-rates-weights-current-prices-in-pps | (2015 = 100), Weighted mean of t/t-1 national growth rates (weights: current prices in PPS) | 252 |
| ecu-eur-2015-100 | ECU/EUR: 2015 = 100 | 2709 |
| ecu-eur-2015-100-weighted-mean-of-t-t-1-national-growth-rates-weights-current-prices-in-ecu-eur | (ECU/EUR: 2015 = 100), Weighted mean of t/t-1 national growth rates (weights: current prices in ECU/EUR) | 252 |
| national-currency-2015-100 | (National currency: 2015 = 100) | 2709 |
PMGN %>%
  group_by(geo, Country) %>%
  arrange(period) %>%
  summarise(Nobs = n(),
            first = first(original_period),
            last = last(original_period)) %>%
  mutate(Flag = gsub(" ", "-", str_to_lower(Country)),
         Flag = paste0('<img src="../../icon/flag/vsmall/', Flag, '.png" alt="Flag">')) %>%
  select(Flag, everything()) %>%
{if (is_html_output()) datatable(., filter = 'top', rownames = F, escape = F) else .}PMGN %>%
filter(geo %in% c("eu27")) %>%
na.omit %>%
ggplot() + theme_minimal() + ylab("Price deflator imports of goods") + xlab("") +
geom_line(aes(x = period, y = value, color = Unit)) +
scale_color_manual(values = viridis(4)[1:3]) +
scale_x_date(breaks = seq(1920, 2025, 5) %>% paste0("-01-01") %>% as.Date,
labels = date_format("%y")) +
theme(legend.position = c(0.7, 0.20),
legend.title = element_blank()) +
scale_y_log10(breaks = seq(-60, 600, 10))
PMGN %>%
  filter(geo %in% c("eu27"),
         period >= as.Date("1985-01-01")) %>%
  na.omit %>%
  ggplot() + theme_minimal() + ylab("Price deflator imports of goods") + xlab("") +
  geom_line(aes(x = period, y = value, color = Unit)) +
  scale_color_manual(values = viridis(4)[1:3]) +
  scale_x_date(breaks = seq(1920, 2025, 5) %>% paste0("-01-01") %>% as.Date,
               labels = date_format("%y")) +
  theme(legend.position = c(0.7, 0.20),
        legend.title = element_blank()) +
  scale_y_log10(breaks = seq(-60, 600, 10))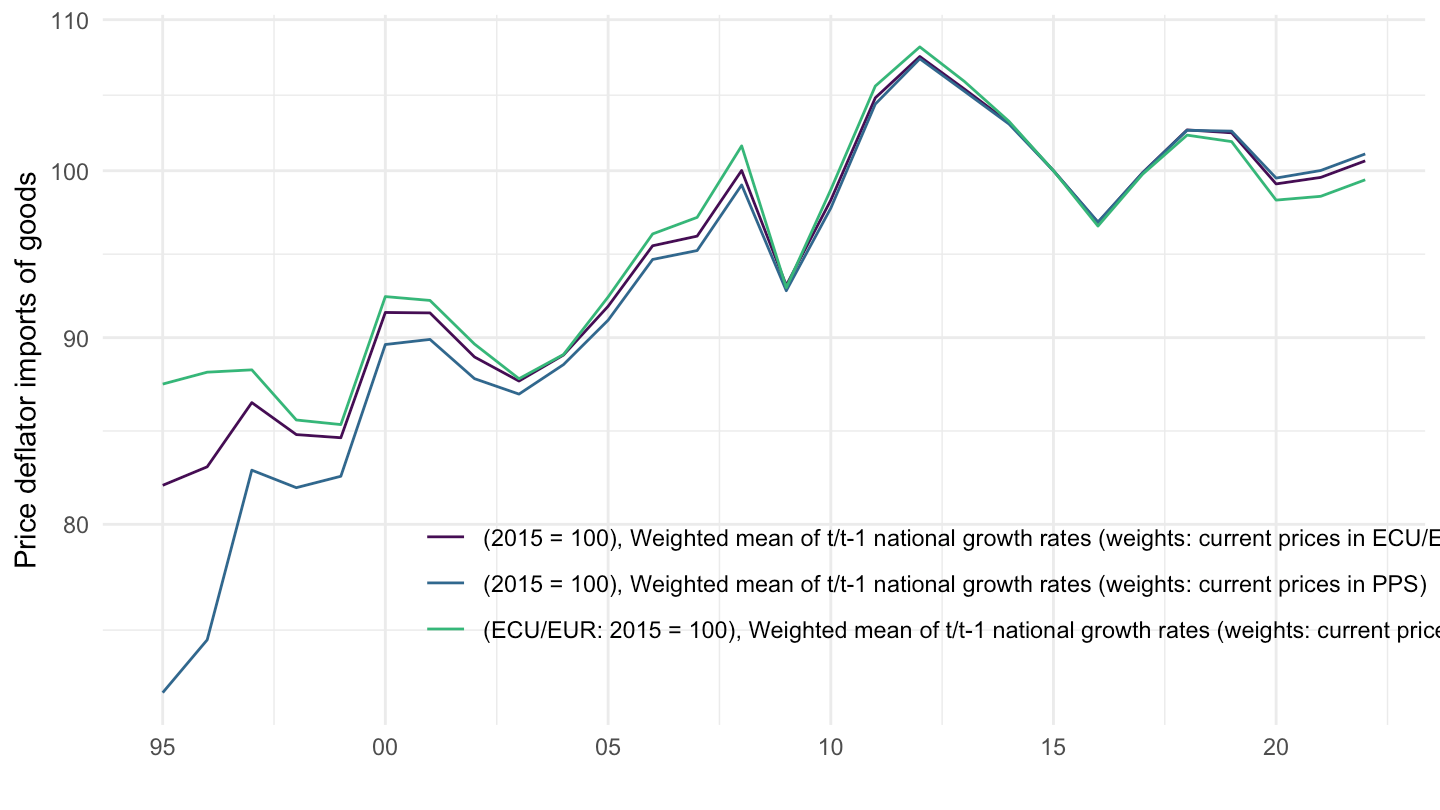
PMGN %>%
  filter(geo %in% c("eu27"),
         period >= as.Date("2000-01-01")) %>%
  na.omit %>%
  ggplot() + theme_minimal() + ylab("Price deflator imports of goods") + xlab("") +
  geom_line(aes(x = period, y = value, color = Unit)) +
  scale_color_manual(values = viridis(4)[1:3]) +
  scale_x_date(breaks = seq(1920, 2025, 5) %>% paste0("-01-01") %>% as.Date,
               labels = date_format("%y")) +
  theme(legend.position = c(0.7, 0.20),
        legend.title = element_blank()) +
  scale_y_log10(breaks = seq(-60, 600, 10))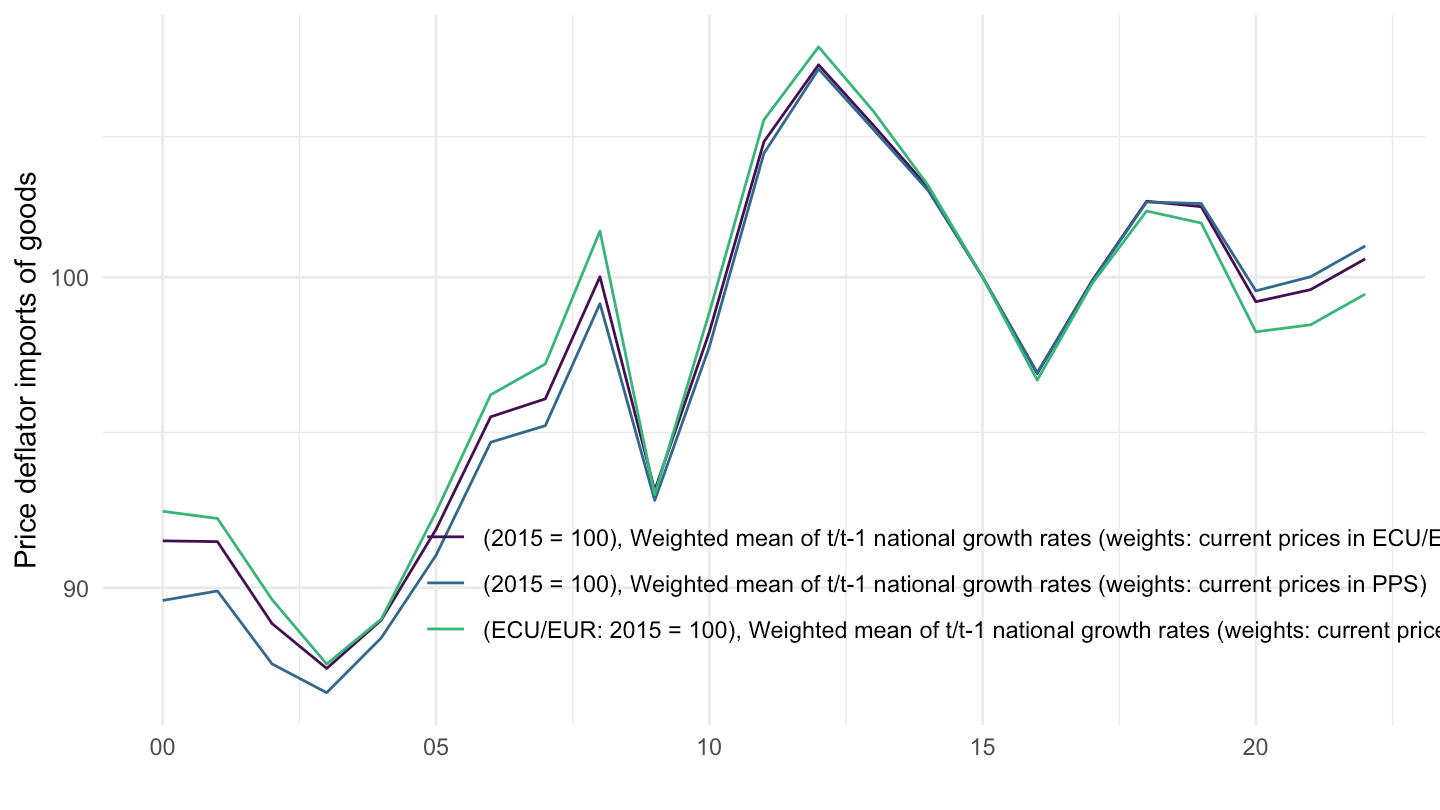
PMGN %>%
  filter(geo %in% c("che")) %>%
  ggplot() + theme_minimal() + ylab("Price deflator imports of goods") + xlab("") +
  geom_line(aes(x = period, y = value, color = Unit)) +
  scale_color_manual(values = viridis(3)[1:2]) +
  scale_x_date(breaks = seq(1920, 2025, 5) %>% paste0("-01-01") %>% as.Date,
               labels = date_format("%y")) +
  theme(legend.position = c(0.7, 0.20),
        legend.title = element_blank()) +
  scale_y_log10(breaks = seq(-60, 600, 10))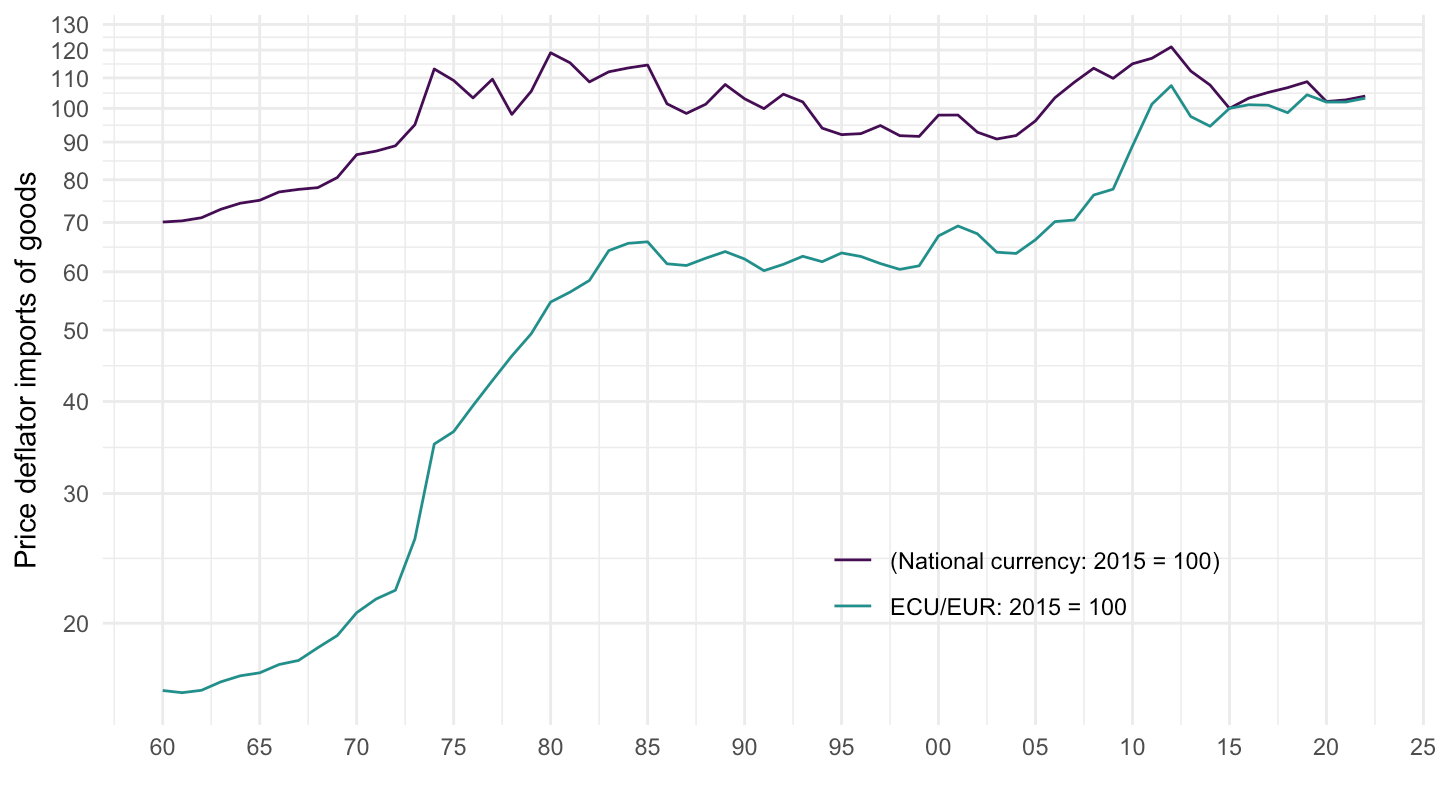
PMGN %>%
  filter(geo %in% c("che"),
         period >= as.Date("1985-01-01")) %>%
  ggplot() + theme_minimal() + ylab("Price deflator imports of goods") + xlab("") +
  geom_line(aes(x = period, y = value, color = Unit)) +
  scale_color_manual(values = viridis(3)[1:2]) +
  scale_x_date(breaks = seq(1920, 2025, 5) %>% paste0("-01-01") %>% as.Date,
               labels = date_format("%y")) +
  theme(legend.position = c(0.7, 0.20),
        legend.title = element_blank()) +
  scale_y_log10(breaks = seq(-60, 600, 10))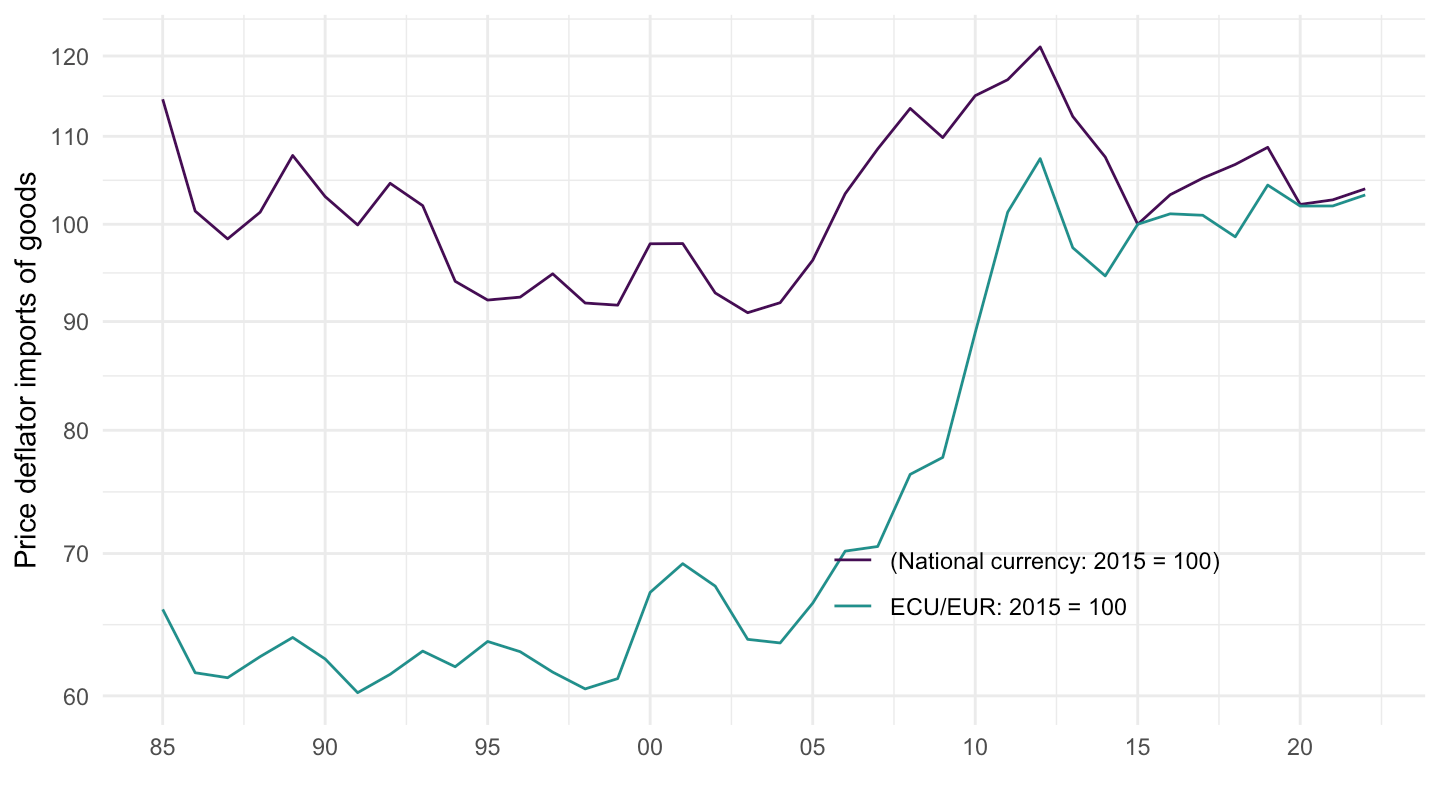
PMGN %>%
  filter(geo %in% c("che"),
         period >= as.Date("2000-01-01")) %>%
  ggplot() + theme_minimal() + ylab("Price deflator imports of goods") + xlab("") +
  geom_line(aes(x = period, y = value, color = Unit)) +
  scale_color_manual(values = viridis(3)[1:2]) +
  scale_x_date(breaks = seq(1920, 2025, 5) %>% paste0("-01-01") %>% as.Date,
               labels = date_format("%y")) +
  theme(legend.position = c(0.7, 0.20),
        legend.title = element_blank()) +
  scale_y_log10(breaks = seq(-60, 600, 10))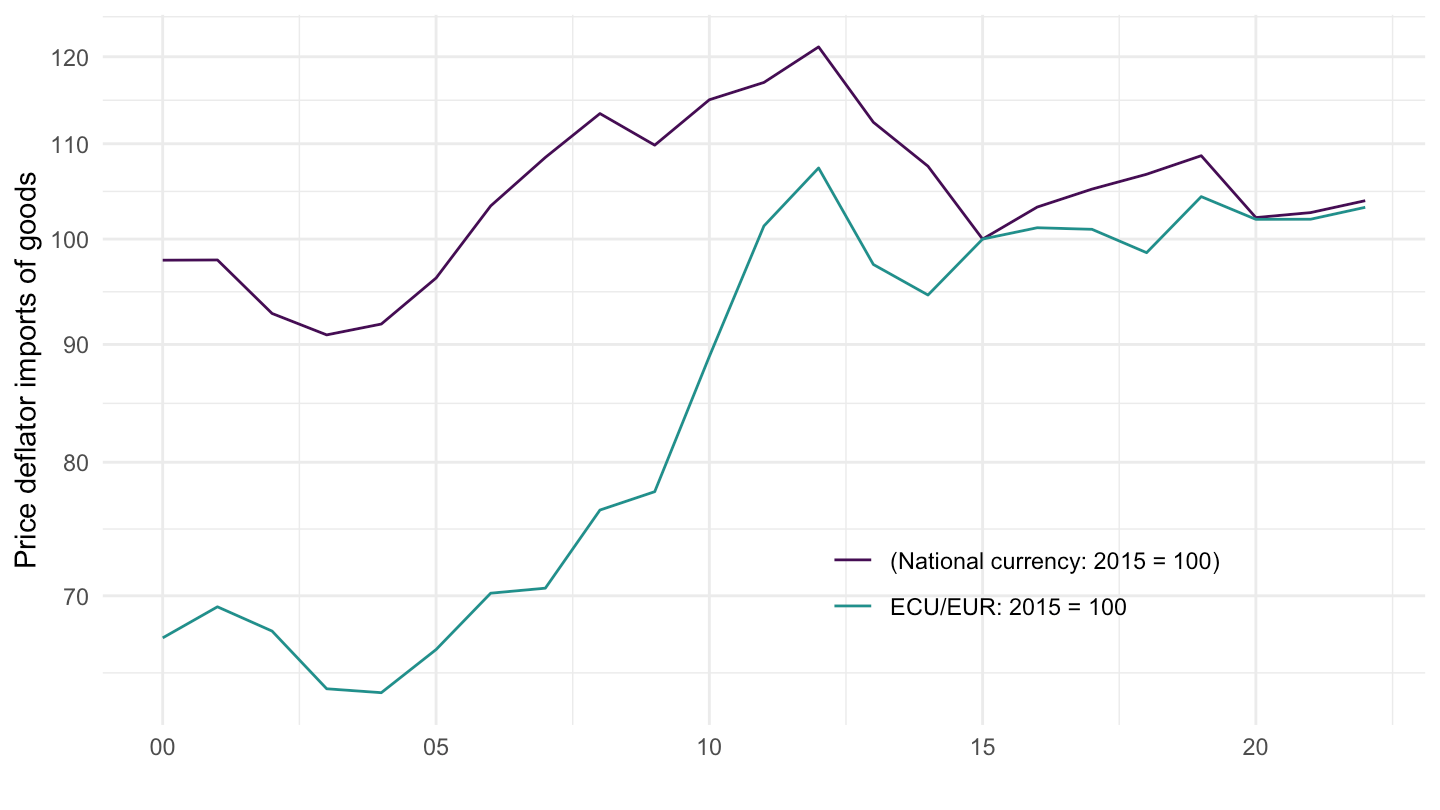
PMGN %>%
  filter(geo %in% c("jpn", "usa", "gbr", "che"),
         unit == "ecu-eur-2015-100") %>%
  na.omit %>%
  ggplot() + theme_minimal() + ylab("Price deflator imports of goods") + xlab("") +
  geom_line(aes(x = period, y = value, color = Country)) +
  scale_color_manual(values = c("#002395", "#009246", "#FF0000", "#FFC400")) +
  geom_image(data = . %>%
               filter(period == as.Date("1984-01-01")) %>%
               mutate(period = as.Date("1984-01-01"),
                      image = paste0("../../icon/flag/", str_to_lower(gsub(" ", "-", Country)), ".png")),
             aes(x = period, y = value, image = image), asp = 1.5) +
  scale_x_date(breaks = seq(1920, 2025, 5) %>% paste0("-01-01") %>% as.Date,
               labels = date_format("%y")) +
  theme(legend.position = "none") +
  scale_y_log10(breaks = seq(-60, 600, 10))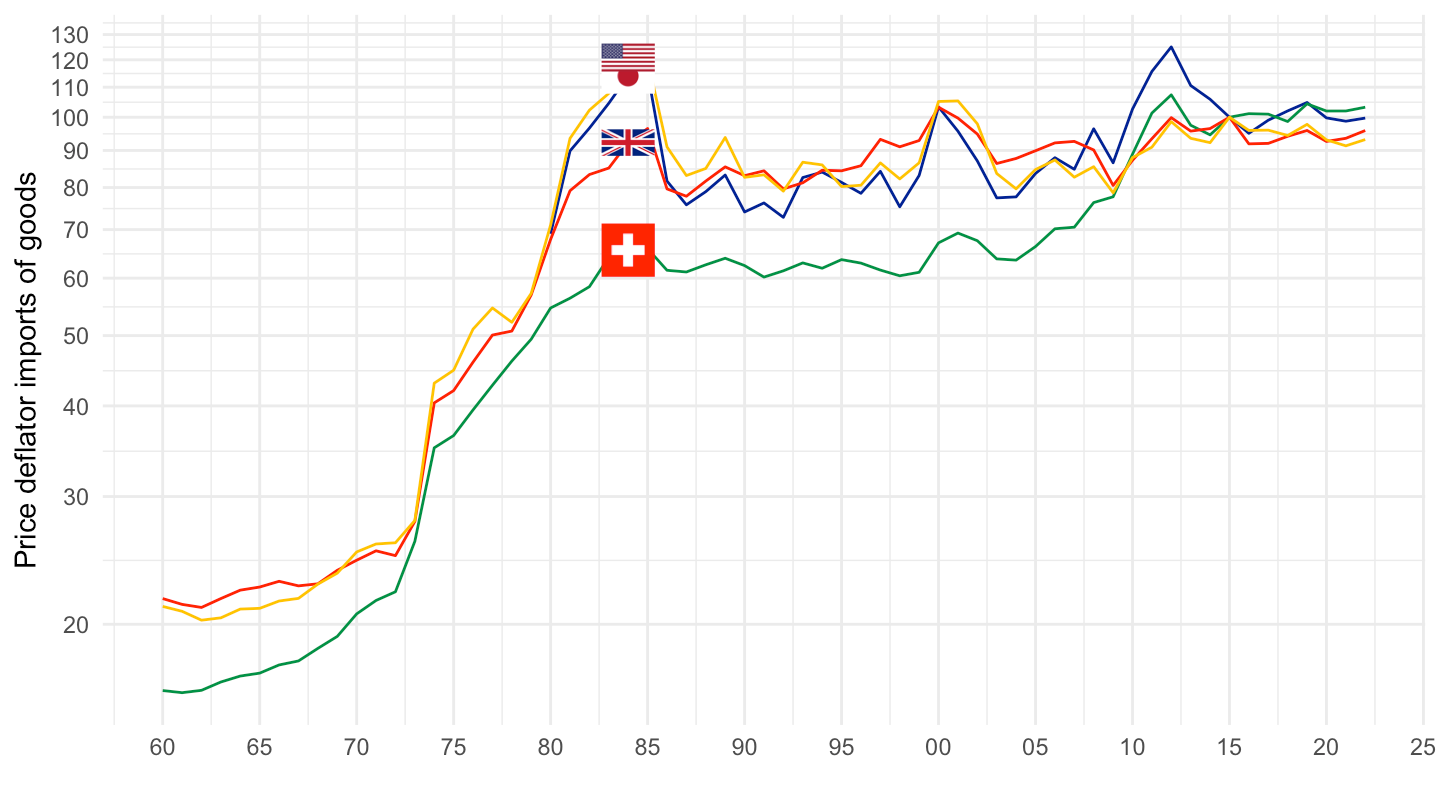
PMGN %>%
  filter(geo %in% c("fra", "prt", "ita", "esp"),
         unit == "ecu-eur-2015-100") %>%
  na.omit %>%
  ggplot() + theme_minimal() + ylab("Price deflator imports of goods") + xlab("") +
  geom_line(aes(x = period, y = value, color = Country)) +
  scale_color_manual(values = c("#002395", "#009246", "#FF0000", "#FFC400")) +
  geom_image(data = . %>%
               filter(period == as.Date("1965-01-01")) %>%
               mutate(period = as.Date("1965-01-01"),
                      image = paste0("../../icon/flag/", str_to_lower(Country), ".png")),
             aes(x = period, y = value, image = image), asp = 1.5) +
  scale_x_date(breaks = seq(1920, 2025, 5) %>% paste0("-01-01") %>% as.Date,
               labels = date_format("%y")) +
  theme(legend.position = "none") +
  scale_y_log10(breaks = seq(-60, 600, 10))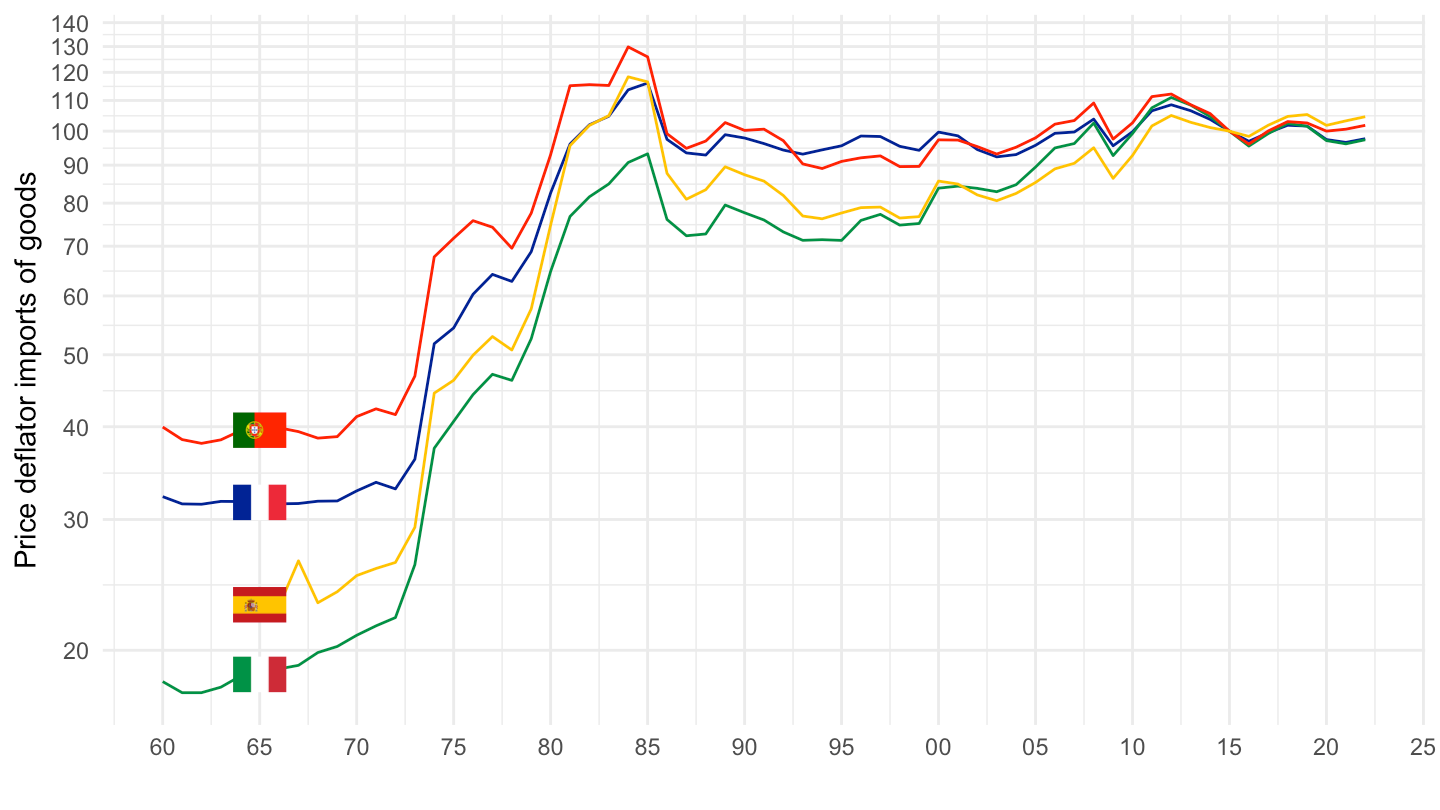
PMGN %>%
  filter(geo %in% c("fra", "prt", "ita", "esp"),
         period >= as.Date("1995-01-01"),
         unit == "ecu-eur-2015-100") %>%
  na.omit %>%
  ggplot() + theme_minimal() + ylab("Price deflator imports of goods") + xlab("") +
  geom_line(aes(x = period, y = value, color = Country)) +
  scale_color_manual(values = c("#002395", "#009246", "#FF0000", "#FFC400")) +
  geom_image(data = . %>%
               filter(period == as.Date("1995-01-01")) %>%
               mutate(period = as.Date("1995-01-01"),
                      image = paste0("../../icon/flag/", str_to_lower(Country), ".png")),
             aes(x = period, y = value, image = image), asp = 1.5) +
  scale_x_date(breaks = seq(1920, 2025, 5) %>% paste0("-01-01") %>% as.Date,
               labels = date_format("%y")) +
  theme(legend.position = "none") +
  scale_y_log10(breaks = seq(-60, 600, 10))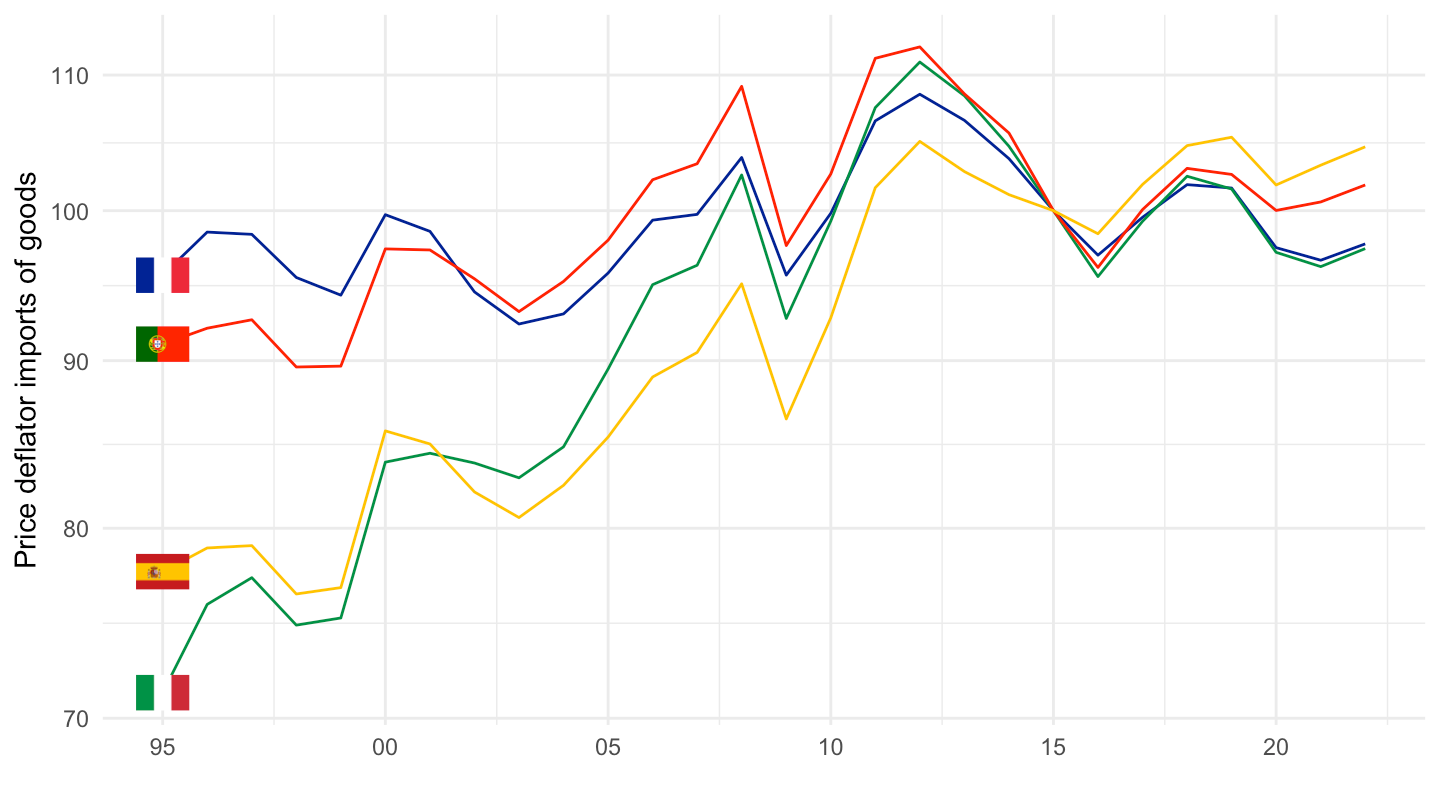
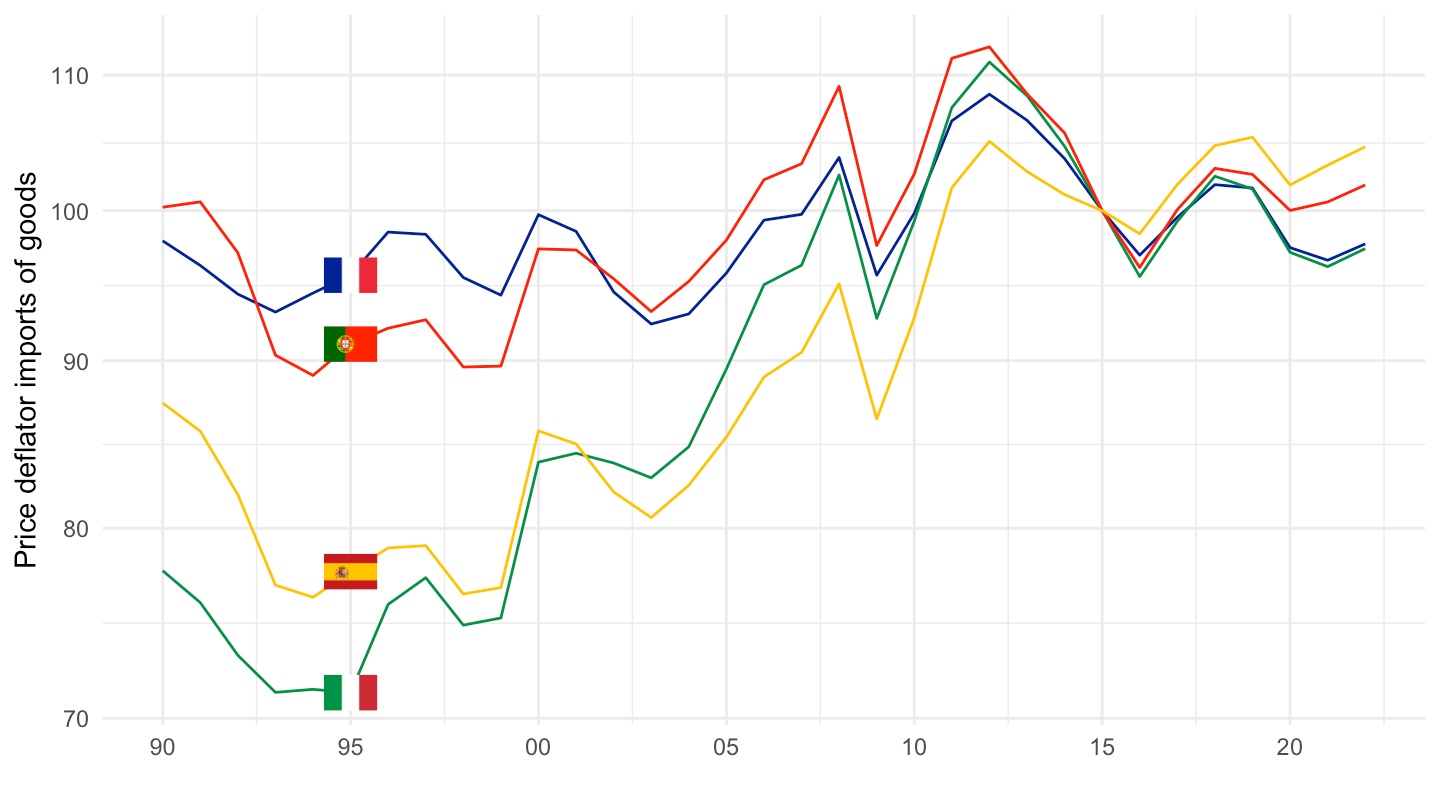
PMGN %>%
  filter(geo %in% c("fra", "prt", "ita", "esp"),
         period >= as.Date("1990-01-01"),
         unit == "ecu-eur-2015-100") %>%
  na.omit %>%
  ggplot() + theme_minimal() + ylab("Price deflator imports of goods") + xlab("") +
  geom_line(aes(x = period, y = value, color = Country)) +
  scale_color_manual(values = c("#002395", "#009246", "#FF0000", "#FFC400")) +
  geom_image(data = . %>%
               filter(period == as.Date("1995-01-01")) %>%
               mutate(period = as.Date("1995-01-01"),
                      image = paste0("../../icon/flag/", str_to_lower(Country), ".png")),
             aes(x = period, y = value, image = image), asp = 1.5) +
  scale_x_date(breaks = seq(1920, 2025, 5) %>% paste0("-01-01") %>% as.Date,
               labels = date_format("%y")) +
  theme(legend.position = "none") +
  scale_y_log10(breaks = seq(-60, 600, 10))