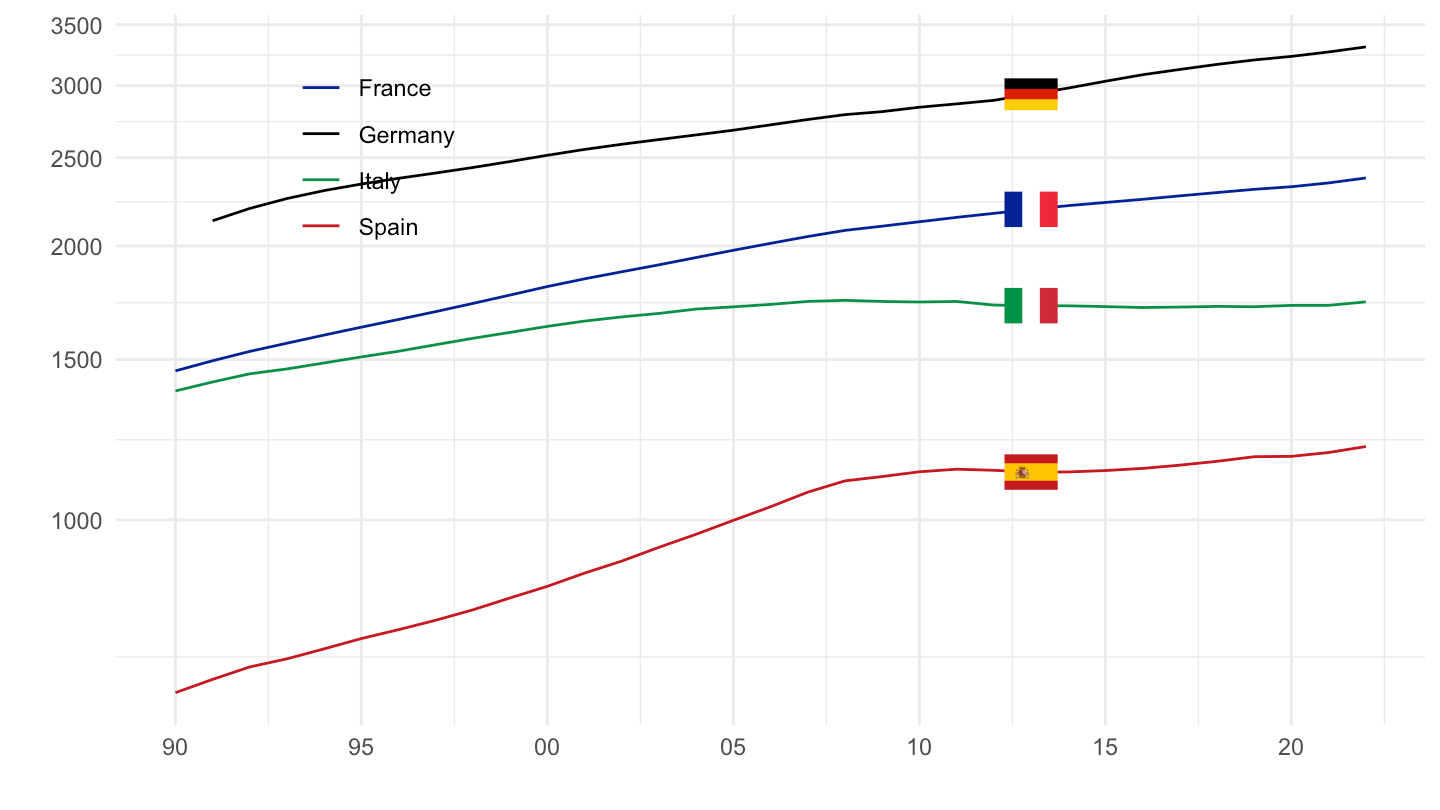
Potential gross domestic product at 2015 reference levels - OVGDP

Data - AMECO

geo, Country

Code
OVGDP %>%
  left_join(COU, by = "COU") %>%
  group_by(COUNTRY) %>%
  summarise(Nobs = n()) %>%
  mutate(Flag = gsub(" ", "-", str_to_lower(COUNTRY)),
         Flag = paste0('<img src="../../icon/flag/vsmall/', Flag, '.png" alt="Flag">')) %>%
  select(Flag, everything()) %>%
  {if (is_html_output()) datatable(., filter = 'top', rownames = F, escape = F) else .}

Vintages

France

All

Code
OVGDP %>%
  left_join(COU, by = "COU") %>%
  filter(COU %in% c("FRA"),
         vintage %in% seq(2011,2021,1),
         date >= as.Date("1985-01-01")) %>%
  mutate(`Vintage` =  paste0(vintage)) %>%
  na.omit %>%
  ggplot() + theme_minimal() + ylab("Chômage Structurel (NAWRU) en Italie") + xlab("") +
  geom_line(aes(x = date, y = value, color = `Vintage`)) +
  scale_color_manual(values = viridis(12)[1:11]) +
  scale_x_date(breaks = seq(1920, 2025, 2) %>% paste0("-01-01") %>% as.Date,
               labels = date_format("%y")) +
  theme(legend.position = "right") +
  scale_y_log10(breaks = 100*seq(-60, 60, 5))

2000-

Code
OVGDP %>%
  left_join(COU, by = "COU") %>%
  filter(COU %in% c("FRA"),
         vintage %in% seq(2011,2021,1),
         date >= as.Date("2000-01-01")) %>%
  mutate(`Vintage` =  paste0(vintage)) %>%
  na.omit %>%
  ggplot() + theme_minimal() + ylab("Potentiel") + xlab("") +
  geom_line(aes(x = date, y = value, color = `Vintage`)) +
  scale_color_manual(values = viridis(12)[1:11]) +
  scale_x_date(breaks = seq(1920, 2025, 2) %>% paste0("-01-01") %>% as.Date,
               labels = date_format("%y")) +
  theme(legend.position = "right") +
  scale_y_log10(breaks = 100*seq(-60, 60, 1))

France, Spain, Italy, Spain

All

Code
OVGDP %>%
  filter(COU %in% c("FRA", "DEU", "ITA", "ESP"),
         vintage == 2021) %>%
  left_join(COU, by = "COU") %>%
  na.omit %>%
  ggplot() + theme_minimal() + ylab("") + xlab("") +
  geom_line(aes(x = date, y = value, color = COUNTRY)) +
  geom_image(data = . %>%
               filter(date == as.Date("2013-01-01")) %>%
               mutate(image = paste0("../../icon/flag/", str_to_lower(gsub(" ", "-", COUNTRY)), ".png")),
             aes(x = date, y = value, image = image), asp = 1.5) +
  scale_color_manual(values = c("#002395", "#000000", "#009246", "#C60B1E")) +
  scale_x_date(breaks = seq(1920, 2025, 5) %>% paste0("-01-01") %>% as.Date,
               labels = date_format("%y")) +
  theme(legend.position = c(0.2, 0.8),
        legend.title = element_blank()) +
  scale_y_log10(breaks = 100*seq(-60, 60, 5))

1990-

Code
OVGDP %>%
  filter(COU %in% c("FRA", "DEU", "ITA", "ESP"),
         vintage == 2021) %>%
  left_join(COU, by = "COU") %>%
  filter(date >= as.Date("1990-01-01")) %>%
  na.omit %>%
  ggplot() + theme_minimal() + ylab("") + xlab("") +
  geom_line(aes(x = date, y = value, color = COUNTRY)) +
  geom_image(data = . %>%
               filter(date == as.Date("2013-01-01")) %>%
               mutate(image = paste0("../../icon/flag/", str_to_lower(gsub(" ", "-", COUNTRY)), ".png")),
             aes(x = date, y = value, image = image), asp = 1.5) +
  scale_color_manual(values = c("#002395", "#000000", "#009246", "#C60B1E")) +
  scale_x_date(breaks = seq(1920, 2025, 5) %>% paste0("-01-01") %>% as.Date,
               labels = date_format("%y")) +
  theme(legend.position = c(0.2, 0.8),
        legend.title = element_blank()) +
  scale_y_log10(breaks = 100*seq(-60, 60, 5))