Last data update: 09 oct. 2026, 23:46
Last compile: 09 oct. 2026, 23:47
Historique des adjudications d’OAT et de BTAN depuis 1999 (source : Agence France Trésor). Chaque ligne correspond à l’adjudication d’une ligne obligataire donnée à une date donnée.
hist_mlt |>
  ggplot(aes(x = date_adjudication, y = taux_moyen_pondere, color = type_adjudication)) +
  geom_line(linewidth = 0.4, alpha = 0.7) +
  scale_color_manual(values = c("Long terme (OAT)" = "#1B3F8B",
                                 "Moyen terme (BTAN/OAT courtes)" = "#E8737A",
                                 "Moyen-long terme" = "#B8860B",
                                 "Indexées sur l'inflation (OATi/BTANi)" = "#2E8B57"), name = NULL) +
  theme_minimal(base_size = 13) +
  labs(x = NULL, y = "%",
       title = "Taux moyen pondéré aux adjudications d'OAT et de BTAN",
       subtitle = "depuis 1999") +
  theme(legend.position = "bottom",
        panel.grid.minor = element_blank())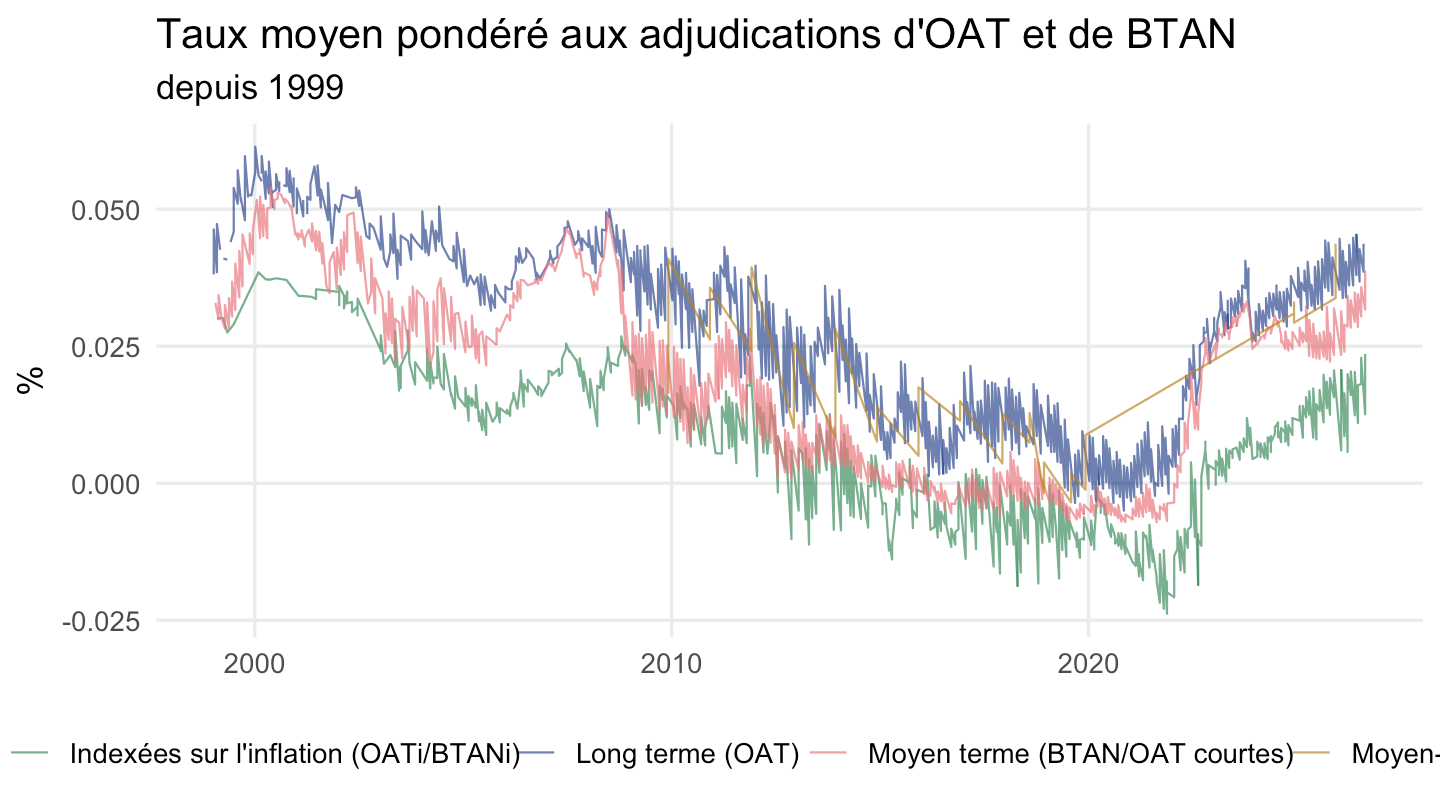
hist_mlt |>
  ggplot(aes(x = date_adjudication, y = ratio_couverture, color = type_adjudication)) +
  geom_line(linewidth = 0.4, alpha = 0.7) +
  geom_hline(yintercept = 1, linetype = "dashed", color = "grey50") +
  scale_color_manual(values = c("Long terme (OAT)" = "#1B3F8B",
                                 "Moyen terme (BTAN/OAT courtes)" = "#E8737A",
                                 "Moyen-long terme" = "#B8860B",
                                 "Indexées sur l'inflation (OATi/BTANi)" = "#2E8B57"), name = NULL) +
  theme_minimal(base_size = 13) +
  labs(x = NULL, y = "Ratio (demande / montant servi)",
       title = "Ratio de couverture des adjudications",
       subtitle = "depuis 1999 ; ligne pointillée = couverture minimale (1x)") +
  theme(legend.position = "bottom",
        panel.grid.minor = element_blank())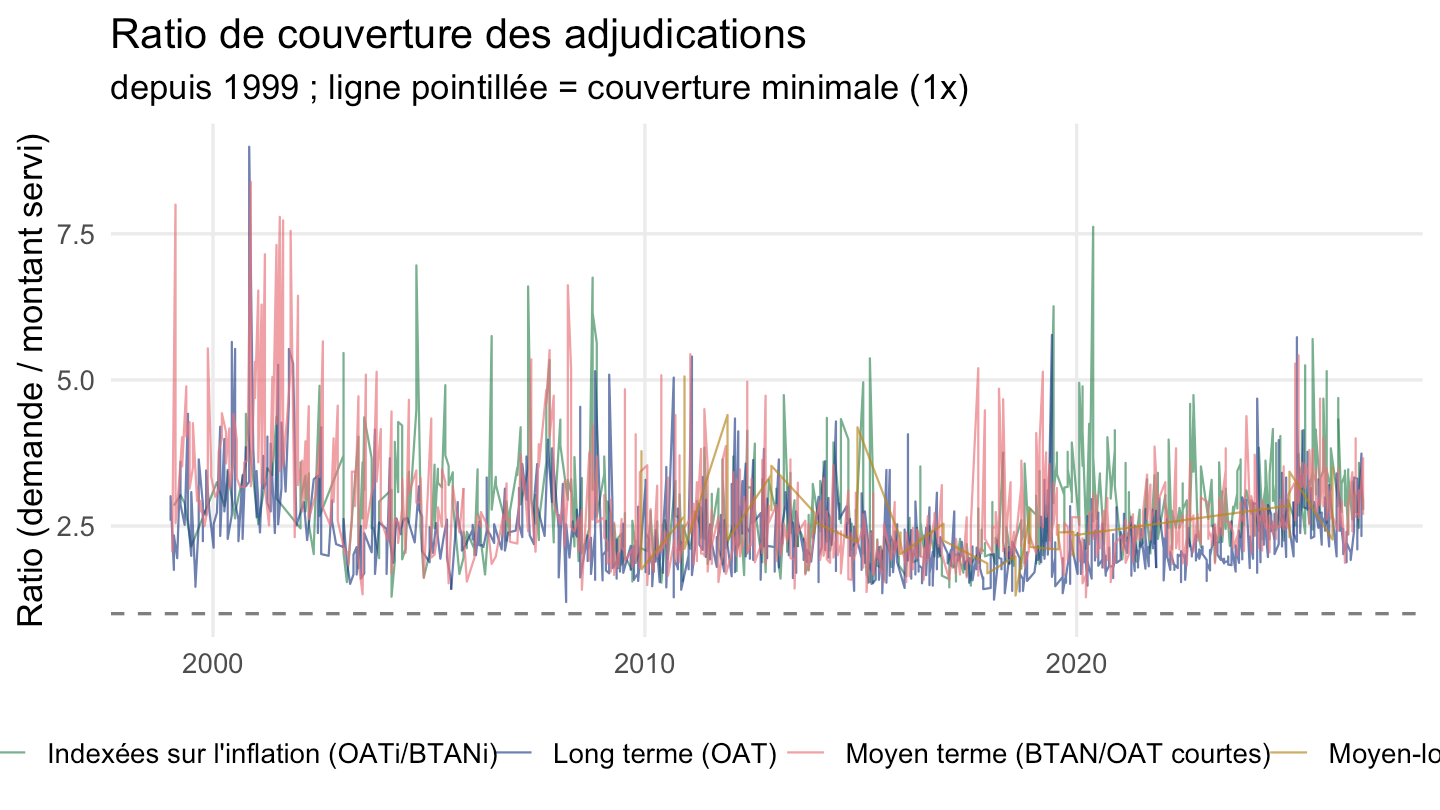
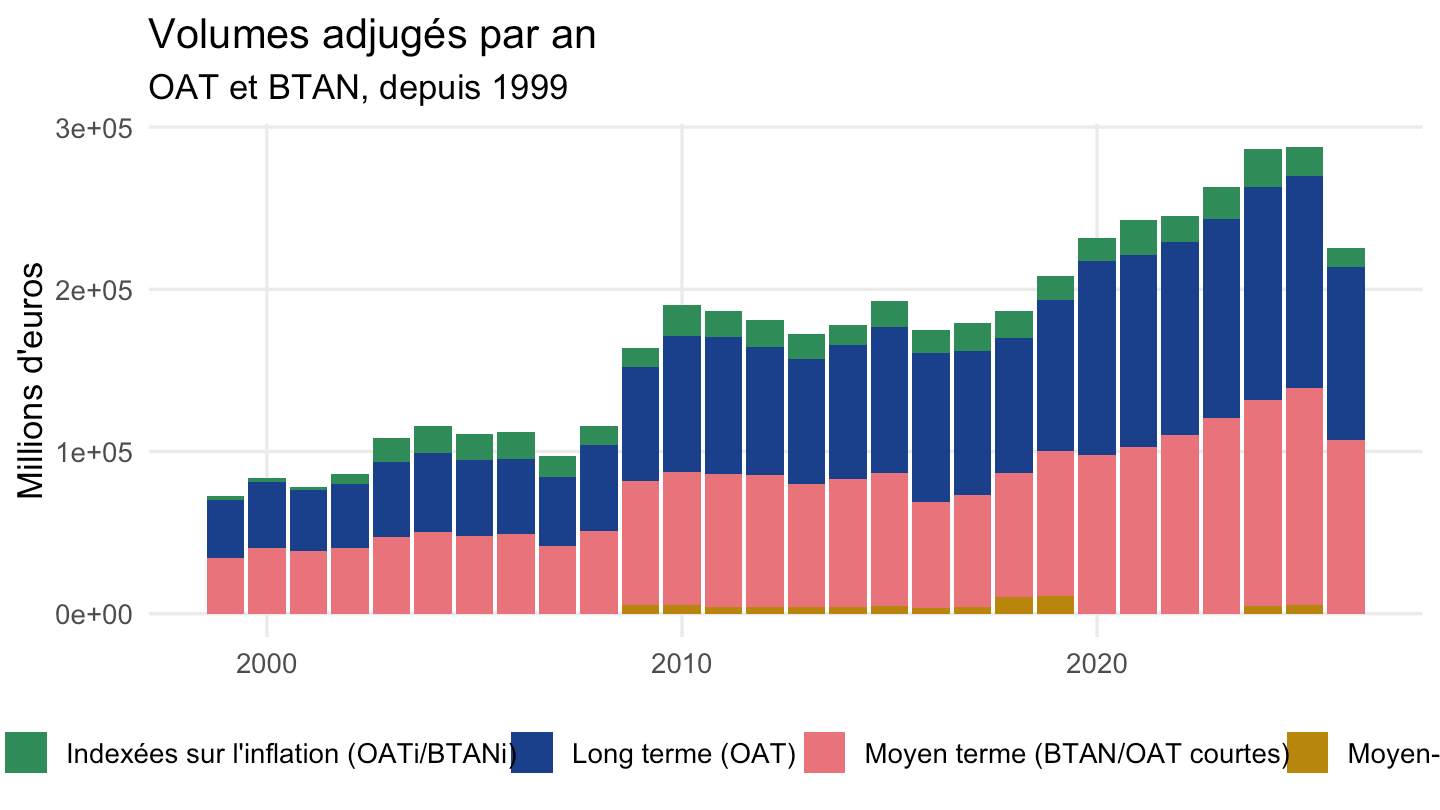
hist_mlt |>
  mutate(annee = lubridate::year(date_adjudication)) |>
  group_by(annee, type_adjudication) |>
  summarise(volume_adjuge = sum(volume_adjuge, na.rm = TRUE), .groups = "drop") |>
  ggplot(aes(x = annee, y = volume_adjuge, fill = type_adjudication)) +
  geom_col() +
  scale_fill_manual(values = c("Long terme (OAT)" = "#1B3F8B",
                                "Moyen terme (BTAN/OAT courtes)" = "#E8737A",
                                "Moyen-long terme" = "#B8860B",
                                "Indexées sur l'inflation (OATi/BTANi)" = "#2E8B57"), name = NULL) +
  theme_minimal(base_size = 13) +
  labs(x = NULL, y = "Millions d'euros",
       title = "Volumes adjugés par an",
       subtitle = "OAT et BTAN, depuis 1999") +
  theme(legend.position = "bottom",
        panel.grid.minor = element_blank())