date0 <- as.Date("2020-12-31")
date1 <- as.Date("2021-12-31")
financement_habitat_2019 %>%
filter(Line %in% c(41, 42, 43, 44)) %>%
ggplot + geom_line(aes(x = date, y = value, color = paste0(Line))) +
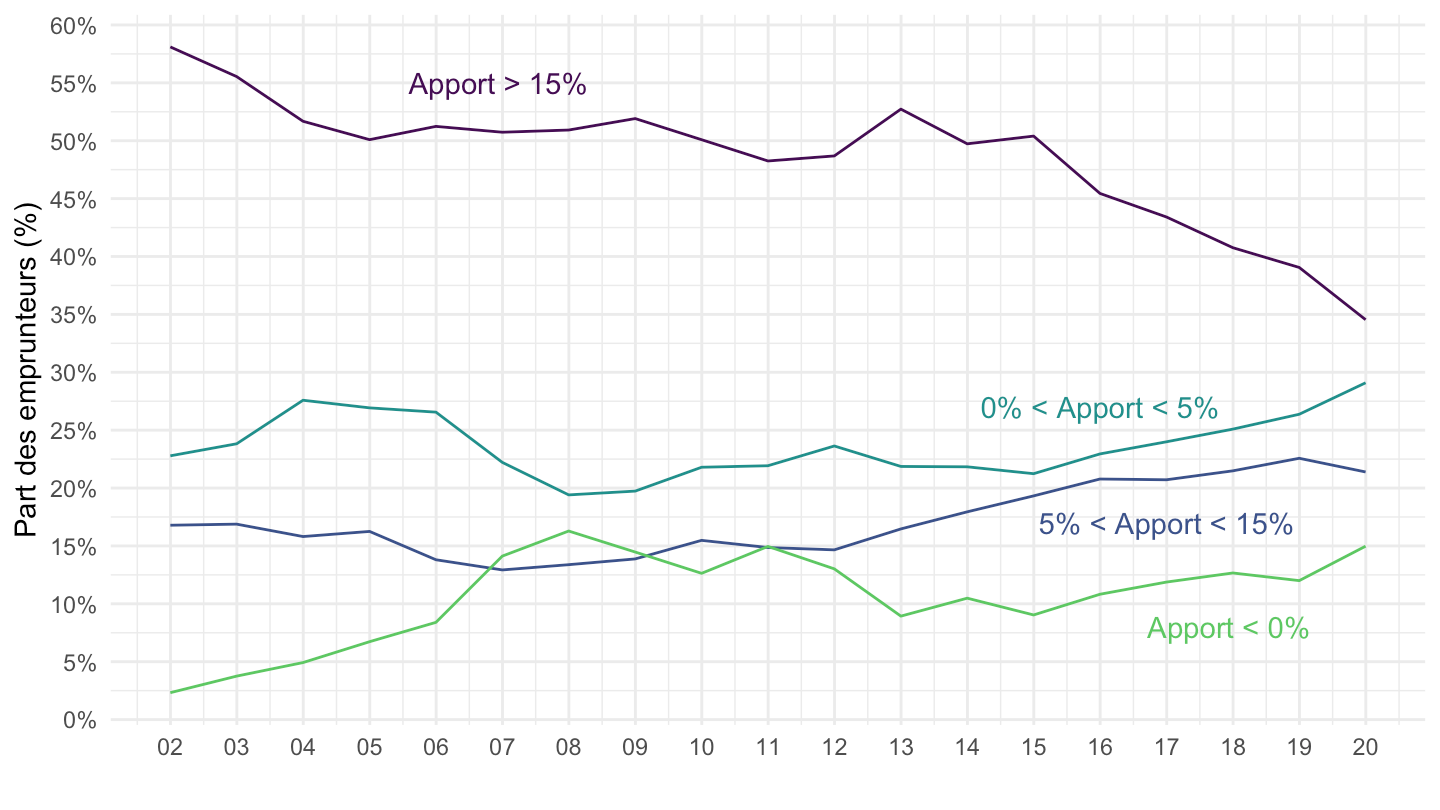
annotate("text", x = as.Date("2006-12-31"), y = 0.55, label= "Apport > 15% ", color = viridis(5)[1]) +
annotate("text", x = as.Date("2016-12-31"), y = 0.17, label= "5% < Apport < 15%", color = viridis(5)[2]) +
annotate("text", x = as.Date("2015-12-31"), y = 0.27, label= "0% < Apport < 5%", color = viridis(5)[3]) +
annotate("text", x = as.Date("2017-12-31"), y = 0.08, label= "Apport < 0% ", color = viridis(5)[4]) +
theme_minimal() + xlab("") + ylab("Part des emprunteurs (%)") +
scale_color_manual(values = viridis(5)[1:4]) +
scale_y_continuous(breaks = 0.01*seq(0, 100, 5),
labels = scales::percent_format(accuracy = 1)) +
scale_x_date(breaks = seq(1920, 2025, 1) %>% paste0("-01-01") %>% as.Date,
labels = date_format("%y")) +
theme(legend.position = "none")