April 25, 2022

Context

Review of the literature by the GCEE

Foreword: Bachmann et al. (2022) and Baqaee-Farhi

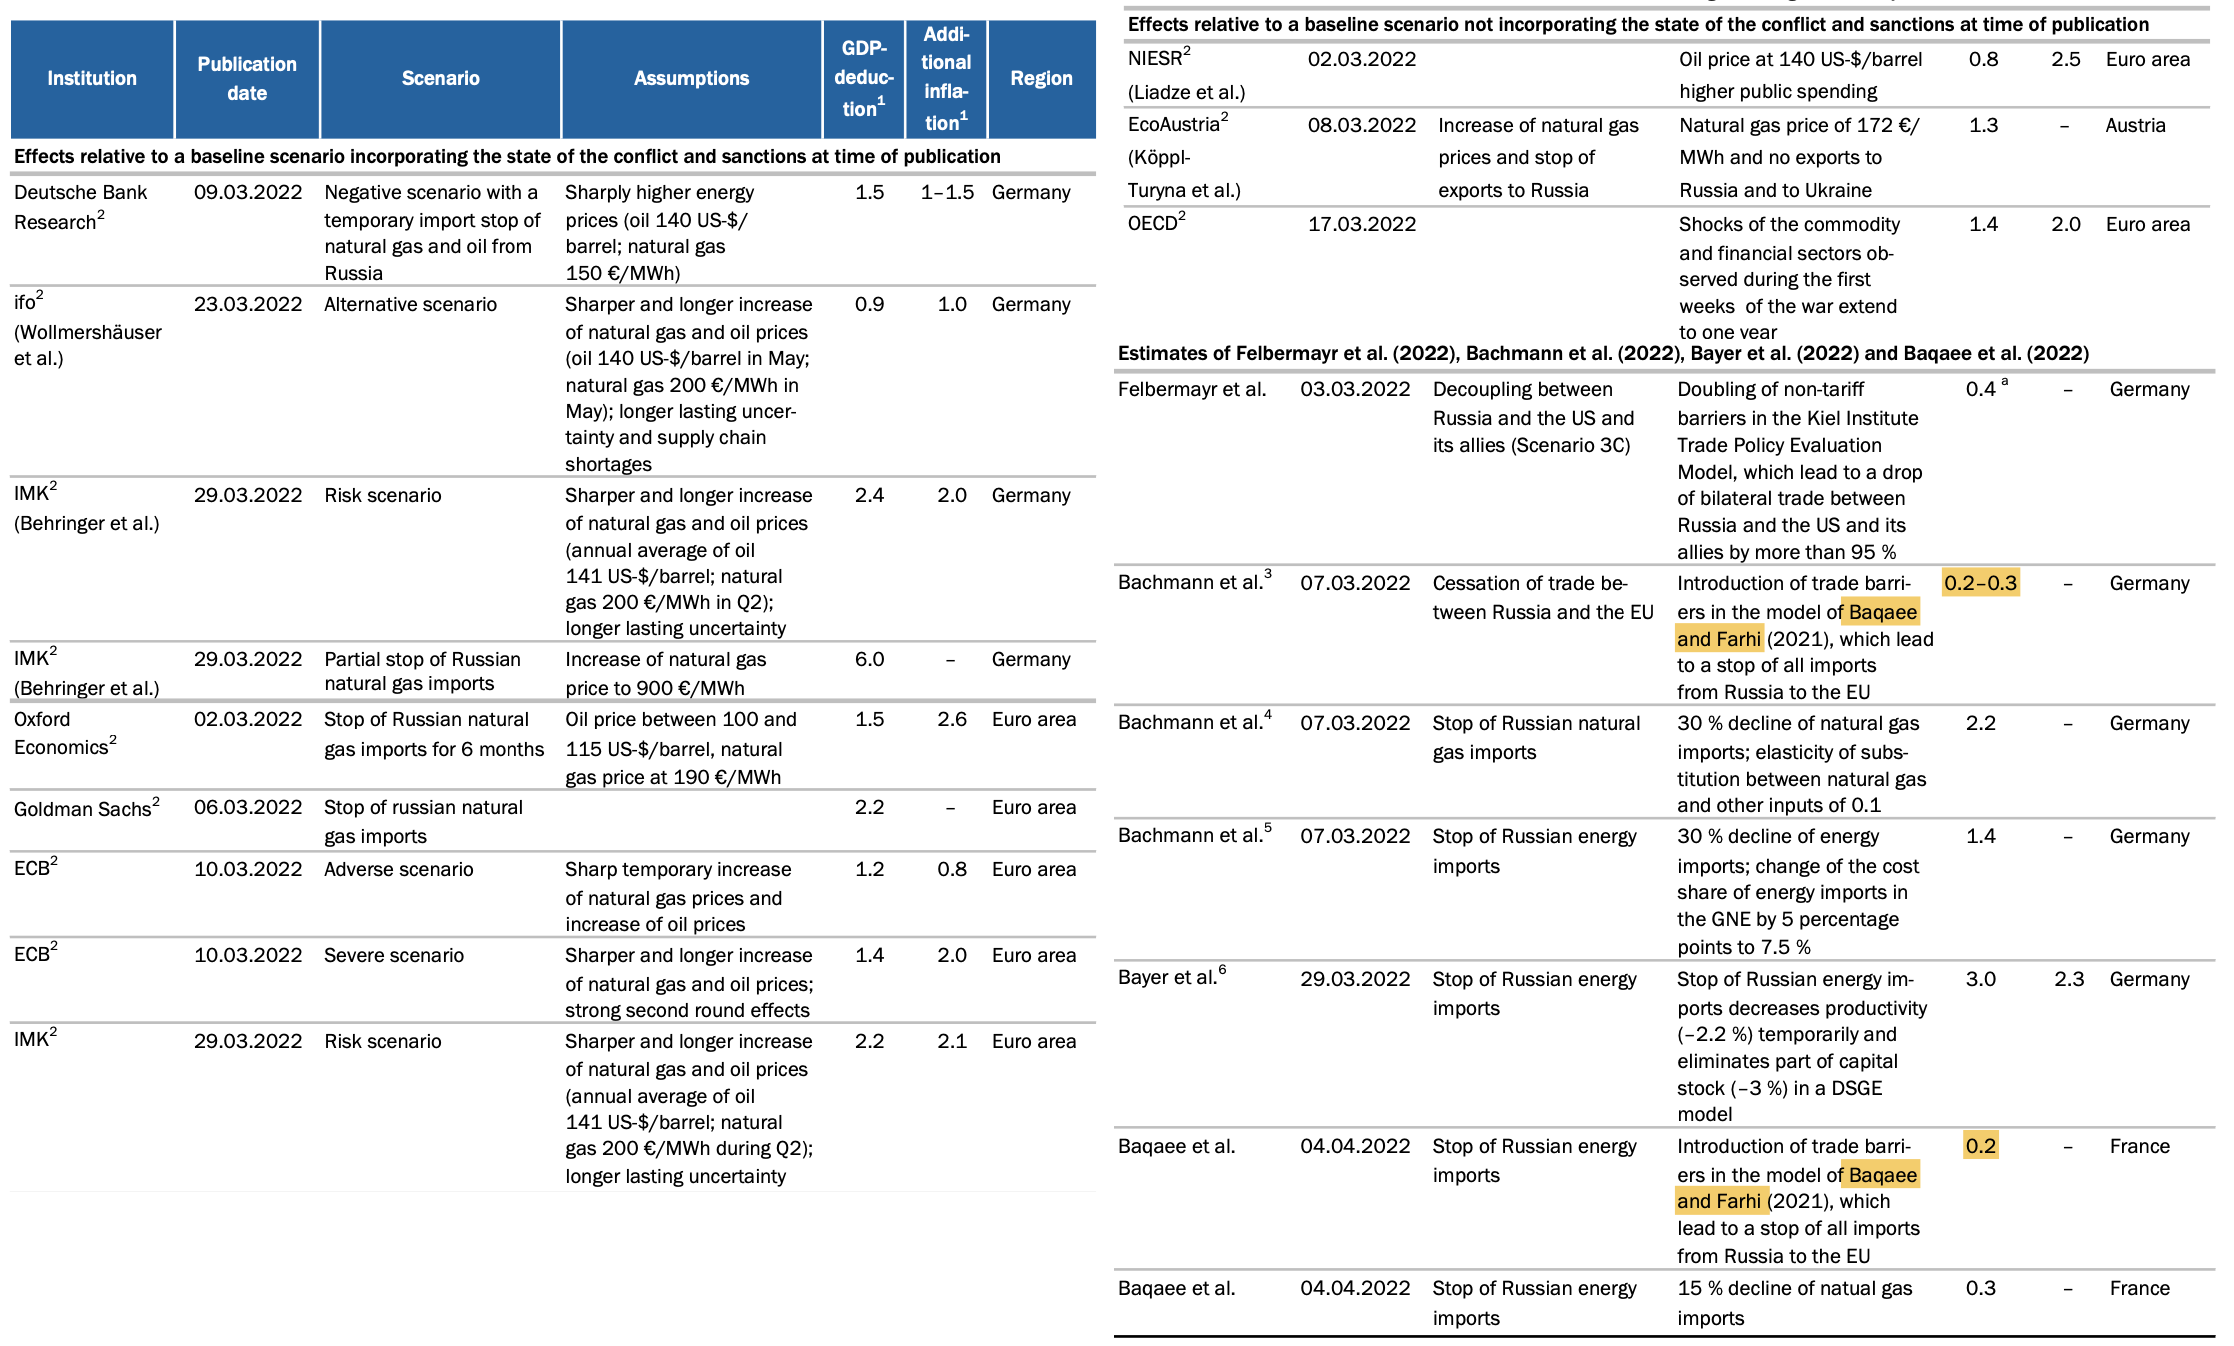
  • \(2\) types of estimations in Bachmann et al. (2022):

    – some coming out of a very crude aggregate production function approach => upper bound estimates of 1.5% and 2.3% of GDP. (I’ll come back to it)

    – some presented as coming out of an application of a “state-of-the-art” Baqaee-Farhi model. 0.2%-0.3% of GDP even according to the most conservative parametrizations.

  • The “Baqaee-Farhi estimates” are an order of magnitude lower compared to estimates of major German institutes, the Bundesbank (see previous slide), to simple “common sense”, or to the paper’s bottom-line. (which in the end seems to favor the simpler production function approach)

  • That these estimates seem to be coming out of Emmanuel’s joint work hurt me scientifically, but also (on a more personal note) emotionally, given how much respect I have for Emmanuel. (I’ll come back to my relationship to Emmanuel Farhi in the next slide) Is it a problem with the Baqaee-Farhi approach in general ? Or is “science” (= state-of-the-art models) telling us that a 0.2-0.3% drop in GDP is the most likely outcome ?

A few words about Emmanuel Farhi

  • Full disclosure: Emmanuel Farhi was my mentor. I was a visiting fellow at Harvard in 2012-13 thanks to Emmanuel. After Polytechnique and my Ph.D. in Economics in 2013 I was going to leave academia (in part, because I had strong doubts about mainstream academic macroeconomics), but Emmanuel encouraged me to continue and to try and convince the profession about my work, etc… Without his advice, his example, and his very strong support throughout, I would not have become an academic economist, or stayed “in the profession”.

  • Emmanuel was a hard scientist/an engineer by training: he went to prestigious “Corps des Mines”, a specialized elite corps which (ironically) deals with mining and energy… I attended less prestigious “Corps des Ponts”. (which deals with bridges and roads) We went to the same high school (“Lycée Louis Le Grand”), even to the same class (“TS1”) we talked a lot about our former history teacher (P. Laduguie) each time we saw each other.

  • David Baqaee had Emmanuel as an advisor, he became his main coauthor after his Ph.D. in 2015. I know David, who is one of my good colleagues at UCLA. Most of the comments here I have previously debated with David…

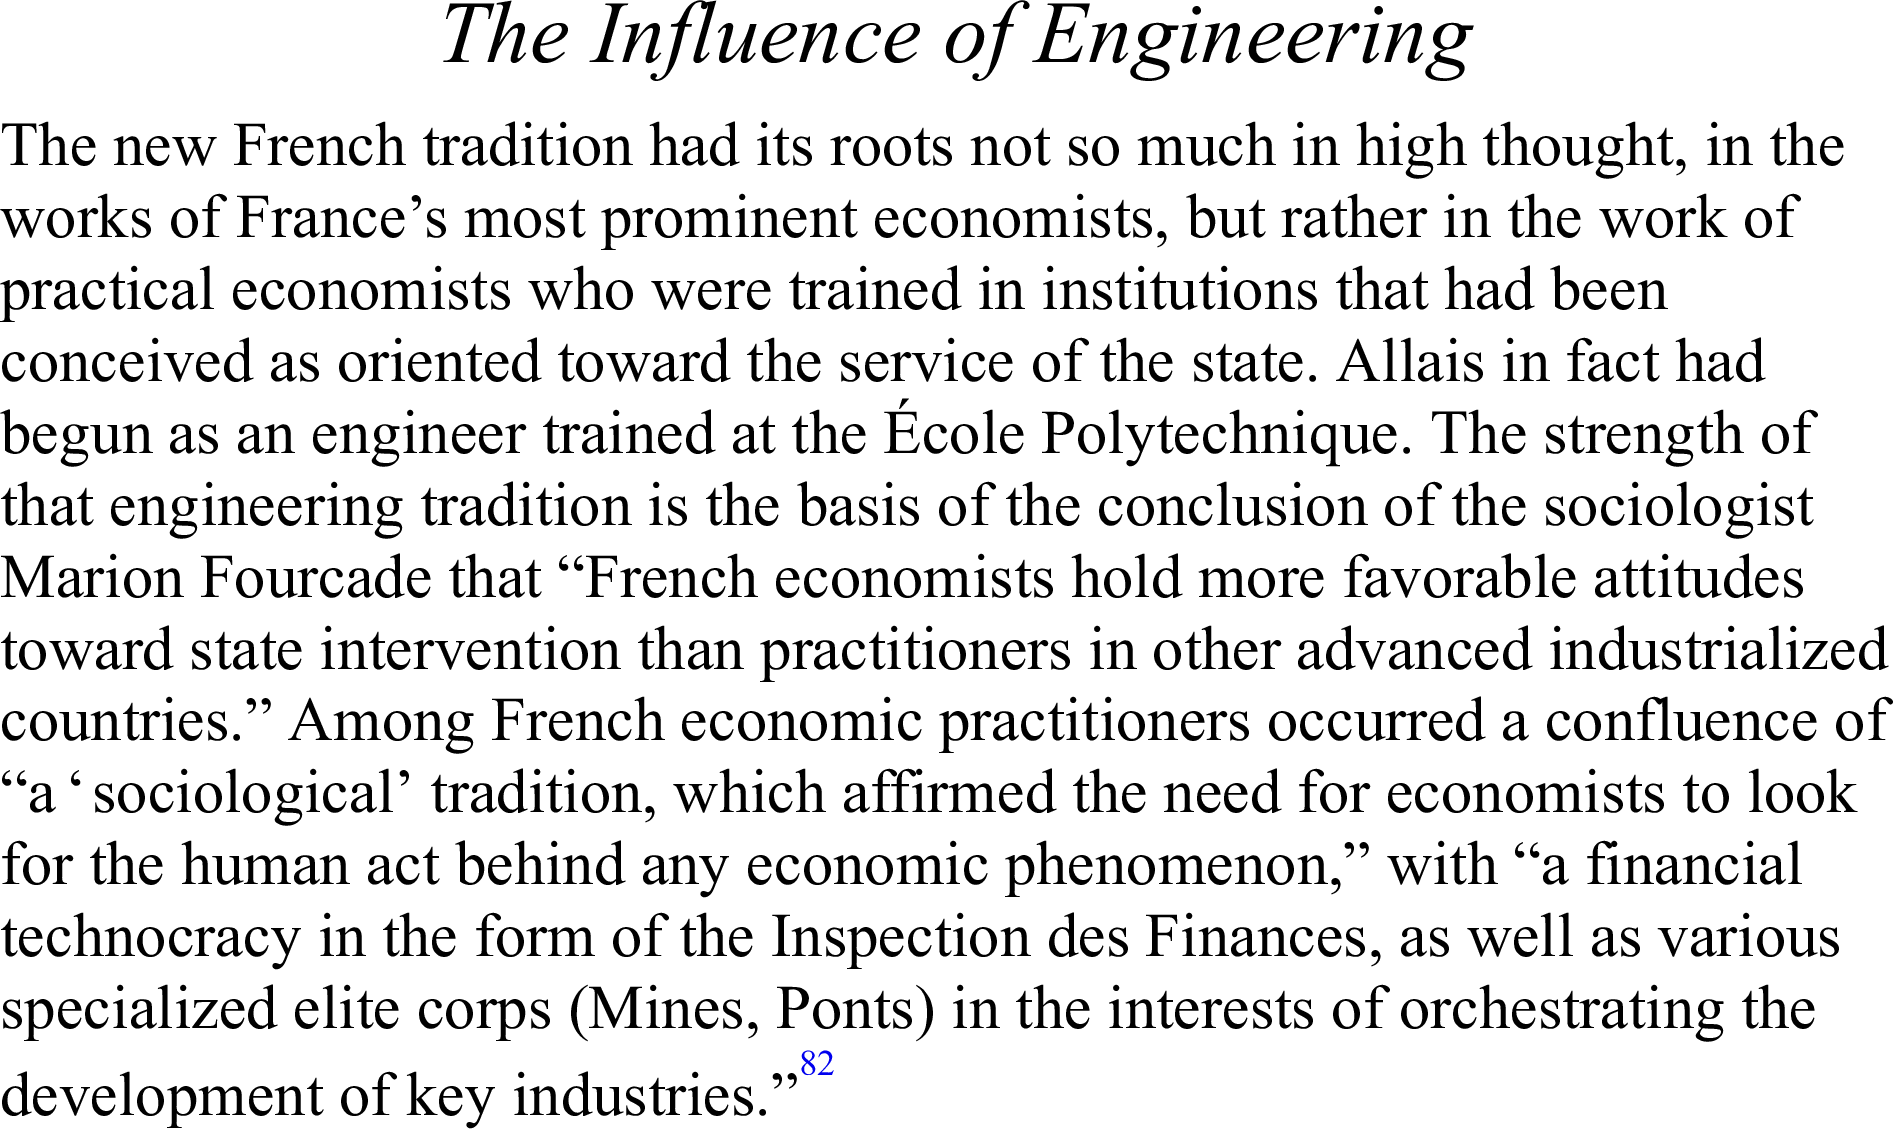
Economists vs. Engineers in France

From Brunnermeier, James, Landau (2018) “The Euro and the Battle of Ideas”

Summary of the main approaches

  • The aggregate production function approach. This is where the main estimates - those which look more reasonable to everyone (including the authors apparently) - come from in the end. This is a paradox, because much of Baqaee-Farhi’s work is precisely about how we should avoid using an exogenous aggregate production function approach. This approach is very simple but in the end rests on “the elasticity of substitution” which drives the results, and which we don’t know much about especially in such a very extreme context.

  • The Baqaee and Farhi (2021) approach. Stunningly small effects. Why is that ? In fact, both the model and the way it’s taken to the data, are not well suited to that particular question of thinking about an energy embargo. This model improved upon previous elegant models but it does not have the level of detail of bigger computational models (especially, to model the energy and the manufacturing sectors).

  • The Baqaee and Farhi (2019a) approach. An earlier paper of theirs which shows that in fact, Hulten’s theorem is not at all a good approximation for thinking about shocks to energy prices, as shown during the 1970s oil embargo.

The aggregate production function approach

Aggregate production function for energy

  • The main results of the paper are obtained from a very stylized aggregate production function approach, with two factors of production \(\text{Energy}\) (\(E\) in the paper) and \(\text{NonEnergy}\) (\(X\) in the paper):

\[Y=\left(\alpha^{\frac{1}{\sigma}}{\text{Energy}}^{\frac{\sigma-1}{\sigma}}+(1-\alpha)^{\frac{1}{\sigma}}{\text{NonEnergy}}^{\frac{\sigma-1}{\sigma}}\right)^{\frac{\sigma}{\sigma-1}}\]

  • Taking the first order derivative and the fact that the ratios of marginal productivities must equal the ratio of prices, it is easy to show that:

\[\frac{{\text{Energy}}}{{\text{NonEnergy}}}=\frac{\alpha}{1-\alpha}\left(\frac{p_{\text{Energy}}}{p_{\text{NonEnergy}}}\right)^{-\sigma}.\]

  • Importance of the elasticity of substitution \(\sigma\). When the price of energy relative to the rest goes up by \(1\)%, the use of energy declines by \(\sigma\)%. If \(\sigma\) is (very) small, it implies its use declines (very) little when the price goes up.

Production function for gas / other ?

  • Bachmann et al. (2022) also use an alternative version where instead of a Energy and non energy being imperfect substitutes, gas and non gas are imperfect substitutes. This is to allow for the fact that gas may not be easily be replaceable by other energy sources. So \(E\) sometimes stands for \(\text{Gas}\) in the paper, while \(X\) stands for \(\text{NonGas}\).

\[Y=\left(\alpha^{\frac{1}{\sigma}}{\text{Gas}}^{\frac{\sigma-1}{\sigma}}+(1-\alpha)^{\frac{1}{\sigma}}{\text{NonGas}}^{\frac{\sigma-1}{\sigma}}\right)^{\frac{\sigma}{\sigma-1}}\]

  • Of course, since gas in some location itself is not very substitutable with gas in another location in Germany, one can ask why we should stop there.

  • In principle, if gas drops by 100% in some location and cannot be replaced, then one could get an arbitrarily large GDP drop. This is not necessarily realistic either, but this is simply to show that this approach is perhaps not that informative and may seem somewhat arbitrary.

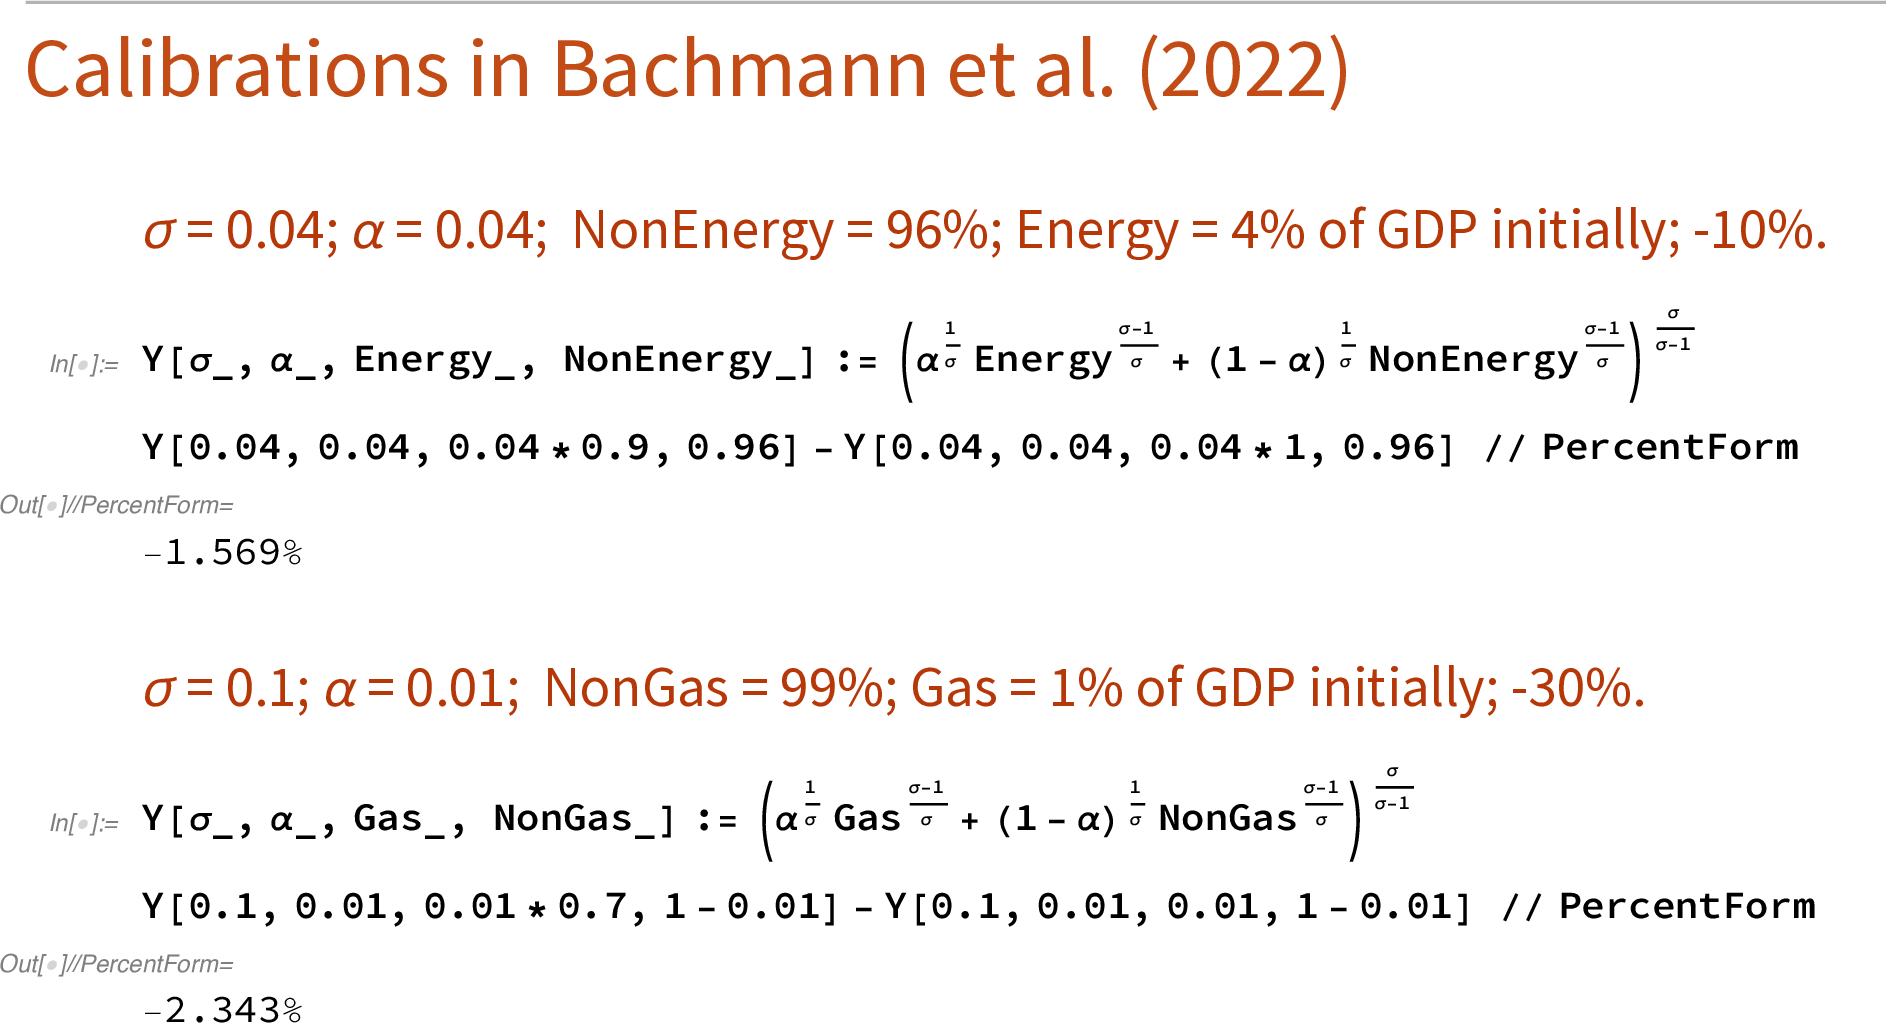
How to get the 1.5% and the 2.3% of GDP ?

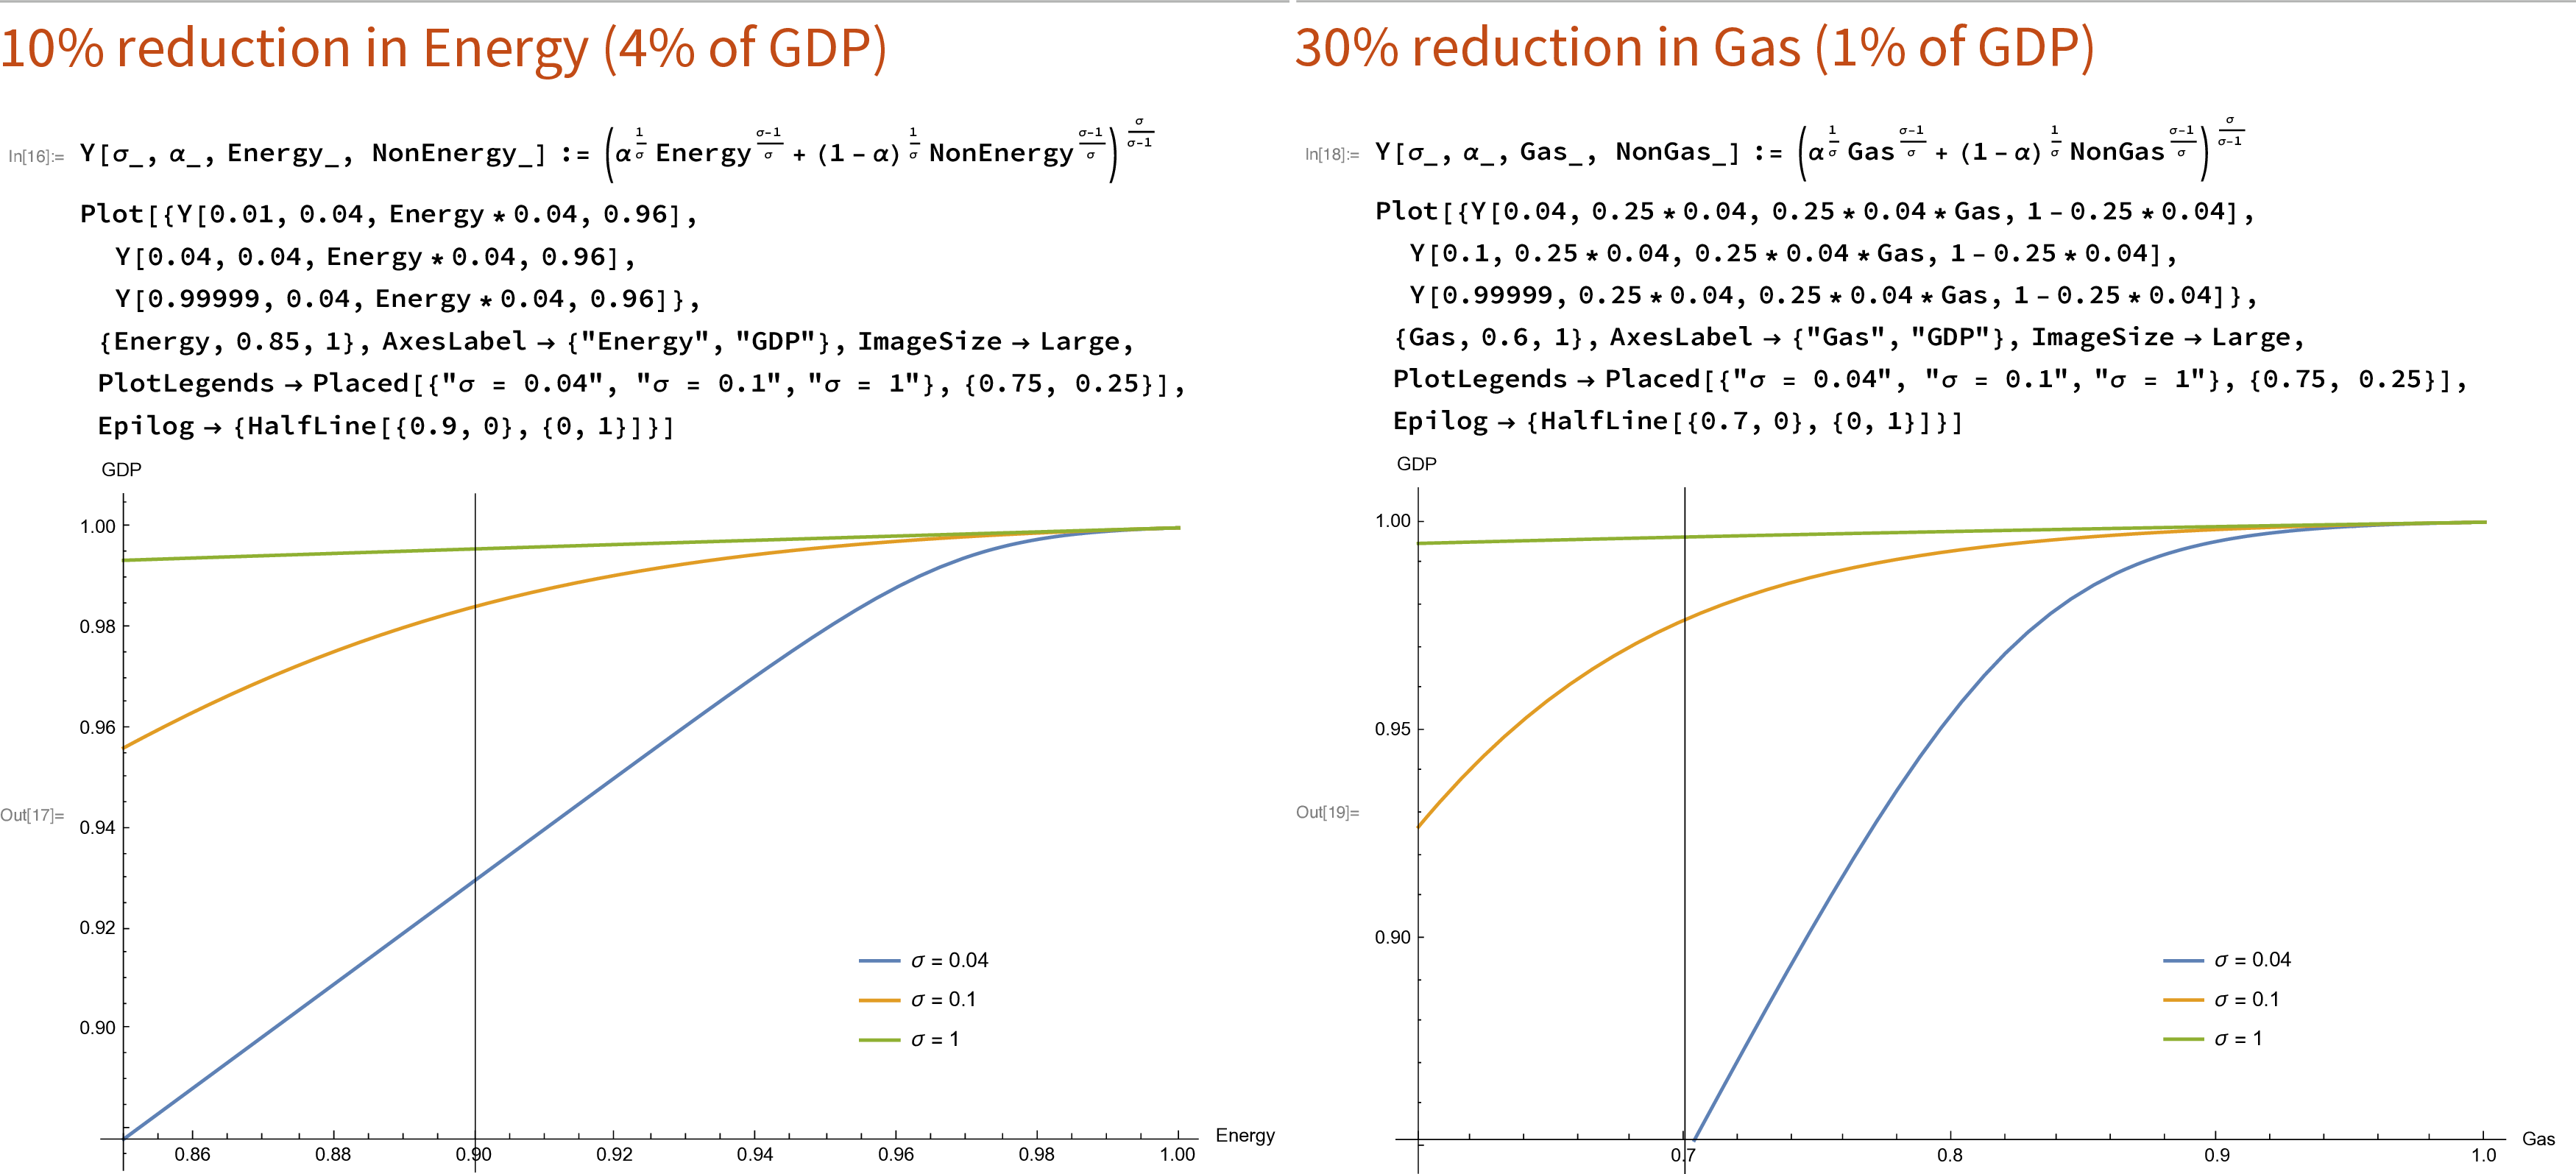
  • Reduction in 10% of energy usage with elasticity = 0.04, reduction in 30% of gas usage with elasticity = 0.1. Computing the change in GDP obtained from this very simple production function is simply a matter of plugging the values in the production function…

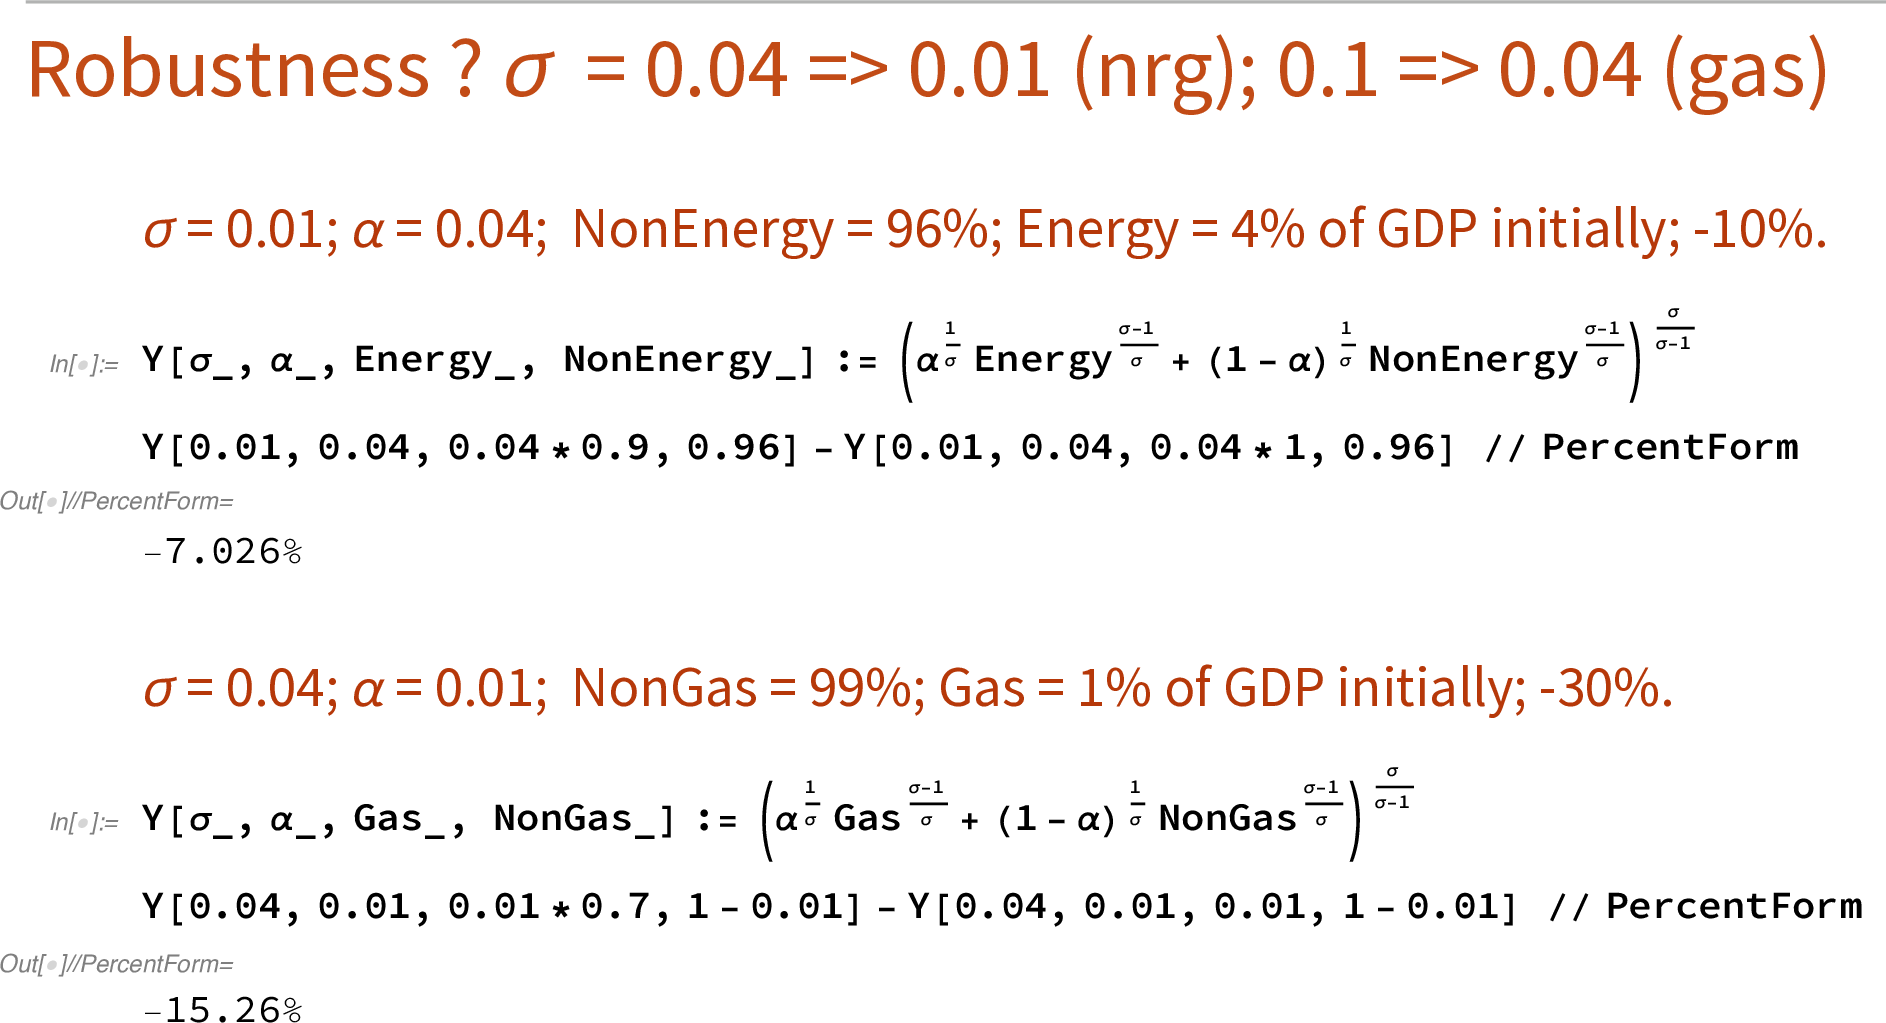
Very sensitive to the elasticity

  • Of course, we can plug other numbers in them. Imagine that \(\sigma = 0.01\) instead of \(\sigma = 0.04\), and that natural gas is as substitutable as energy \(\sigma = 0.04\) instead of \(\sigma = 0.1\) then:

What are these elasticities ?

  • Metaanalyses such as Labandeira, Labeaga, and López-Otero (2017) are using changes in prices which actually took place (in normal times), but do not tell us anything about the elasticity conditional on a huge shock such as an embargo: you might have nonlinearities.

  • Constant Elasticity of Substitution (CES) functions are only a local approximation. There are (engineering) reasons to believe that as the shock gets larger, you can potentially get to much smaller elasticities…

  • I think we should agree that there is to know what these elasticities are, and they are subject to a considerable degree of uncertainty. (the authors repeatedly criticize the “engineering view”, but who better than engineers can tell us what this elasticity of substitution really is ?)

Uncertainty about \(\sigma\) does matter a lot !

  • The below graphs investigate the GDP drops for different values of the elasticity \(\sigma\). Of course, the elasticity of substitution matters a lot for how much GDP drops.

Using the production function is a contradiction ?

  • What is paradoxical is that David Baqaee and Emmanuel Farhi’s research agenda was precisely to move away from these extremely stylized production functions. In Baqaee and Farhi (2019b): “As micro data becomes more plentiful, parsimonious reduced-form aggregate production functions look more antiquated.”

  • This is a somewhat of a contradiction:

    – On the one hand, the sophisticated estimation techniques in Bachmann et al. (2022) build upon state-of-the-art Baqaee-Farhi models. (but these seem to lead to embarrassingly small effects - 0.2-0.3% of GDP)

    – On the other, the numbers they seem to believe in (and which they have put forward in the public debate) do not come from these sophisticated approach, but from an very stylized production function approach. As we’ve seen, this approach doesn’t have a lot of scientific authority.

  • So there’s only one question left: why do Baqaee and Farhi (2021), lead to such small estimates ?

Baqaee and Farhi (2021)

Main estimates

  • The Baqaee and Farhi (2021) is presented in the Bachmann et al. (2022) paper as a “state-of-the-art multi-sector model with rich input-output linkages and in which energy is a critical input in production.”

  • Results of the model are extremely low except even with very low elasticities: 0.26% of GNE.

Problems with the model / the calibration

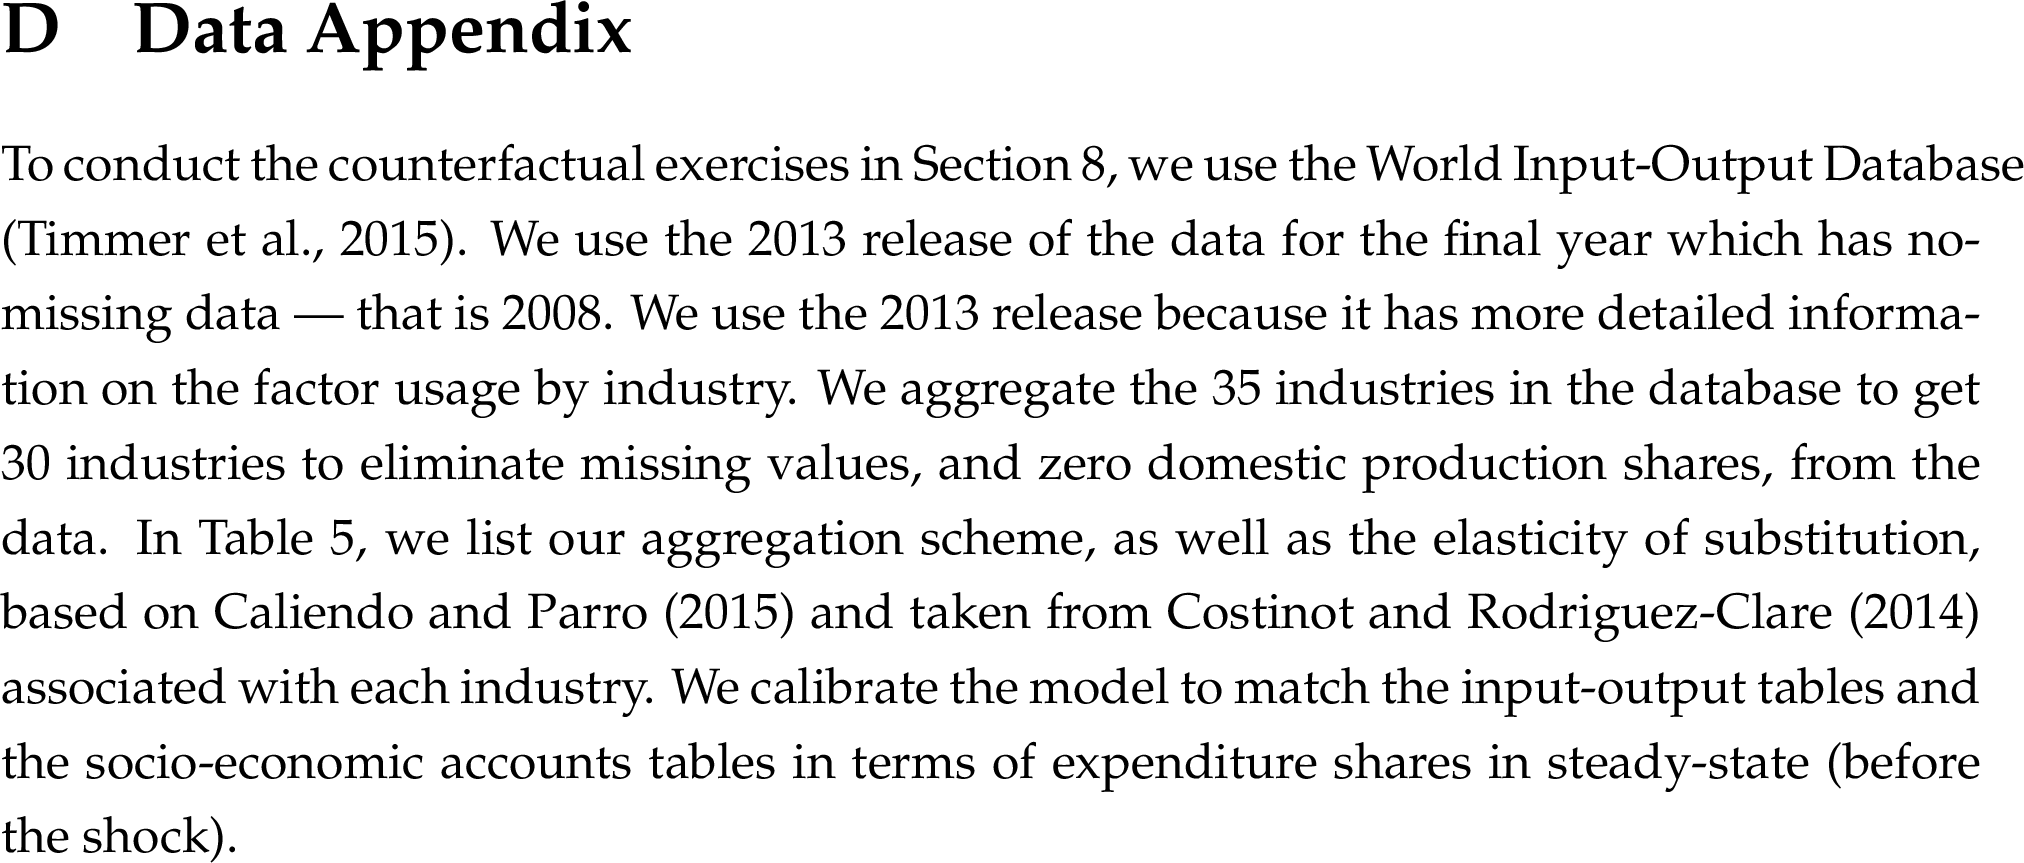
  • Only 30 sectors (the table they use has 35 sectors, but they want to get rid of 0s): for example, water supply is mixed with electricity and gas in the “Electricity, Gas and Water Supply” sector; the chemical industry is mixed with rubber and plastics. Within a sector, there is perfect substitution. 2016 release of the world input-output table has more sectors.

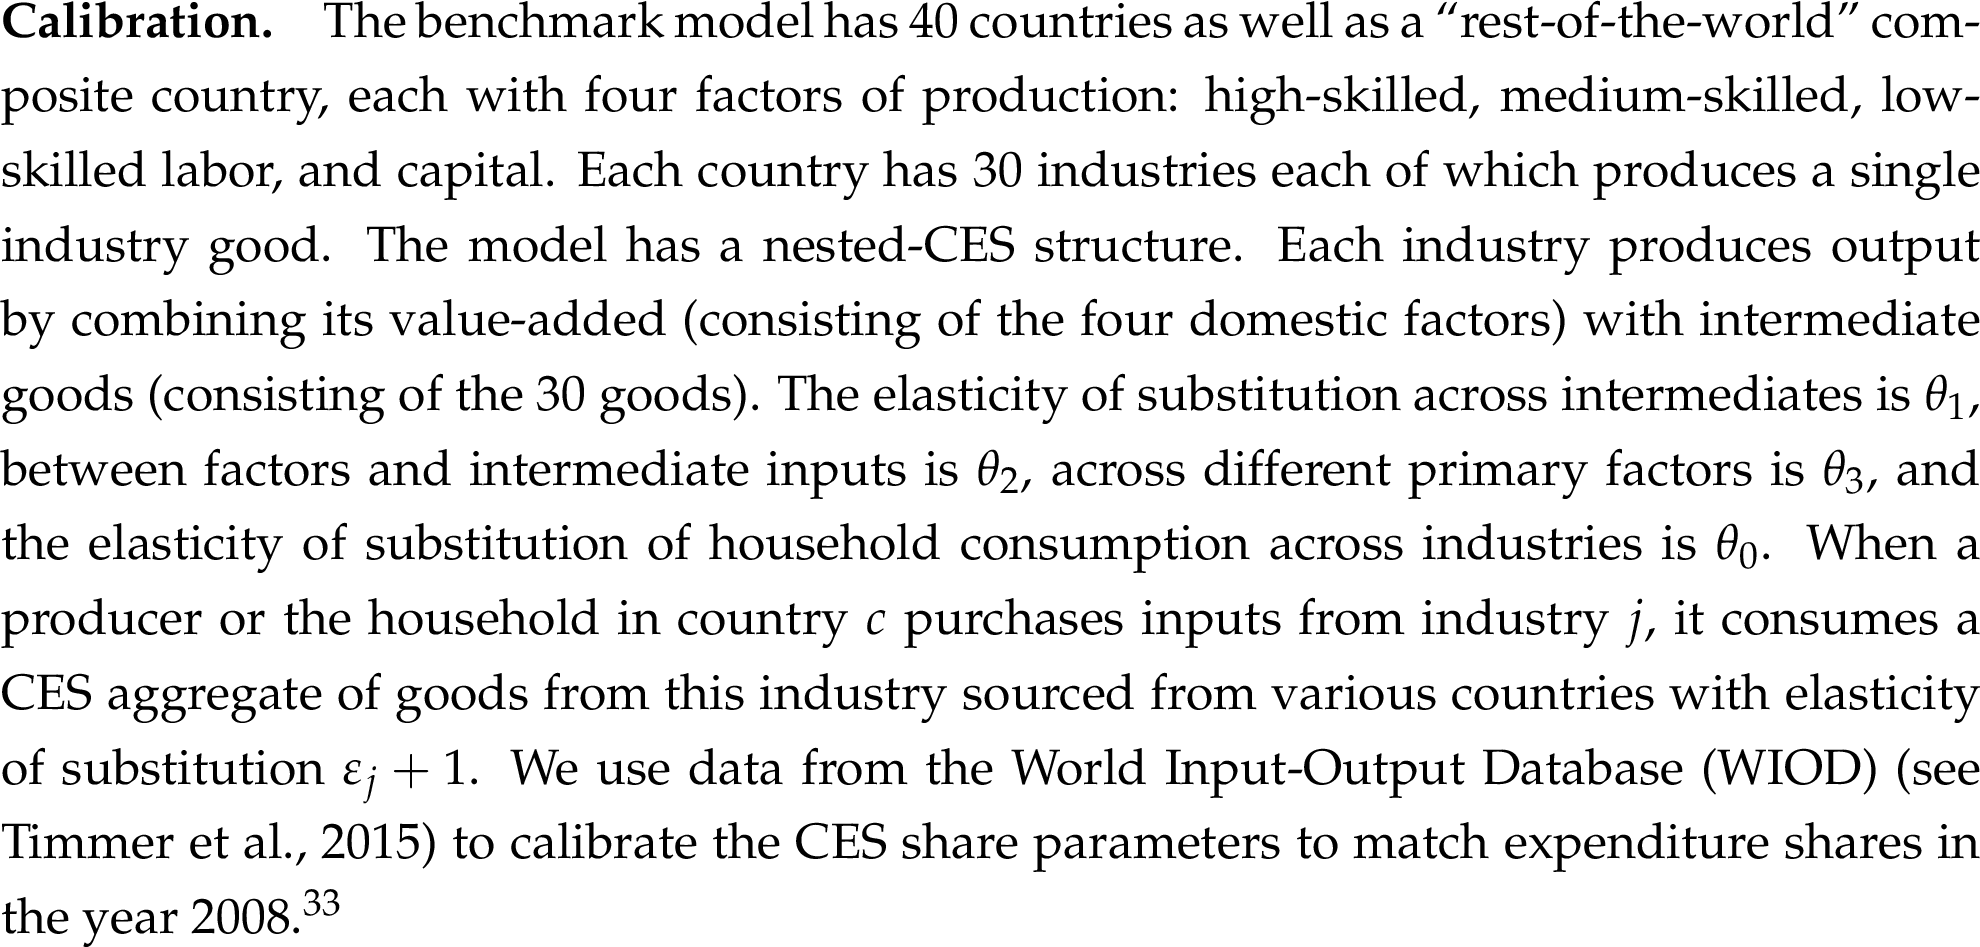
  • Only 4 factors: high-skilled, medium-skilled, low-skilled labor, and capital. This implicitely assumes that a high-skilled person (say, an engineer) can easily switch across any of the 30 sectors. As shown in Baqaee and Farhi (2019a), the number of factors is hugely important.

  • No space: as discussed in Baqaee and Farhi (2019a), there might even be one factor per location, if people can’t freely move in the short run (note: gas also cannot easily be moved around).

  • Few parameters: there are 4 key elasticities of substitution. (e.g. only one for all consumption goods) This is better than the production function approach, but still very stylized. And no way to know what these elasticities are in this particular example. (never been seen before) Overall, this model closer to a “toy model” than to a “quantitative model”.

Only 30 sectors

  • Particular application at hand is perhaps not that well suited to study this particular question. Use of the 2013 release of the WIOD database, with only 35 sectors (which they assemble into 30). 2016 release breaks energy into two pieces. (Contrast this with Baqaee, Farhi (2019): 88 sector US KLEMS.)

Only 30 sectors

Only 4 factors

  • There are only 4 factors in the Baqaee and Farhi (2021) model, for all industries: high-skilled, medium-skilled, low-skilled labor, and capital.

No space

  • Not only too few industries, too few factors, there also are too few locations. (there’s just one) In theory, adding space could be done, by simply adding more factors, one that is more specific to each factor.

  • The more factors you have that are not substitutable, the less possibility of substitution you get.

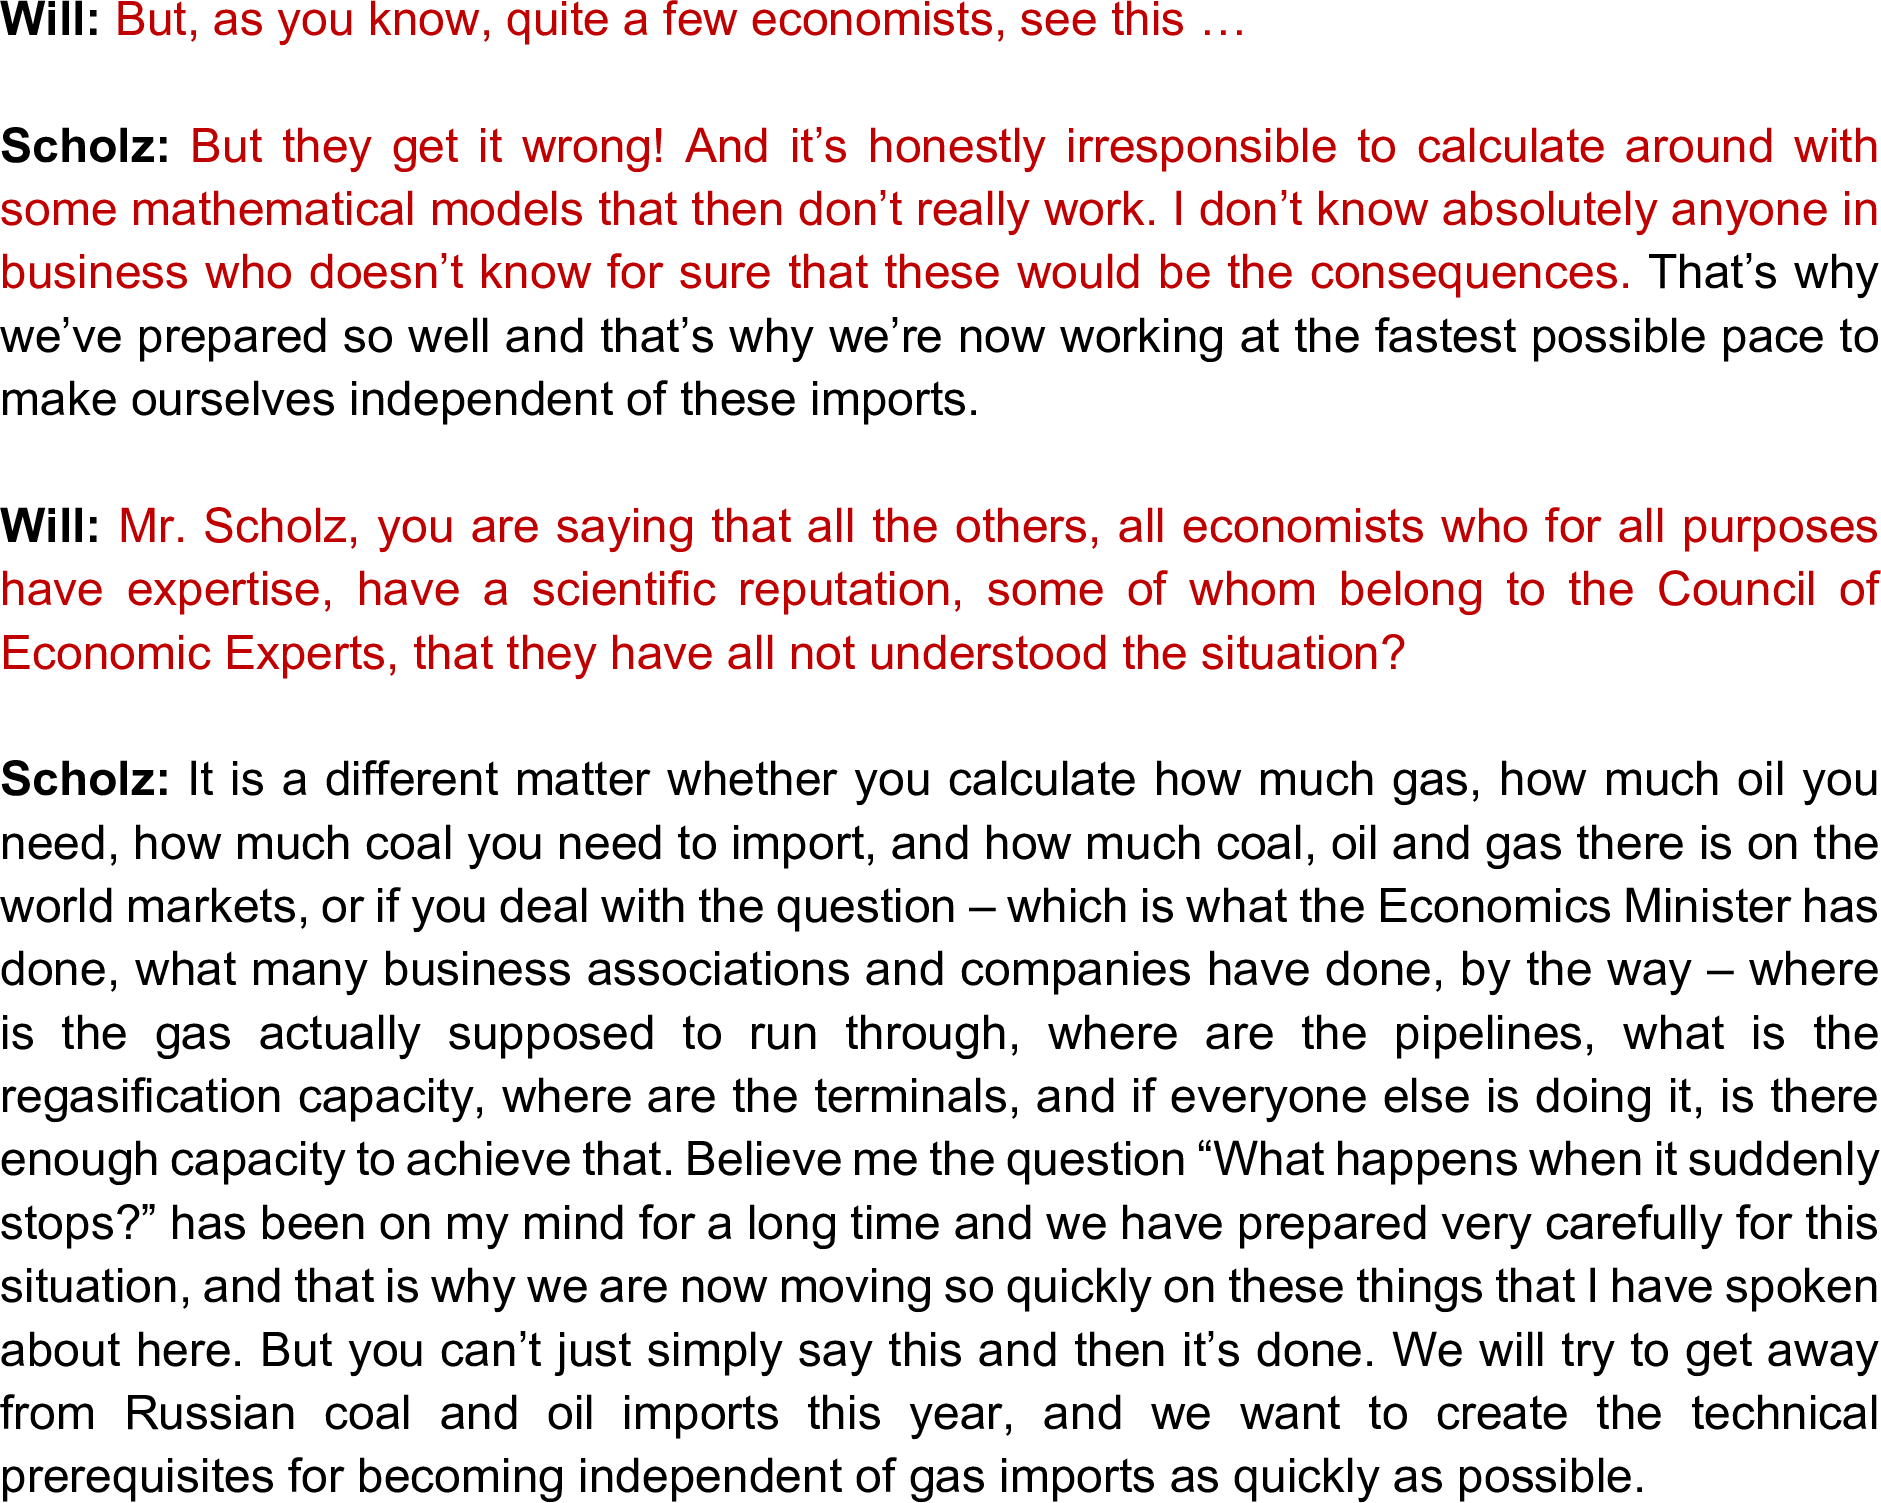
  • So in fact, it’s not a problem with “mathematical models” which do not work, it’s more a problem about the assumptions we choose to use in these mathematical models.

  • I don’t see any reason why we should simply assume these problems away. In general, the issue with this model is perhaps that it is too stylized (or rather, too simplified in key respects, such as the modelling of the energy sector) compared to what you’d ideally like to have for such an exercise.

No space: Olaf Scholz is correct

Closer to a “simple stylized model”

  • More generally: few parameters, quite a few simplifying assumptions. This computational experiment ends up being closer to a simple stylized model than to a large-scale computational GE model.

  • “Can lead to unreliable quantitative predictions when compared to the large-scale models”.

How does Baqaee and Farhi (2021) fit into their research agenda ?

The Baqaee and Farhi (2021) paper is very related to an earlier paper of theirs, released in Econometrica:

  • Baqaee and Farhi (2021): open economy model. Questions that they look at: gains from trade, impact of tariffs, etc.

  • Baqaee and Farhi (2019a): Breaking from Hulten’s “theorem”

But the second paper appears to me like a much more relevant paper, and I’ll explain why:

  • Assumes that factors are much less substitutable (one factor for each industry), which is more relevant for the short run, as the authors themselves point out.

  • One of the experiments is precisely about energy, and the authors conclude that there does not seem to be much substitution.

Baqaee and Farhi (2019a): Breaking from “Hulten’s theorem”

Hulten: Key reason why model-implied losses are small

  • Extract from the paper:

  • This is some version of Hulten’s theorem: the effects of a shock on a sector has something to do with the importance of that sector in GDP.

Summers dismisses “Hulten’s theorem” for energy

  • In his Secular Stagnation Speech at the 2013 IMF Fourteenth Jacques Polak Annual Research Conference (Emmanuel was in the front row), Larry Summers compared the 2007-2009 financial crisis to a power failure. He was precisely explaining that key sectors such as the financial sector, or the energy sector, were so central to the working of the economy, that clearly using such sectors would be far more important than suggested through their importance in GDP. In other words, he was dismissive of Hulten’s theorem.

  • The quote (at 54’24’’) is: “You know, I always like to think of these crises as analogous to a power failure. Or analogous to what would happen if all the telephones were shut off for a time. The network would collapse, the connections would go away and output would of course drop very rapidly.”

“There’d be a set of economists who would sit around explaining that electricity was only 4% of the economy and so if you lost 80% of electricity you couldn’t possibly have lost more than 3% of the economy. And there would be, you know, there’d be people in Minnesota and Chicago and stuff would be writing that paper… but it would be stupid ! It would be stupid ! And we’d understand that, somehow, even if we didn’t exactly understand in the model, that when there wasn’t any electricity there wasn’t really going to be much economy.”

“Secular stagnation” speech from Larry Summers

This argument is influential

  • One of the arguments for why the effects found in Bachmann et al. (2022) are so low is that the share of energy is only about 4% of GDP, and the share of gas is only about 1% of GDP.

  • It’s very paradoxical because Baqaee and Farhi (2019a)’s work was a way to precisely break Hulten’s theorem.

  • Since Hulten’s theorem is such an important tenet of growth accounting, this was presented however only as a second-order approximation, though in fact it was first order.

Importance of factor reallocation

  • Baqaee and Farhi (2019a) show that with complementarities, a negative shock can cause a large downturn when labor cannot be freely re-allocated, but the ability to re-allocate labor largely mitigates these effects.

  • There are reasons to suspect in such circumstances of a Russian gas embargo, that labor could not be easily reallocated. (probably in the 2021 trade paper the authors assume more reallocation is possible because they look at longer-term effects of trade) “In light of increasing evidence (see for example Acemoglu et al., 2016; Autor et al., 2016; Notowidigdo, 2011) that labor is not easily reallocated across industries or regions after shocks in the short run, we view the no-reallocation case as more realistic for modeling the short-run impact of shocks, and the full-reallocation case as better suited to study the medium to long-run impact shocks.”

Reallocation is difficult

Empirical exercise shows reallocation is difficult at business cycle frequencies:

  • Overall, given our elasticities of substitution, the model with full reallocation is unable to replicate the volatility of the Domar weights at either annual or quadrennial frequency, suggesting that this model is not nonlinear enough to match the movements in the Domar weights as arising from sectoral productivity shocks.

  • We also consider the response of aggregate output to shocks to specific industries, using our benchmark calibration. It turns out that for a large negative shock, the “oil and gas” industry produces the largest negative response in aggregate output, despite the fact it is not the largest industry in the economy.

  • In our baseline calibrations, we assume that intermediate inputs can be freely reallocated across producers even in the short run. This is sensible since intermediate goods are probably easier to reallocate than labor.

The importance of factor reallocation

Example of the 1970s oil shock

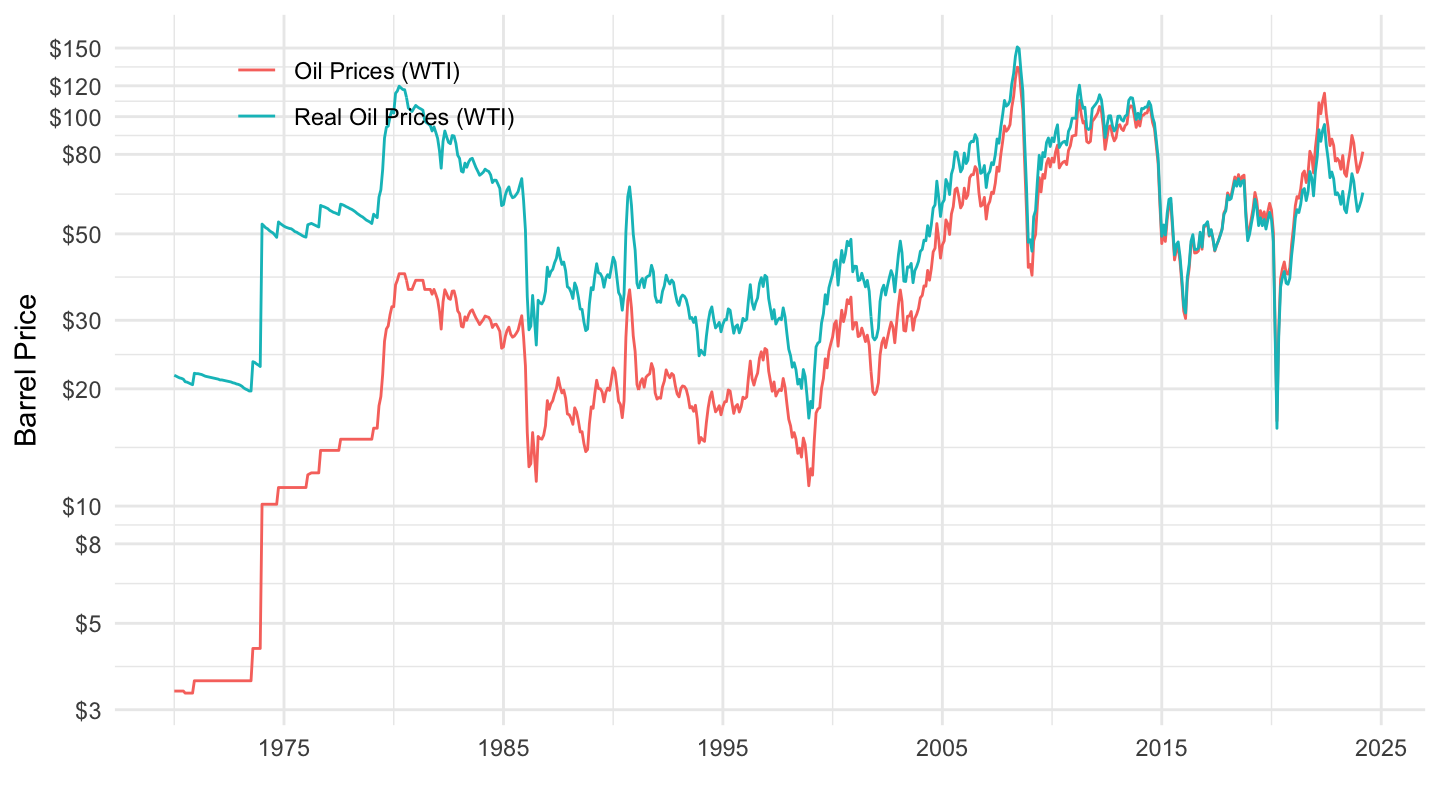
  • Share of oil went up and went down not mostly through substitution, but through a change in prices. (moreover: the household sector did some of the effort at the time…)

Changes in oil prices

Circular reasoning

  • Back to the initial quote, the authors refer to the energy import share in GNE a lot, arguing that it cannot rise too much. The argument: if the price of energy goes up too much (in some estimations, it goes up by a factor of 10) without there being a substantial reduction in the quantity of energy bought, then the energy import share will rise too much.

  • This is circular reasoning. If substitution is low, then yes the share of energy in consumption will rise a lot. Yet this is precisely what we experienced during the two oil shocks.

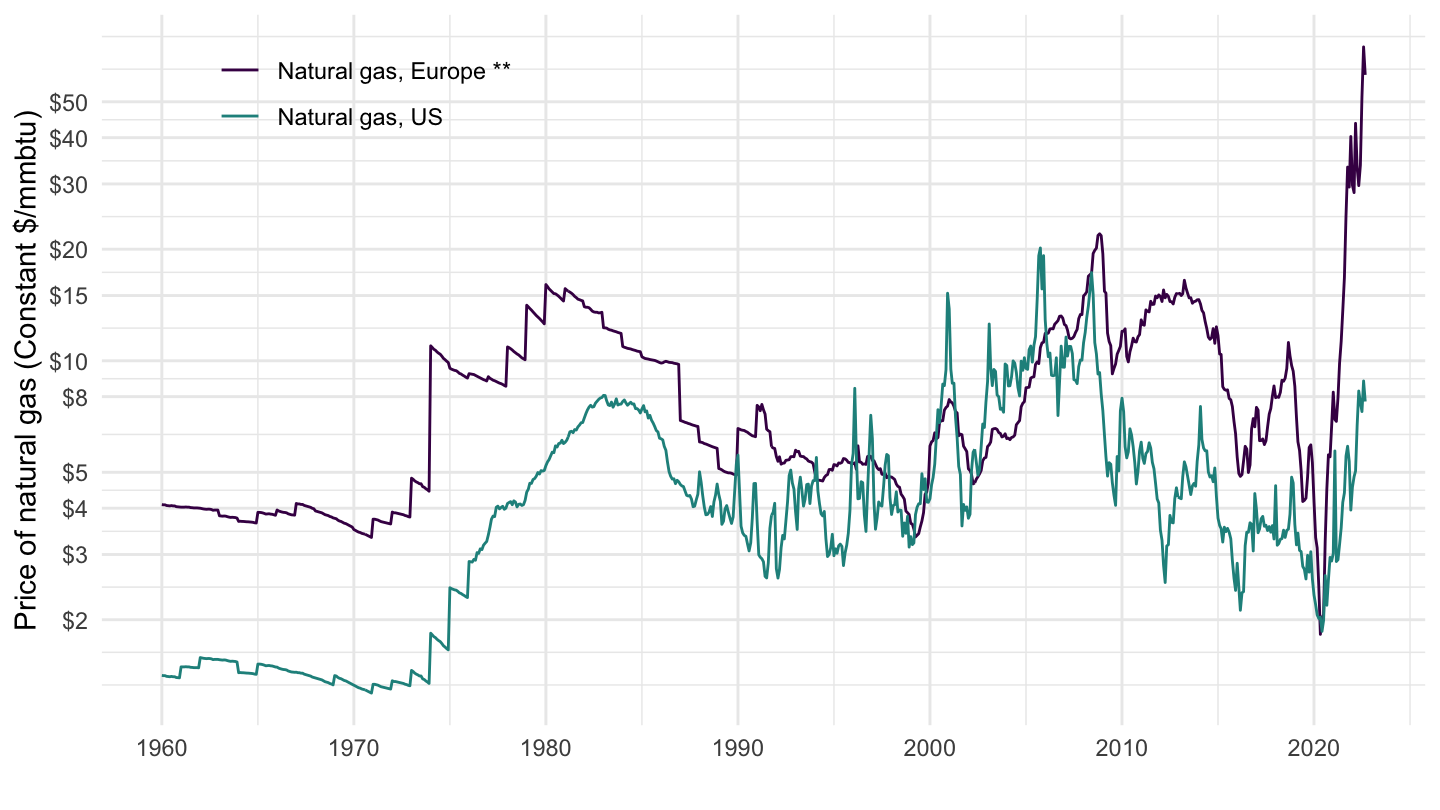
  • There are reasons to think that in fact, cutting Russian gas now would be much worse for Germany than the two oil shocks: the change in natural gas prices is already larger; and would be an order of magnitude larger if there was an embargo. (see next slide)

  • Moreover, because of low substitution, I don’t think indeed the price system would suffice, and there would be rationing. (i’ll come back to it) But this is precisely evidence in favor of limited substitution (to an extent that the price system would not be able to do its job), not against !

Natural gas price increases already greater (Source: World Bank)

Other thoughts

Elasticity optimism in neoclassical macro

  • One which macroeconomists are usually particularly interested in is the elasticity of substitution between capital and labor.

  • Harrod-Domar: Keynesian growth models had Leontief at the macroeconomic level So economists did not always believe that Leontief was “nonsensical”, even at the macroeconomic level.

  • Solow (1956) made substitution substantial => neoclassical growth model. The Cobb-Douglas production function was then used, which has an elasticity of substitution of \(1\).

  • Baqaee and Farhi (2019a): “a mixture of analytical tractability, as well as balanced-growth considerations, have made Cobb-Douglas the canonical production function for networks, multisector RBC models, and growth theory.”

Leontief is not nonsensical according to Samuelson

Samuelson, Economics textbook in 1948

Is the comparison with Covid-19 valid ?

Manufacturing: increasing returns to scale

  • I think that the comparison to Covid-19 is not valid. Drop in GDP during Covid-19 is largely replaced by home production (food at home vs. food away from home) industry / manufacturing is characterized by increasing returns to scale.

  • Baqaee-Farhi (2019): “Our formulas can also in principle be applied with increasing-returns to scale under the joint assumption of marginal-cost pricing and impossibility of shutting down production, by simply adding producer-specific fixed factors with negative marginal products and negative payments (these factors are “bads” that cannot be freely disposed of).” Of course, industries are worried about shutting down production, and going bankrupt. There are dynamic aspects to this as well. Macroeconomic elasticities are greater because some firms which are intensive in natural gas might actually exit the market. Industry requires long-term know-how, skills. Lots of fixed costs in industry => large irreversibilities. There are dynamic effects that the industry is rightly worried about.

  • Measuring the economic damage in € does not make much sense here. If you spend 100€ every month on heating, and the same on restaurants, the 100€ on heating is “worth much more” (brings you more utility). The elasticity of substitution is much lower for energy, so the consumer surplus is much larger.

Concluding thoughts

Many other issues I did not touch on

  • Focused on the issues that were not emphasized as much in the debate thus far; and in particular on the role of Baqaee-Farhi. But of course there are other issues that others have raised before.

  • The production function approach with a 2.3% GDP drop implies a tenfold increase in the price of natural gas. At the same time, the authors (and most economists) advocate in favor of letting the price-signal act to reduce natural gas consumption efficiently. To me, it’s clear there would need to be rationing since most residential consumers could not cope. (and people are sometimes on long-term contracts anyways)

  • There would be huge transfers involved: this tenfold increase in price would lead to a very important transfer from gas importing countries to gas exporting countries.

  • Appendix says that monetary policy needs to be at the same time expansionary (because an increase in energy prices is a drag on disposable income) and contractionary (in order to reduce inflation).

Conclusion

  • I am very sad that Emmanuel Farhi is not here today to settle the debate; he was a true intellectual, deeply committed to the power of ideas and research. In any case, I find that the current debate about the macroeconomic effects of a Russian gas embargo isn’t like Emmanuel. Emmanuel was a thoughtful, modest, and careful scholar. Based on his previous research, I don’t think he would have handled this controversy in this way, or be comfortable using such strong statements (e.g. “Leontief is nonsensical”).

  • I am very glad that some academic economists have tried to assess the consequences of a Russian gas embargo using his tools. Emmanuel was deeply concerned about the real-world applications of his models. Yet I am not comfortable with the way this was done in Bachmann et al. (2022). I think David’s and Emmanuel’s work here may have been misused in this particular example.

  • Based on the above elements, I am in fact very confident that Emmanuel Farhi would not have claimed that his research was showing that the effects would be limited to 0.2-0.3% of GDP. In fact, I hope to have shown that if anything, his previous joint work with David Baqaee suggests a much more nuanced view of what the effects of a Russian gas embargo would be.

Bibliography

Bachmann, Ruediger, David Baqaee, Christian Bayer, Moritz Kuhn, Andreas Löschel, Benjamin Moll, Andreas Peichl, Karen Pittel, and Moritz Schularick. 2022. “What If? The Economic Effects for Germany of a Stop of Energy Imports from Russia.” 36. ifo Institute - Leibniz Institute for Economic Research at the University of Munich.

Baqaee, David Rezza, and Emmanuel Farhi. 2019a. “The Macroeconomic Impact of Microeconomic Shocks: Beyond Hulten’s Theorem.” Econometrica 87 (4): 1155–1203.

———. 2019b. JEEA- FBBVA Lecture 2018: The Microeconomic Foundations of Aggregate Production Functions.” Journal of the European Economic Association 17 (5): 1337–92.

———. 2021. “Networks, Barriers, and Trade.” Working {Paper} 26108. National Bureau of Economic Research.

Labandeira, Xavier, José M. Labeaga, and Xiral López-Otero. 2017. “A Meta-Analysis on the Price Elasticity of Energy Demand.” Energy Policy 102 (March): 549–68.