Lecture 3 - Superstars in Music, Sports and Entertainment
UCLA - Econ 19 - Fall 2018
Sherwin Rosen, in the American Scholar, writes:
Performers of first rank comprise a limited handful out of these small totals and have very large incomes. There are also known to be substantial differences in income between them and those in the second rank, even though most consumers would have difficulty detecting more than minor differences in a “blind” hearing.
What Sherwin Rosen says is that there are very few differences in talents at the very top.
The elusive quality of “box office appeal,” the ability to attract an audience and generate a large volume of transactions, is the issue that must be confronted. Recognition that one’s personal market scale is important, in the theory of income distribution has a long history, but the idea has not been developed very extensively in the literature.
Rest assured that prospective impresarios will receive no guidance here on what makes for box office appeal, sometimes said to involve a combination of talent and charisma in uncertain proportions. In the formal model all that is taken for granted and represented by a single factor rather than by two, an index q labeled talent or quality.
Albert Rees is a good introduction to the size distribution of income. The selectivity effects of differential talent and comparative advantage on the skew in income distributions are spelled out in my 1978 article, also see the references there. Melvin Reder’s survey touches some of the issues raised here.
Of course social scientists and statisticians have had a long standing fascination with rank-size relationships, as perusal of the many entries in the Encyclopedia of the Social Sciences will attest.
Statistical Distributions for Superstars
We use the methods we saw in course 2 and plot the log rank on the y axis against the log of the outcome of interest (revenues, number of views, number of sales, etc.) We show that many of these distributions associated to superstar phenomena display a Pareto-like behavior in the tail: this means that there are very many observations which deviate substantially from the mean, and that earnings and success accrue disproportionately to the very top.
Pollstar Data
| rank | Artist | Total |
|---|---|---|
| 1 | Lady Gaga | 223300 |
| 2 | Drake | 98900 |
| 3 | Michael Buble | 97500 |
| 4 | Pentatonix | 81800 |
| 5 | Korn | 62600 |
| 6 | twenty one pilots | 49900 |
| 7 | Trans-Siberian Orchestra | 49700 |
| 8 | Leonard Cohen | 45300 |
| 9 | The Weeknd | 39800 |
| 10 | Kanye West | 38000 |
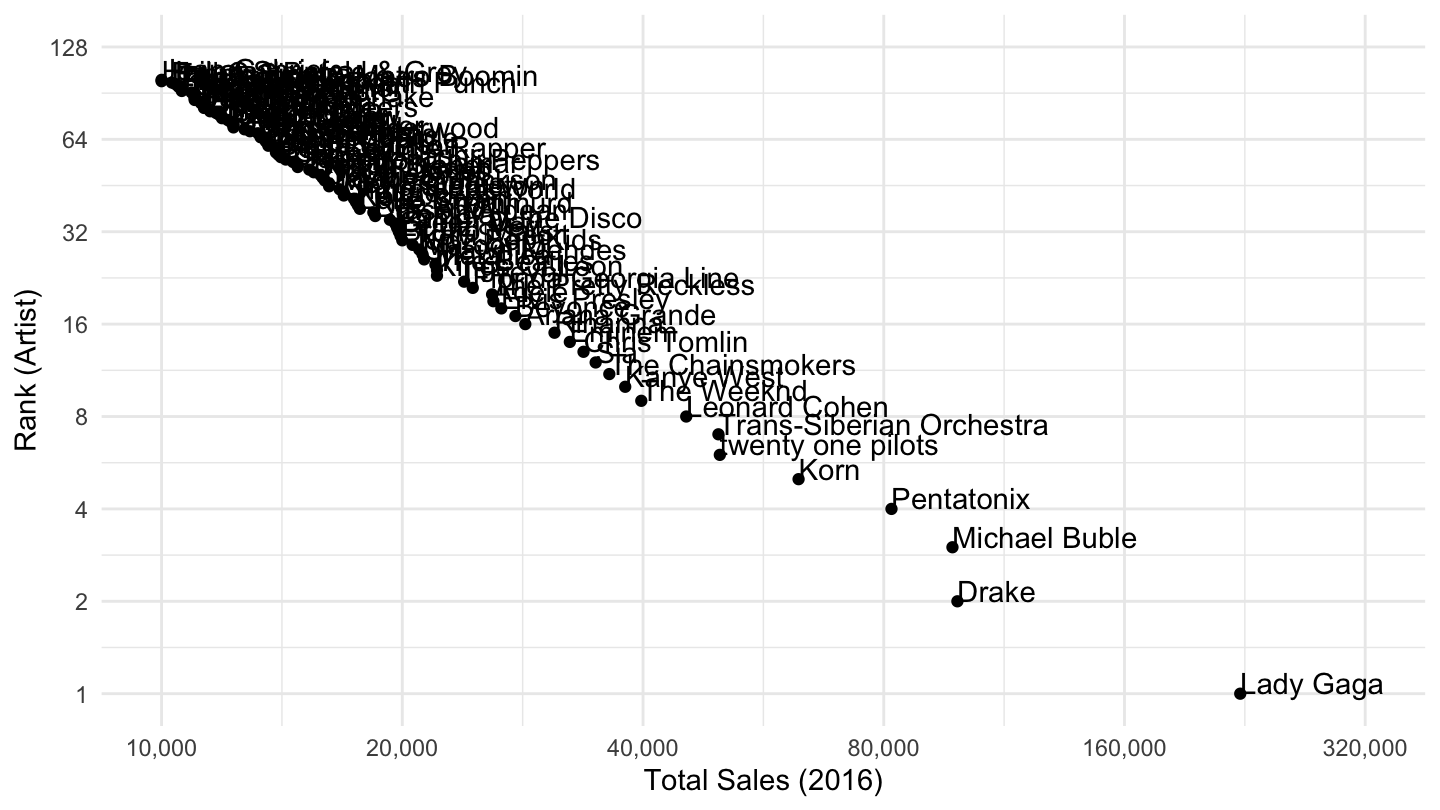
Figure 1: List of most sold albums. Source: Pollstar
Most-downloaded songs in the United Kingdom
The data comes from the following Wikipedia entry: List of most-downloaded songs in the United Kingdom.
| No. | Artist | Song | Copies sold[a] |
|---|---|---|---|
| 1 | Pharrell Williams | “Happy” | 1,922,000[3] |
| 2 | Adele | “Someone Like You” | 1,637,000+[4] |
| 3 | Robin Thicke featuring T.I. and Pharrell Williams | “Blurred Lines” | 1,620,000+ |
| 4 | Maroon 5 featuring Christina Aguilera | “Moves Like Jagger” | 1,500,000+ |
| 5 | Gotye featuring Kimbra | “Somebody That I Used to Know” | 1,470,000+ |
| 6 | Daft Punk featuring Pharrell Williams | “Get Lucky” | 1,400,000+ |
| 7 | The Black Eyed Peas | “I Gotta Feeling” | 1,350,000+ |
| 8 | Avicii | “Wake Me Up” | 1,340,000+ |
| 9 | Rihanna featuring Calvin Harris | “We Found Love” | 1,337,000+ |
| 10 | Kings of Leon | “Sex on Fire” | 1,293,000+ |
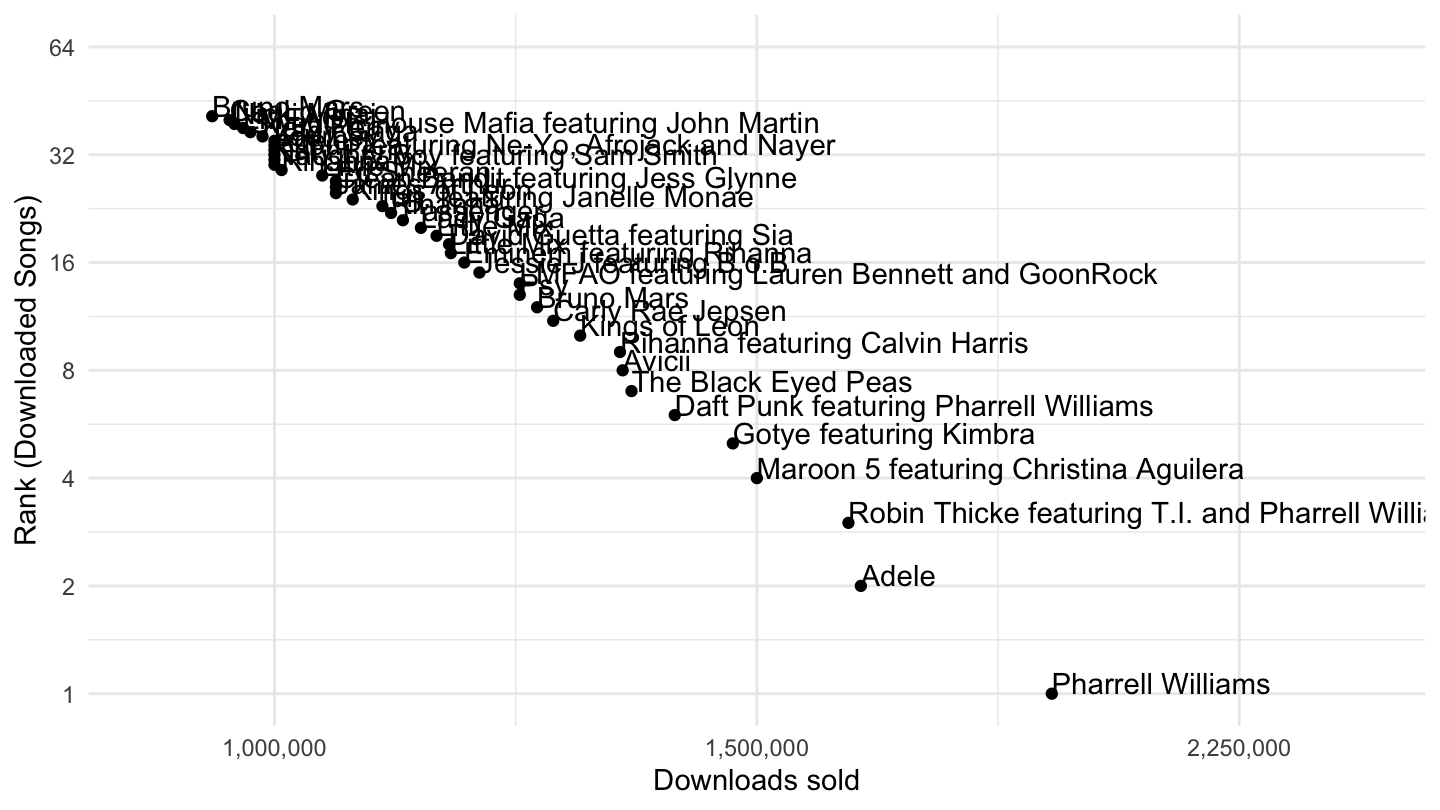
Figure 2: List of most downloaded songs in the United Kingdom, Pareto Plot.
Most-streamed songs on Spotify
The data comes from the following Wikipedia entry: List of most-streamed songs on Spotify.
| Rank | song | value | date |
|---|---|---|---|
| 1 | Shape of You | 2162 | 6 January 2017 |
| 2 | One Dance | 1681 | 5 April 2016 |
| 3 | Rockstar | 1549 | 15 September 2017 |
| 4 | Closer | 1535 | 29 July 2016 |
| 5 | Thinking Out Loud | 1326 | 21 June 2014 |
| 6 | God’s Plan | 1284 | 19 January 2018 |
| 7 | Lean On | 1232 | 2 March 2015 |
| 8 | Despacito (Remix) | 1228 | 17 April 2017 |
| 9 | Havana | 1217 | 3 August 2017 |
| 10 | Love Yourself | 1213 | 9 November 2015 |
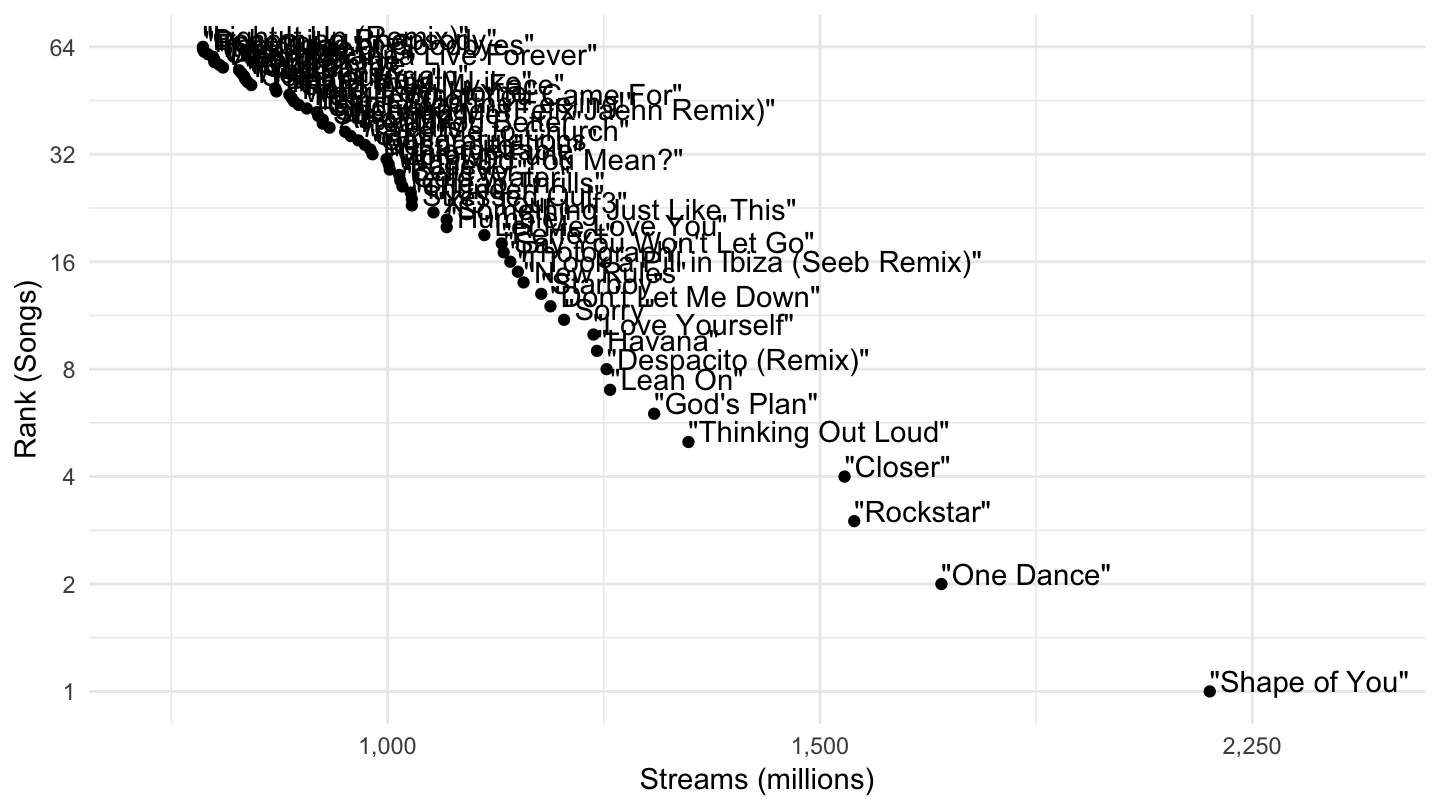
Figure 3: List of most streamed songs on Spotify, Pareto Plot.
Most-viewed YouTube videos
The data comes from the following Wikipedia entry: List of most-viewed YouTube videos.
We then display the first rows of the data:| Rank | video | value |
|---|---|---|
| 1 | Despacito[17] | 6.20 |
| 2 | Shape of You[22] | 4.21 |
| 3 | See You Again[23] | 4.11 |
| 4 | †Masha and the Bear – Recipe for Disaster[30] | 3.59 |
| 5 | Uptown Funk[31] | 3.56 |
| 6 | Gangnam Style[32] | 3.35 |
| 7 | Sorry[37] | 3.13 |
| 8 | Sugar[38] | 2.96 |
| 9 | Roar[39] | 2.82 |
| 10 | Baby Shark Dance[40] | 2.78 |
The first 100 top Youtube videos have been seen a couple billion times:
- Luis Fonsi - Despacito ft. Daddy Yankee: 5.7 Billion
- Ed Sheeran - Shape of You: 3.88 Billion
- Wiz Khalifa - See You Again ft. Charlie Puth: 3.84 Billion
- etc.
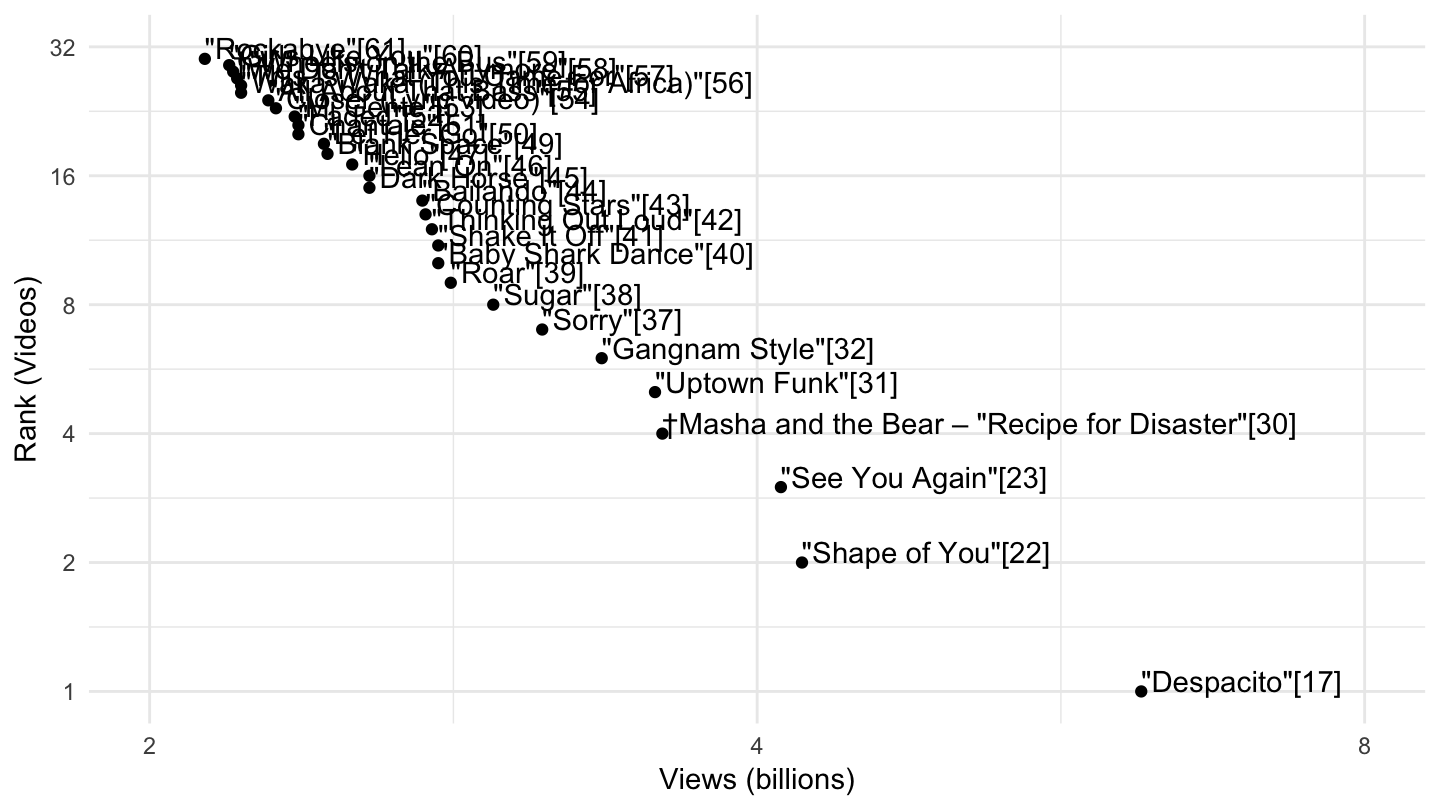
Figure 4: List of most viewed Youtube videos, Pareto Plot.
Highest paid American television stars
The data comes from the following Wikipedia entry: List of highest paid American television stars.
Network primetime salaries per episode
We then display the first rows of the data:| Name | Program | Role | Salary |
|---|---|---|---|
| Simon Cowell | The X Factor | Judge | $75 million |
| Katy Perry | American Idol | Judge | $25 million |
| Jennifer Lopez | American Idol | Judge | $20 million |
| Mariah Carey | American Idol | Judge | $18 million |
| Christina Aguilera | The Voice | Coach | $17 million |
| Hugh Laurie | House | Gregory House | $15 million |
| Ryan Seacrest | American Idol | Host | $15 million |
| Britney Spears | The X Factor | Judge | $15 million |
| Miley Cyrus | The Voice | Coach | $13 million |
| Adam Levine | The Voice | Coach | $13 million |
Highest grossing concert tours
The data comes from the following Wikipedia entry: List of highest-grossing concert tours. We first input the data from the Wikipedia page, using the rvest package to extract tables from the html source code:
| Rank | Actual gross | Gross Infl Adj | Artist |
|---|---|---|---|
| 1 | $736,421,584 | $820,194,986 | U2 |
| 2 | $573,300,000 | $573,300,000 | Ed Sheeran |
| 3 | $563,300,000 | $563,300,000 | Guns N’ Roses |
| 4 | $558,255,524 | $674,547,559 | The Rolling Stones |
| 5 | $523,033,675 | $546,023,369 | Coldplay |
| 6 | $458,673,798 | $493,336,432 | Roger Waters |
| 7 | $441,121,000 | $506,821,305 | AC/DC |
| 8 | $407,713,266 | $476,474,639 | Madonna |
| 9 | $389,047,636 | $483,515,954 | U2 |
| 10 | $364,300,000 | $364,300,000 | Garth Brooks and Trisha Yearwood |
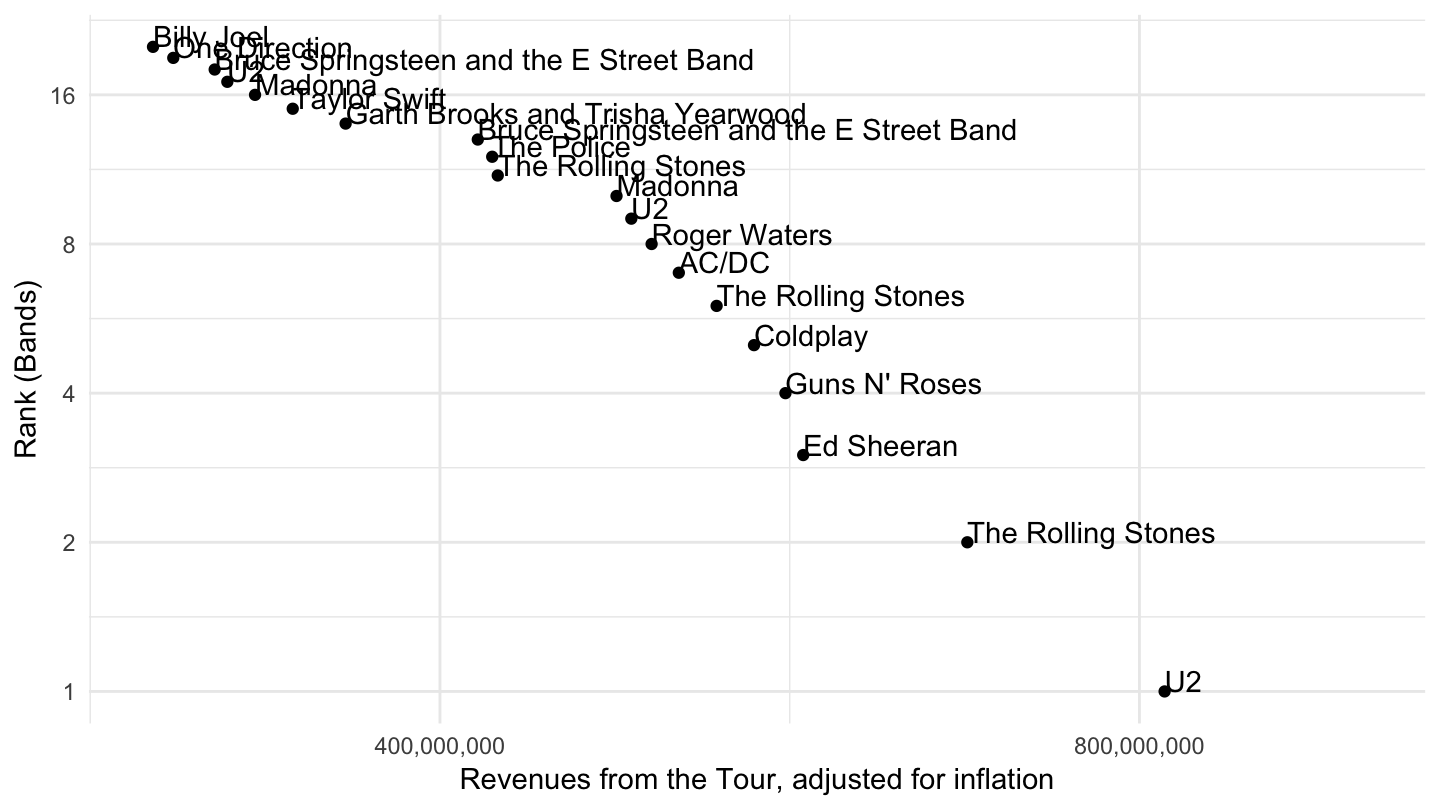
Figure 5: List of Highest Grossing Concerts, Pareto Plot.
Highest paid film actors
The data comes from the following Wikipedia entry: List of highest paid film actors. We first input the data from the Wikipedia page, using the rvest package to extract tables from the html source code:
| Actor | Film | Year | Salary | Total income |
|---|---|---|---|---|
| Keanu Reeves | The Matrix ReloadedThe Matrix Revolutions | 2003 | $30,000,000 | $156,000,000 |
| Bruce Willis | The Sixth Sense | 1999 | $14,000,000 | $100,000,000 |
| Tom Cruise | Mission: Impossible 2 | 2000 | $100,000,000 | |
| Tom Cruise | War of the Worlds | 2005 | $100,000,000 | |
| Will Smith | Men in Black 3 | 2012 | $100,000,000 | |
| Robert Downey, Jr. | Avengers: Infinity War | 2018 | $75,000,000+ | |
| Robert Downey, Jr. | Iron Man 3 | 2013 | $75,000,000 | |
| Sandra Bullock | Gravity | 2013 | $20,000,000 | $70,000,000+ |
| Tom Hanks | Forrest Gump | 1994 | $70,000,000 | |
| Tom Cruise | Mission: Impossible | 1996 | $70,000,000 | |
| Harrison Ford | Indiana Jones and the Kingdom of the Crystal Skull | 2008 | $65,000,000 | |
| Jack Nicholson | Batman | 1989 | $6,000,000 | $60,000,000 |
| Leonardo DiCaprio | Inception | 2010 | $59,000,000 | |
| Robert Downey, Jr. | Captain America: Civil War | 2016 | $40,000,000 | $40,000,000+ |
| Robert Downey, Jr. | Avengers: Age of Ultron | 2015 | $40,000,000 |
Largest sports contracts
The data comes from the following Wikipedia entry: List of largest sports contracts.
We then display the first rows of the data:| Player | Sport | length | value |
|---|---|---|---|
| Mike Trout | Baseball | 12 years (2019–2030) | $426,500,000 |
| Canelo Álvarez | Boxing | 5 years (2018–2023) | $365,000,000 |
| Bryce Harper | Baseball | 13 years (2019–2031) | $330,000,000 |
| Giancarlo Stanton | Baseball | 13 years (2015–2027) | $325,000,000 |
| Manny Machado | Baseball | 10 years (2019–2028) | $300,000,000 |
| Alex Rodriguez1R | Baseball | 10 years (2008–2017) | $275,000,000 |
| Nolan Arenado | Baseball | 8 years (2019-2026) | $260,000,000 |
| Alex Rodriguez2R | Baseball | 10 years (2001–2010) | $252,000,000 |
| Miguel Cabrera | Baseball | 8 years (2016–2023) | $247,000,000 |
| Robinson Canó | Baseball | 10 years (2014–2023) | $240,000,000 |
Other examples
Billionaires from Forbes
Preparing the data from the Forbes Website.
The first 25 billionaires are:| Rank | Billionaire | wealth | source |
|---|---|---|---|
| 1 | Bill Gates | 79.2 | Microsoft |
| 2 | Carlos Slim Helu & family | 77.1 | telecom |
| 3 | Warren Buffett | 72.7 | Berkshire Hathaway |
| 4 | Amancio Ortega | 64.5 | Zara |
| 5 | Larry Ellison | 54.3 | Oracle |
| 6 | Charles Koch | 42.9 | diversified |
| 6 | David Koch | 42.9 | diversified |
| 8 | Christy Walton & family | 41.7 | Wal-Mart |
| 9 | Jim Walton | 40.6 | Wal-Mart |
| 10 | Liliane Bettencourt & family | 40.1 | L’Oreal |
| 11 | Alice Walton | 39.4 | Wal-Mart |
| 12 | S Robson Walton | 39.1 | Wal-Mart |
| 13 | Bernard Arnault & family | 37.2 | LVMH |
| 14 | Michael Bloomberg | 35.5 | Bloomberg LP |
| 15 | Jeff Bezos | 34.8 | Amazon.com |
| 16 | Mark Zuckerberg | 33.4 | |
| 17 | Li Ka-shing | 33.3 | diversified |
| 18 | Sheldon Adelson | 31.4 | casinos |
| 19 | Larry Page | 29.7 | |
| 20 | Sergey Brin | 29.2 | |
| 21 | Georg Schaeffler | 26.9 | ball bearings |
| 22 | Forrest Mars Jr | 26.6 | candy |
| 22 | Jacqueline Mars | 26.6 | candy |
| 22 | John Mars | 26.6 | candy |
| 25 | David Thomson & family | 25.5 | media |
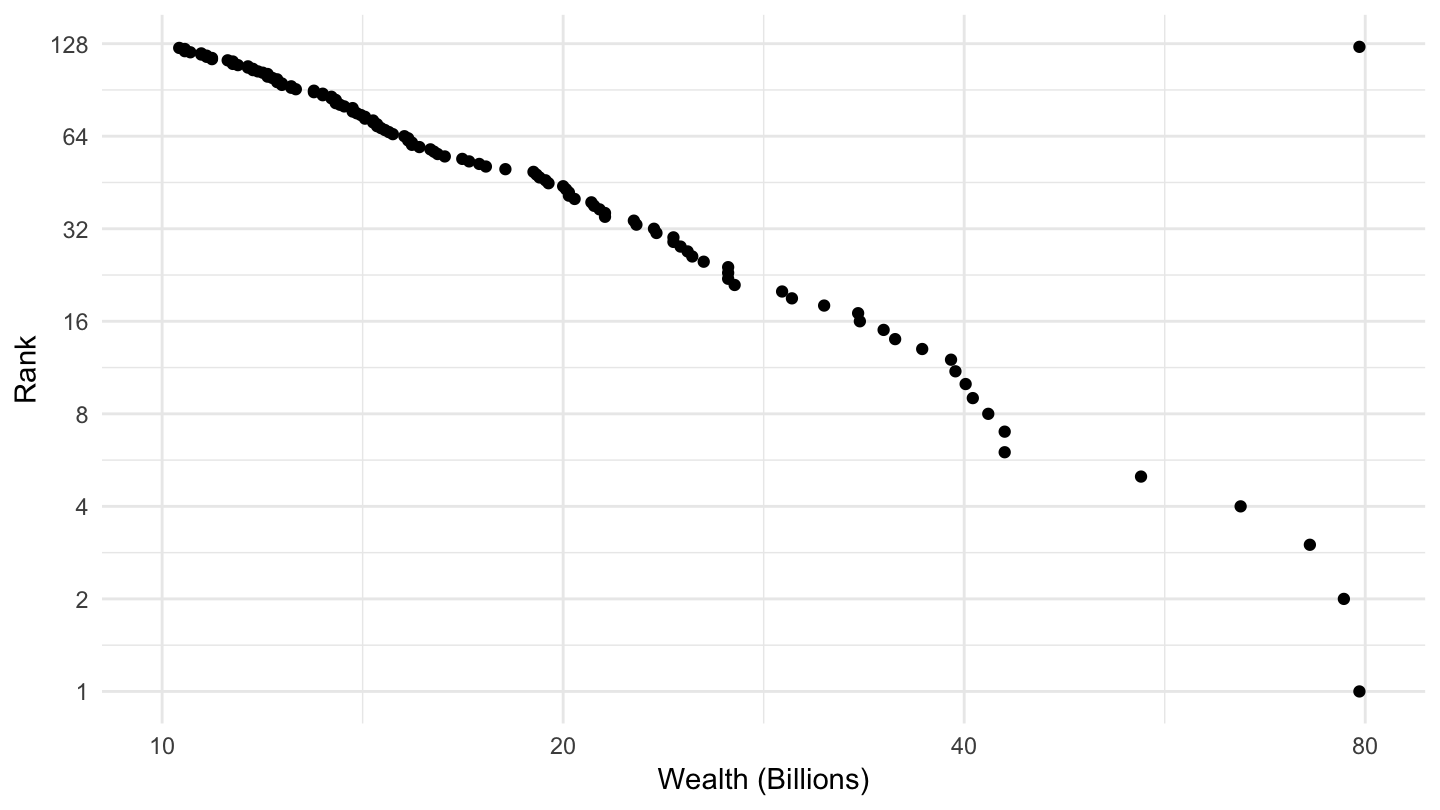
Figure 6: List of Top Wealth Holders according to Forbes, Pareto Plot.
The Pareto distribution does not work very well for the very top (Bill Gates is not rich enough!)
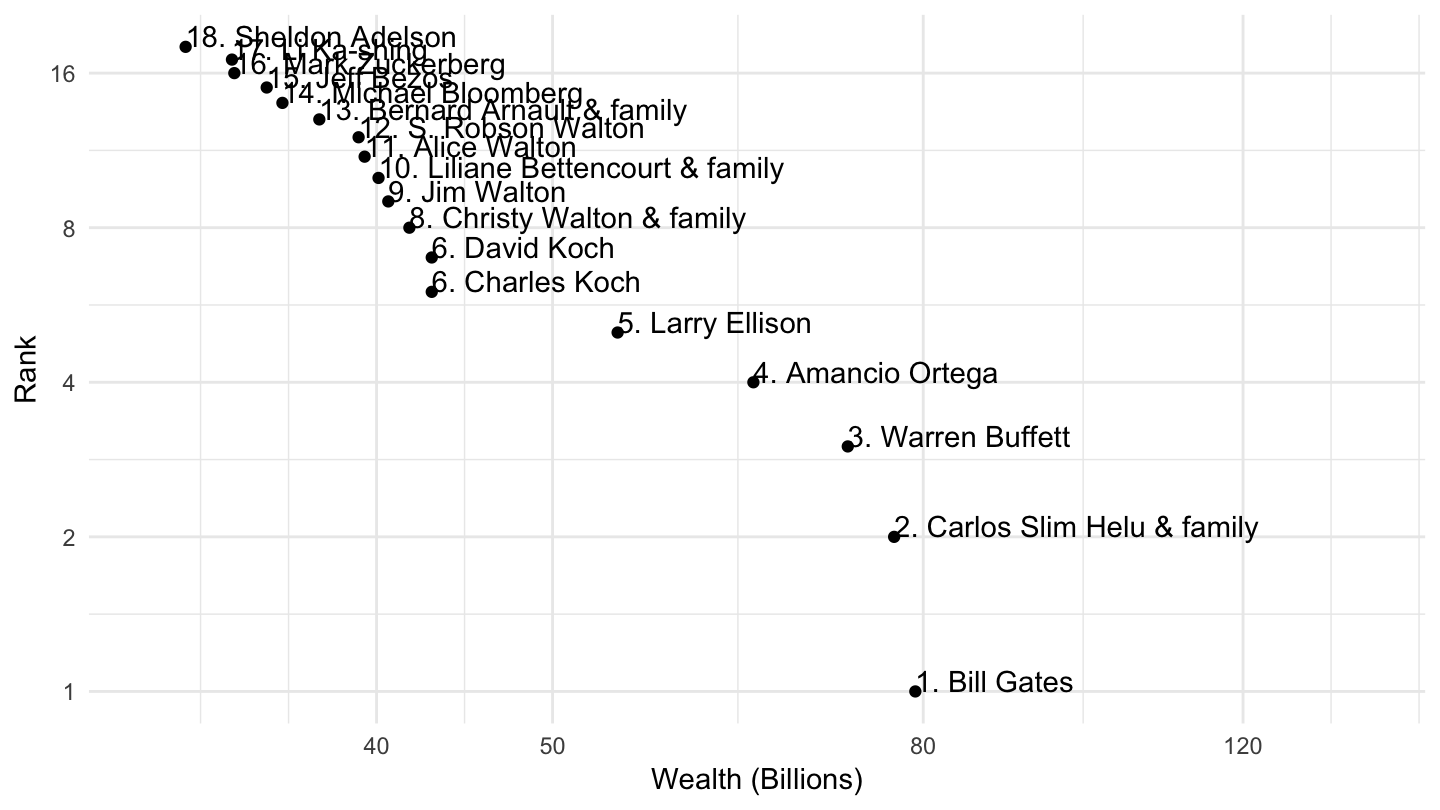
Figure 7: List of Top Wealth Holders according to Forbes (> 30 billion), Pareto Plot.
Salaries at the University of California (UC)
The salaries at the University of California are public and available at this website: https://ucannualwage.ucop.edu/wage/
The distribution in the tail at the University of California is really well approximated by a Pareto distribution. Below is the plot of wages higher than $250K.
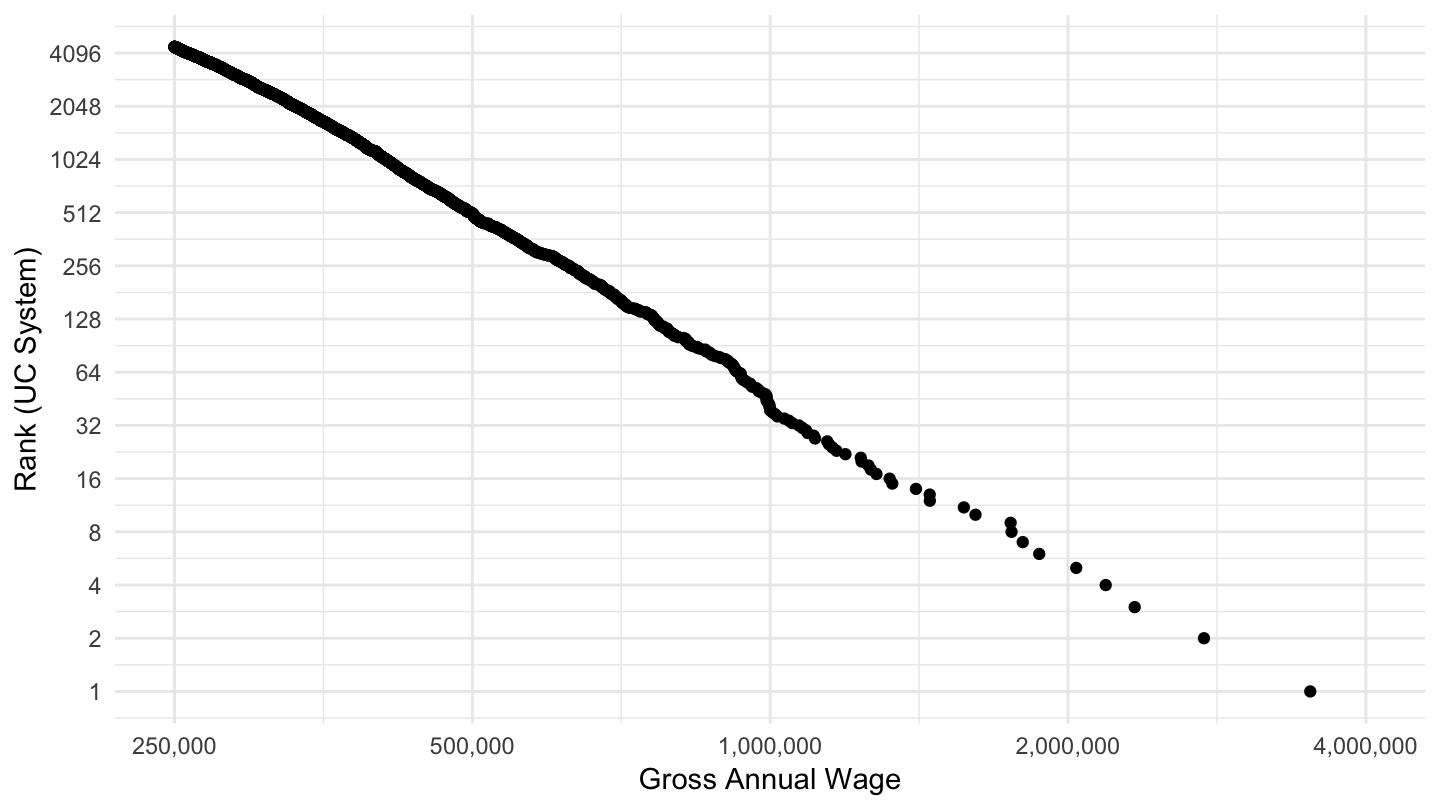
Figure 8: Distribution of Wage Incomes in the UC System (>250 K), Pareto Plot.
The distribution in the tail at the University of California is really well approximated by a Pareto distribution. Below is the plot of wages higher than $400K.
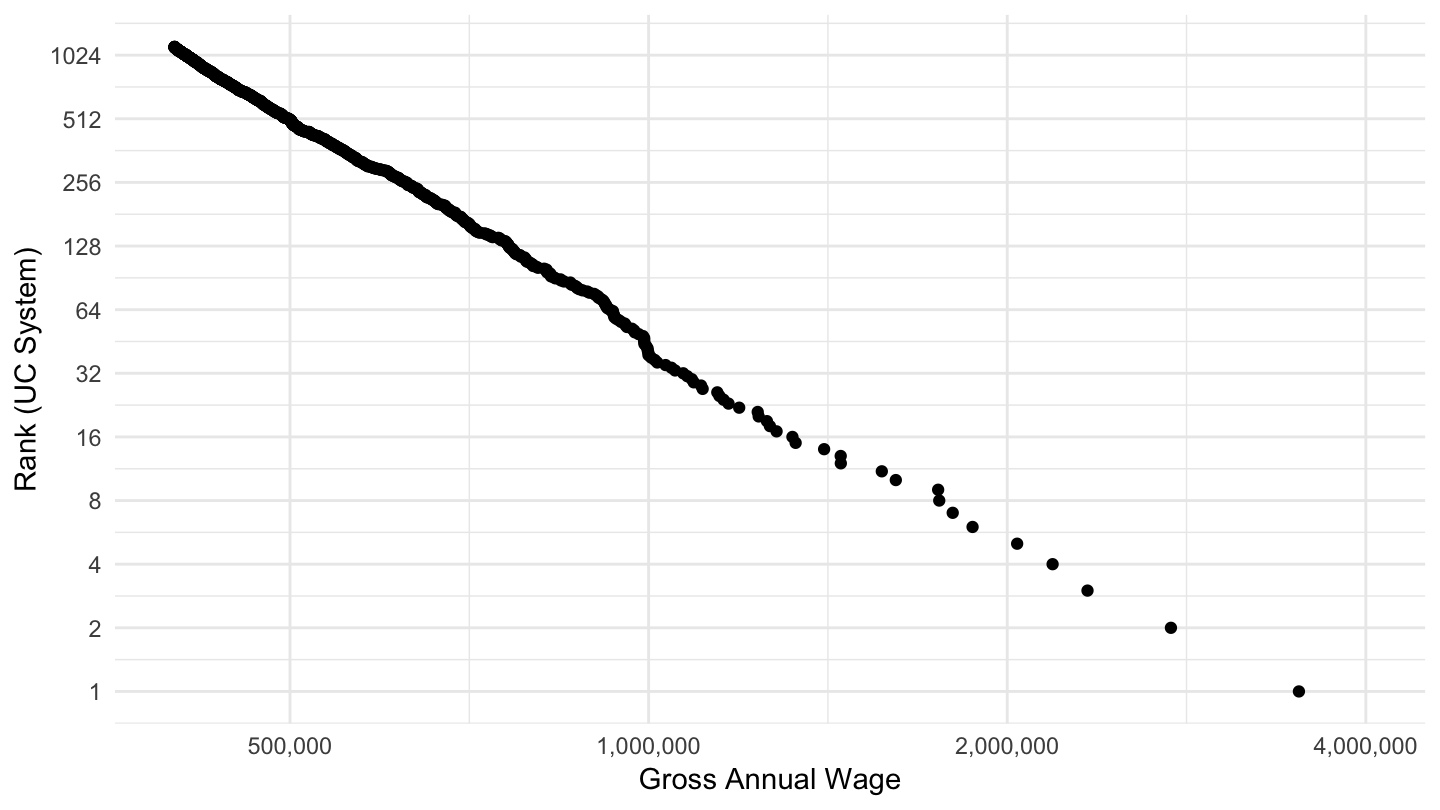
Figure 9: Distribution of Wage Incomes in the UC System (>400 K), Pareto Plot.
Below is a zoom on the distribution of wages higher than 1.5 million annual. You can see that the highest paid superstars on campus are the Head Coaches, and superstar physicians. Again, it is striking that these distributions are very well approximated by a Pareto distribution.
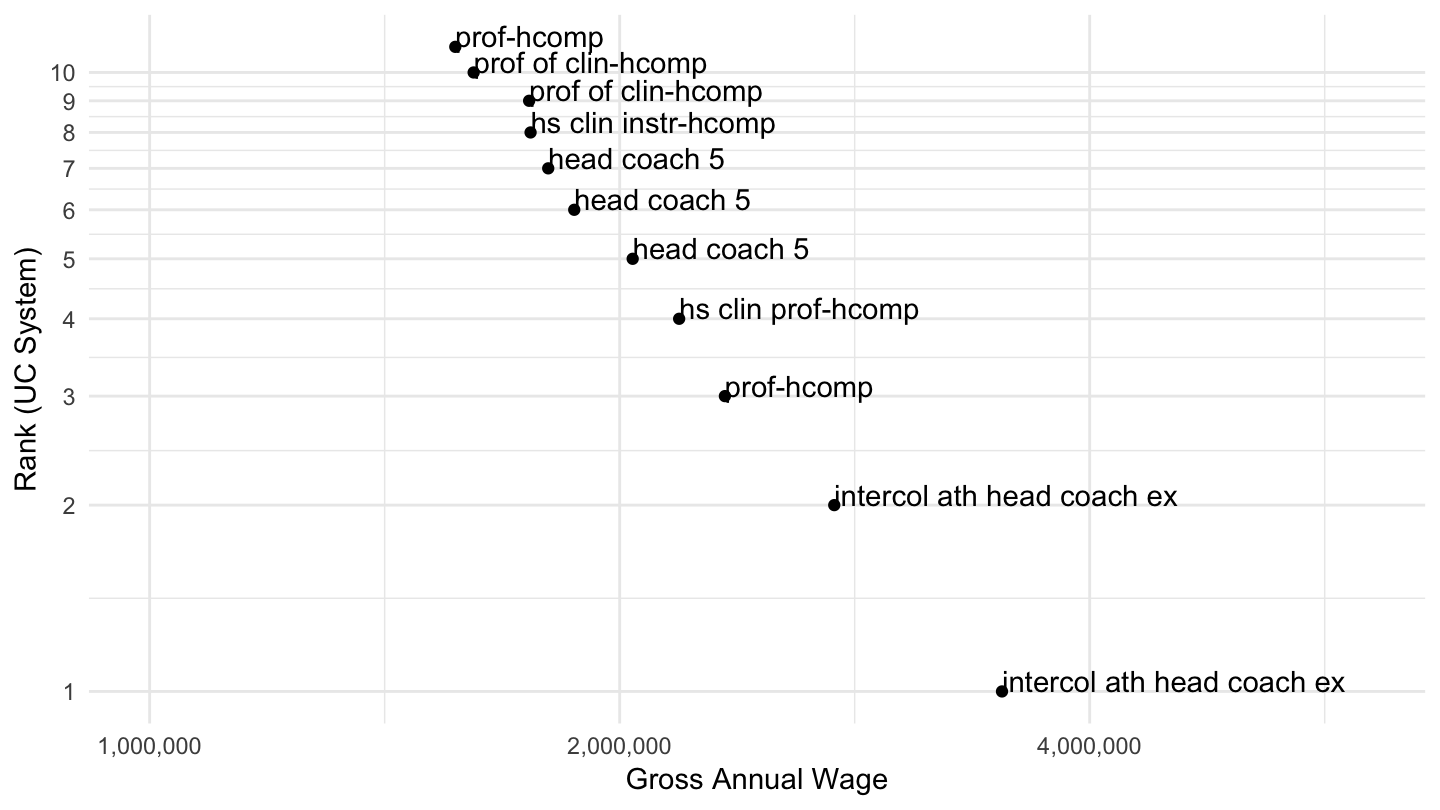
Figure 10: Distribution of Wage Incomes in the UC System (>400 K), Pareto Plot.
Market for Executive Officers in large firms
Again, from Sherwin Rosen:
Such considerations are important for understanding the market for executive officers in large firms. Unusually good information on executive compensation is available from public proxy statements circulated to stockholders by requirement of the Securities and Exchange Commission. Examination of these statements is instructive. They reveal Superstar-scale rewards that are highly concentrated among the top half-dozen executives in these firms. More detailed study indicates that the top incomes vary systematically with the size of the organization. Large firms pay executives more than smaller firms do. Even the occasional, well-publicized dollar-a-year man falls in line once stock options, pensions, and other forms of deferred compensation are properly accounted. The value to the organization of good top-level decisions and avoidance of bad decisions is abundantly clear once the nature of control of resources on such a vast scale is considered.
Common use of the term Officer for corporate executives Suggests certain parallels with the military. A good or bad decision by a platoon leader does not have much effect on the overall fortunes of war, but the same cannot be said of decisions made by the chief strategists. The value of extra talent is much larger at the top of the organizational hierarchy than at the bottom because those decisions percolate through the enterprise, and they have much further to travel in a larger enterprise than in a smaller one.