
November 2, 2020
Context
Negative yielding debt
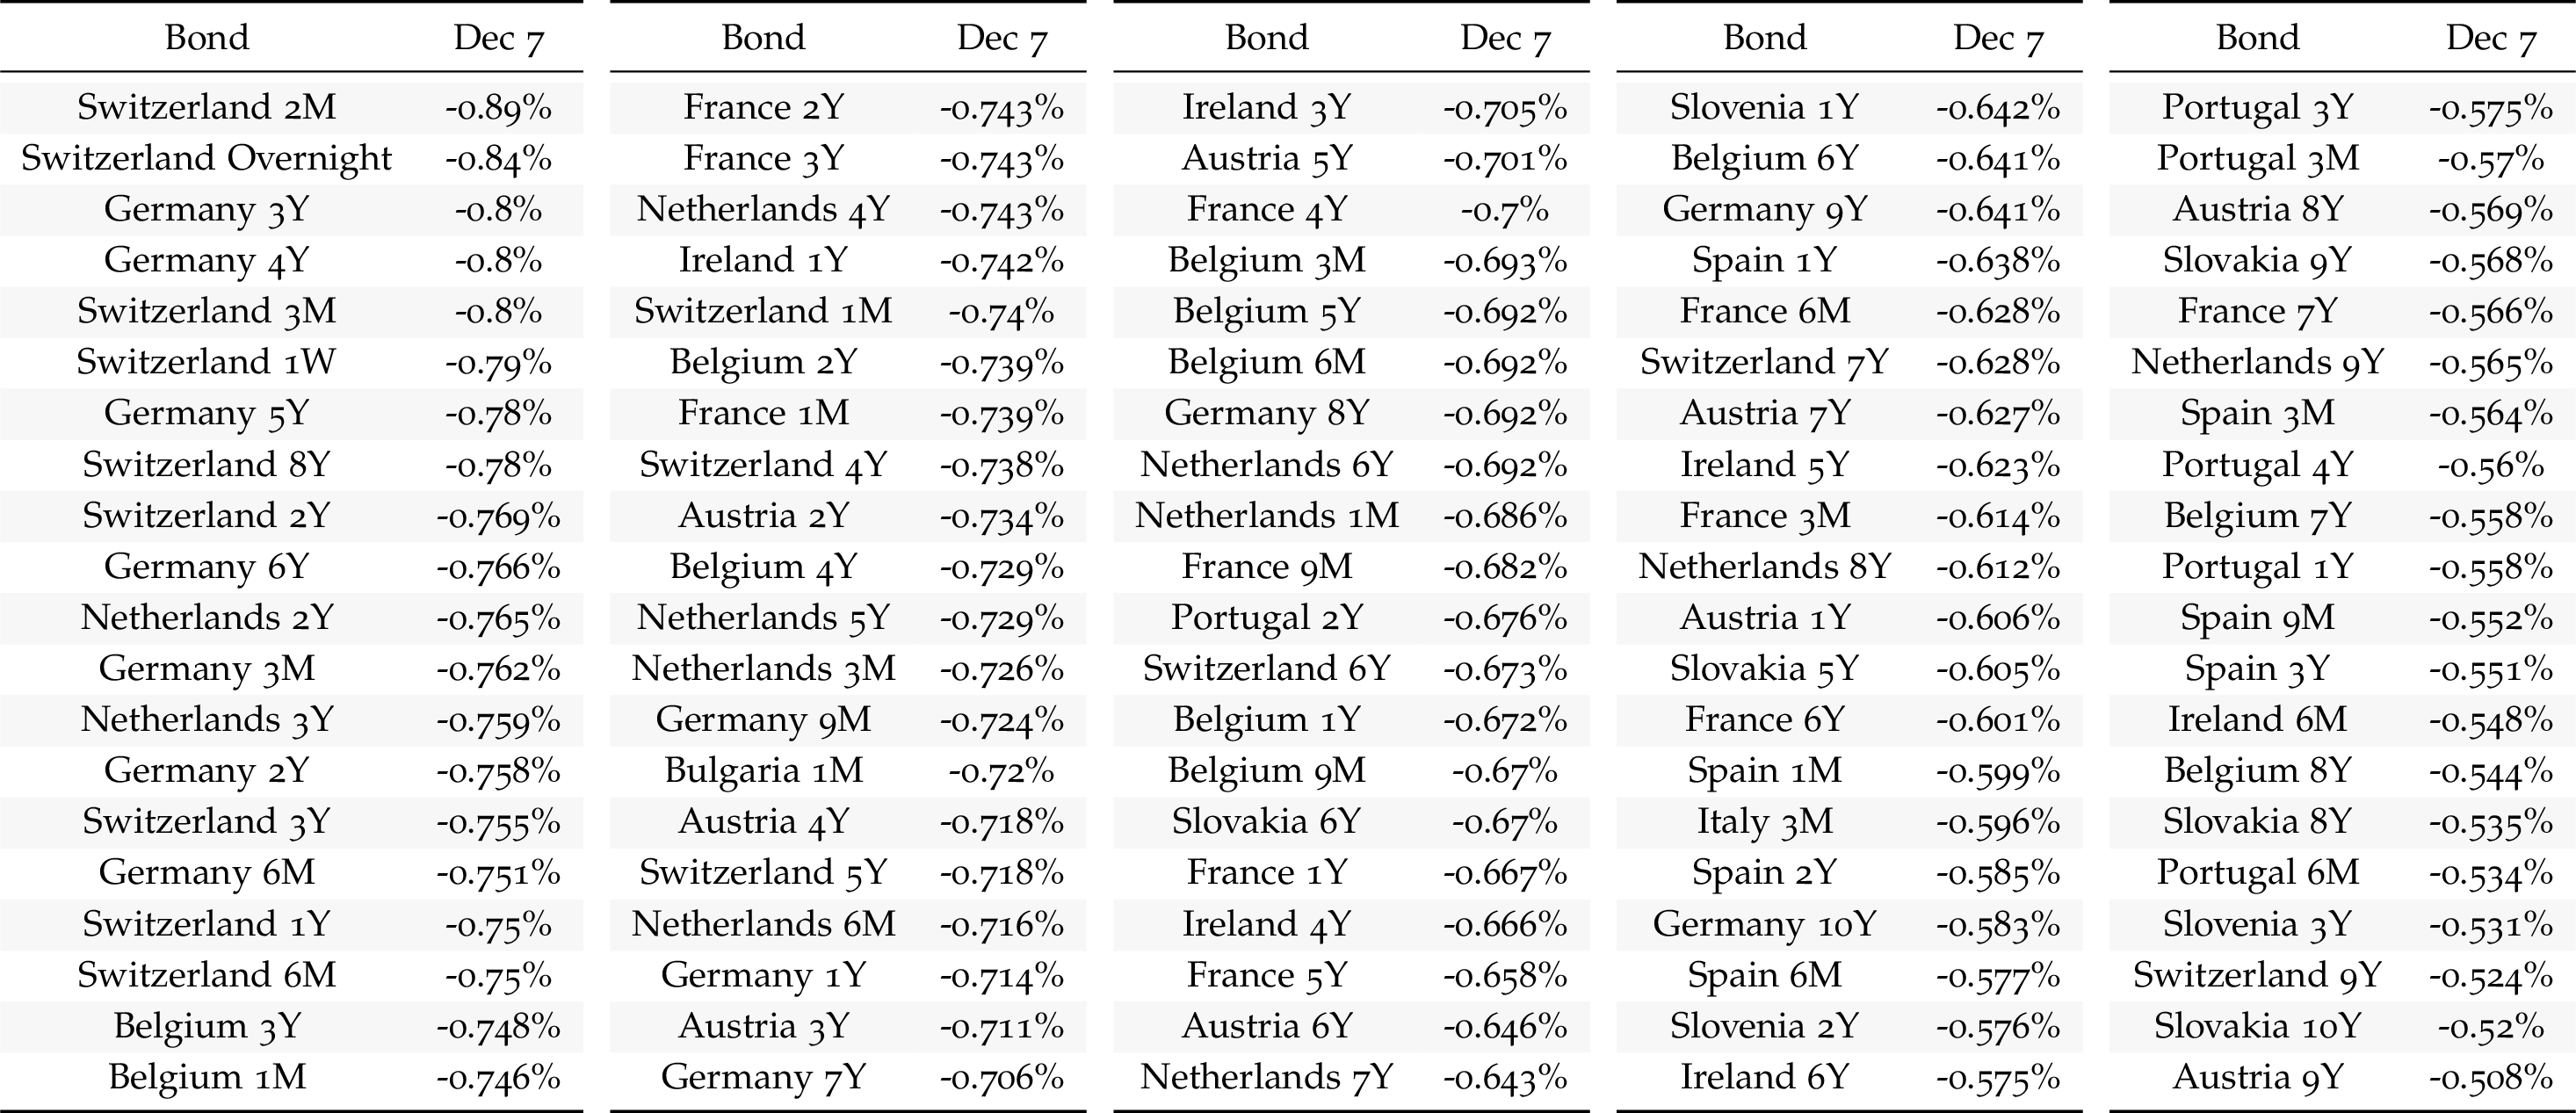
Negative yielding debt

r > g or r < g?
Return on equities: Jorion and Goetzmann (1999)

Triumph of the Optimists - Dimson, Marsh, and Staunton (2009)
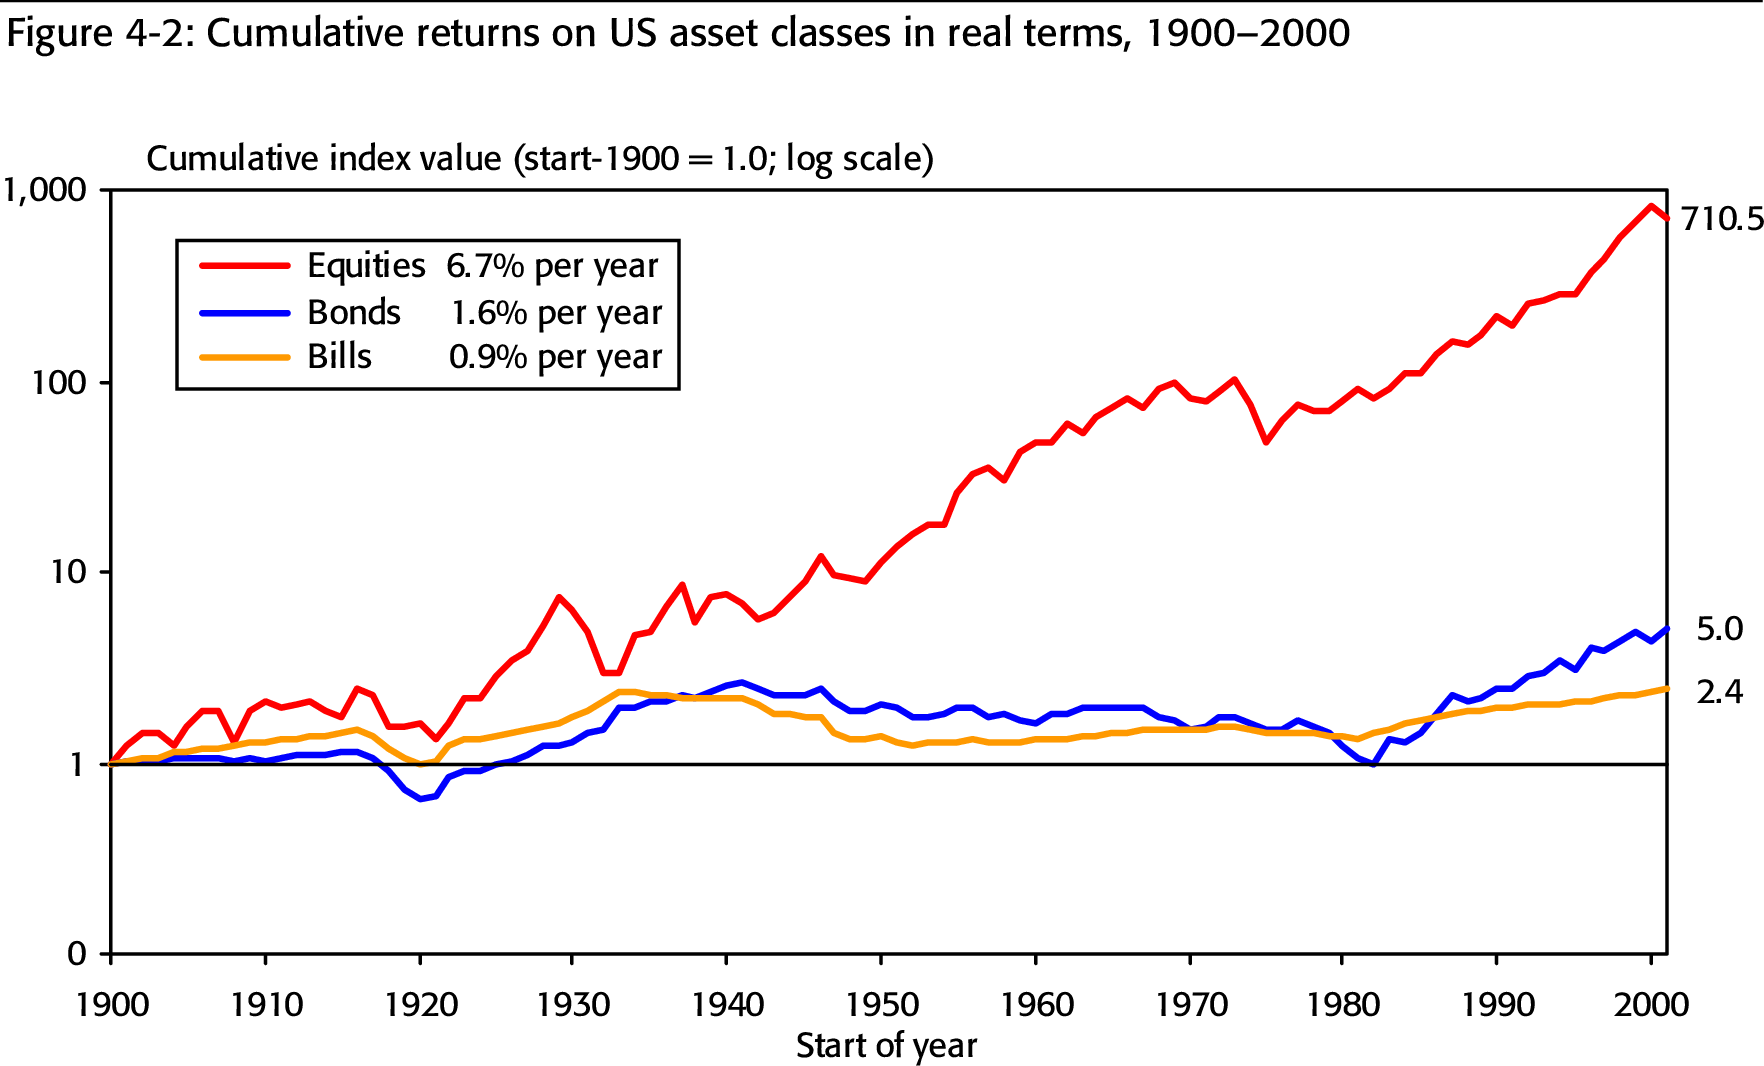
Triumph of the Optimists
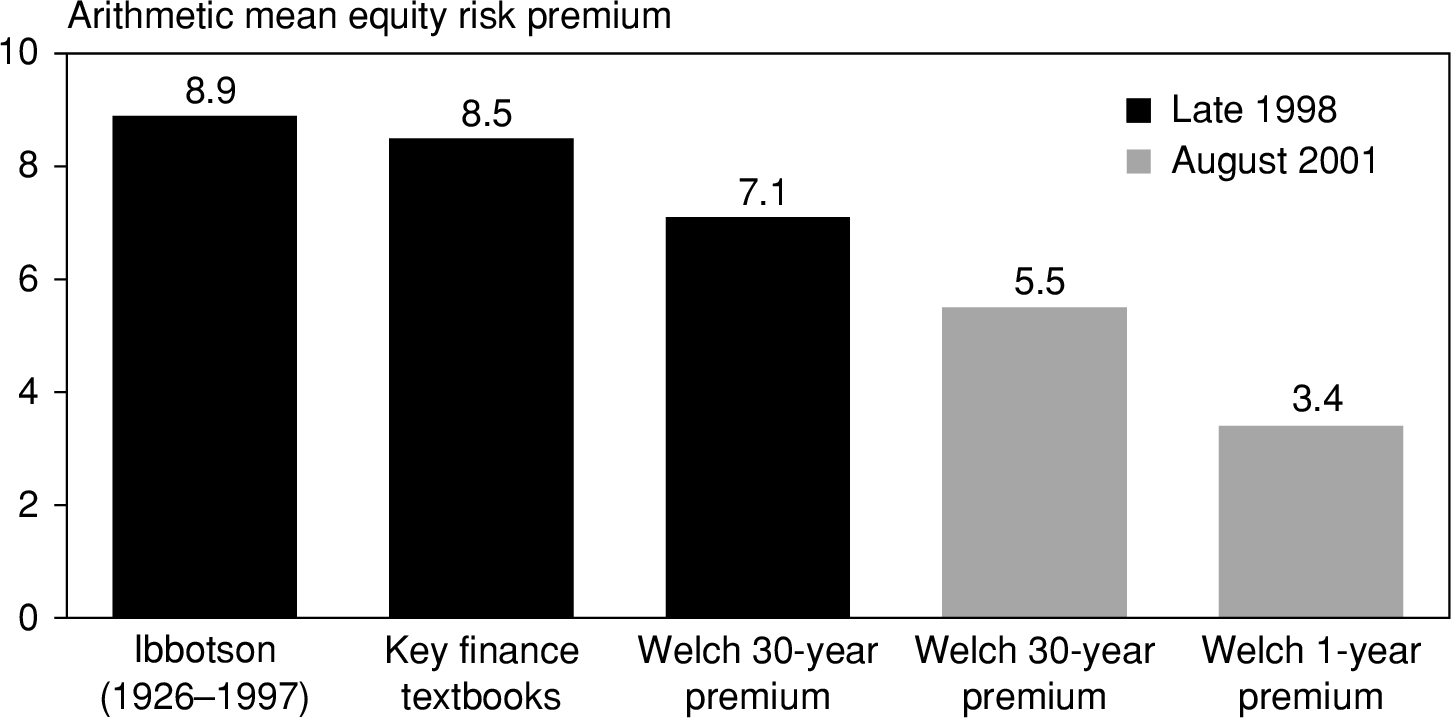
Triumph of the Optimists
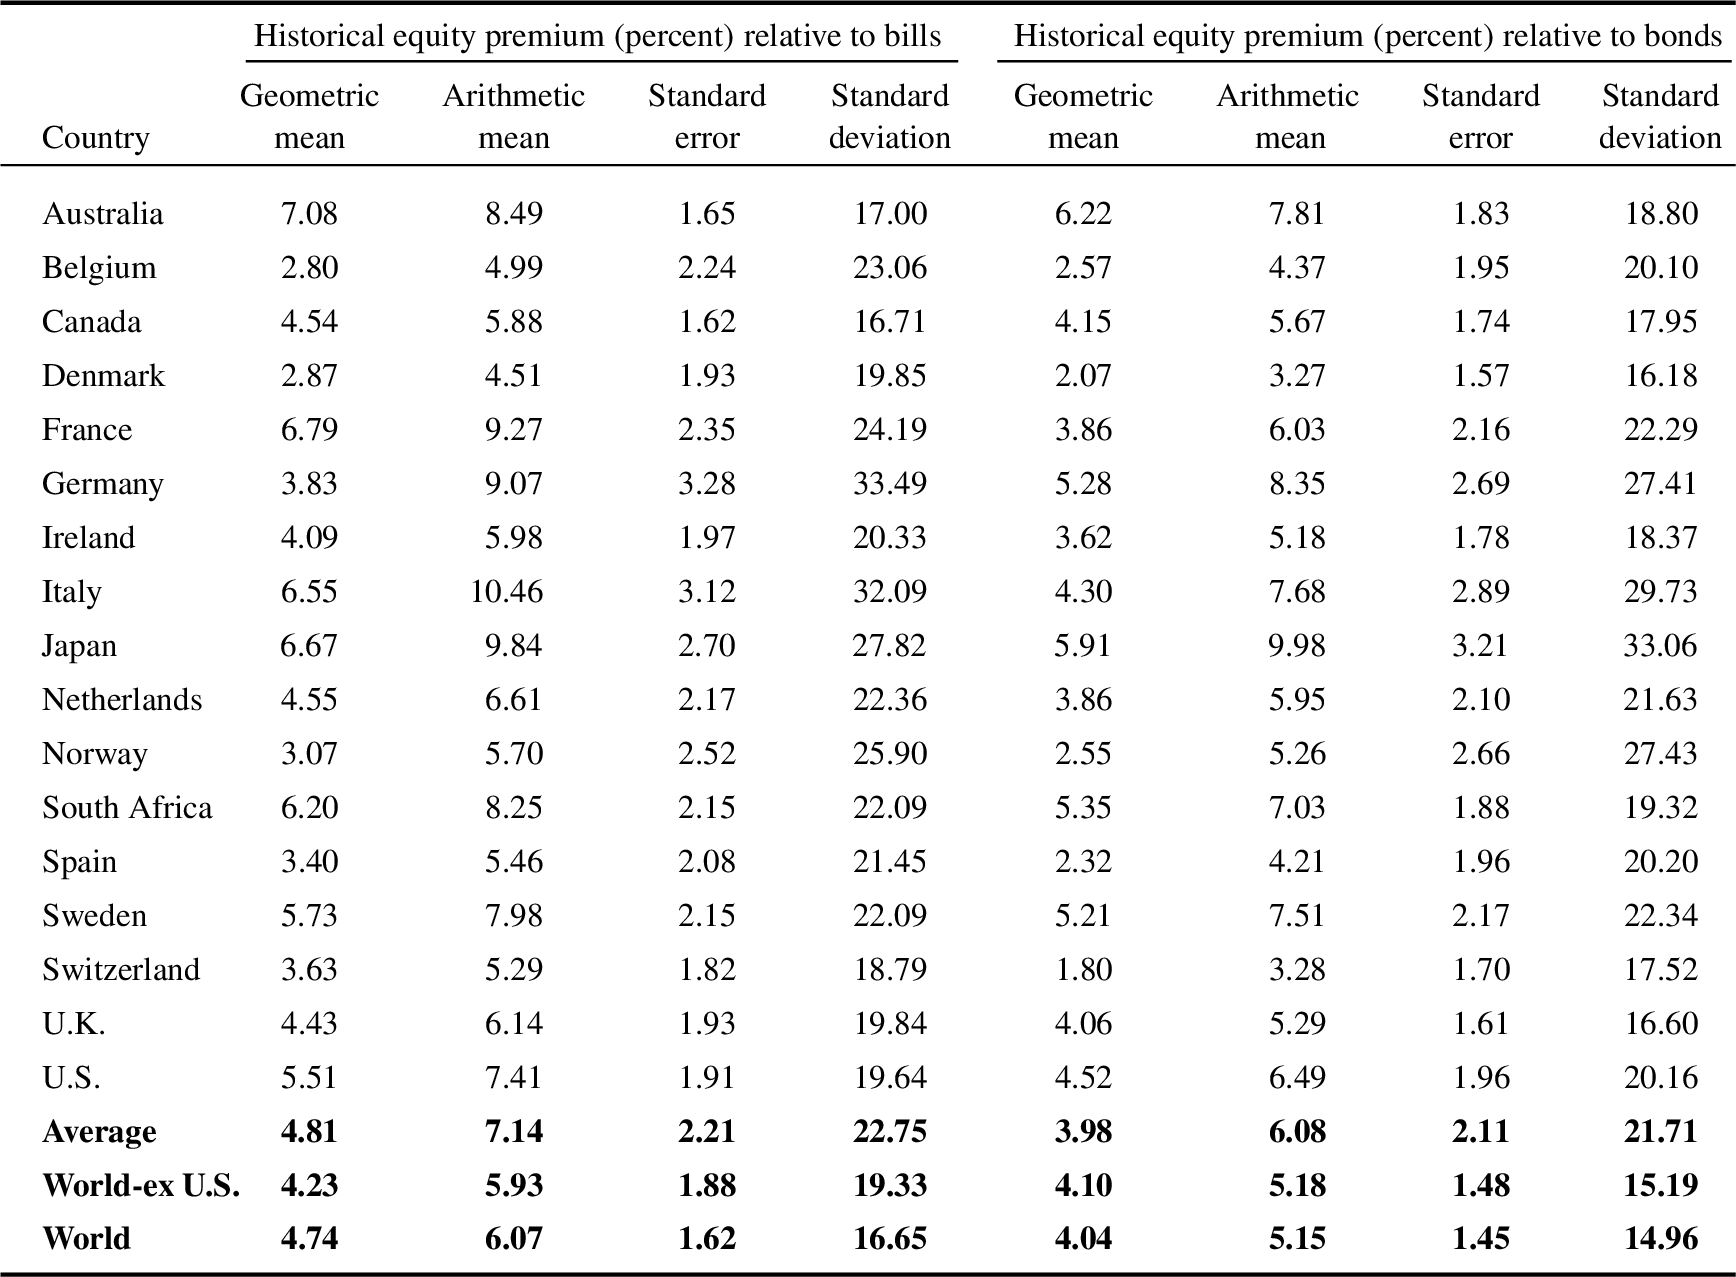
Triumph of the Optimists

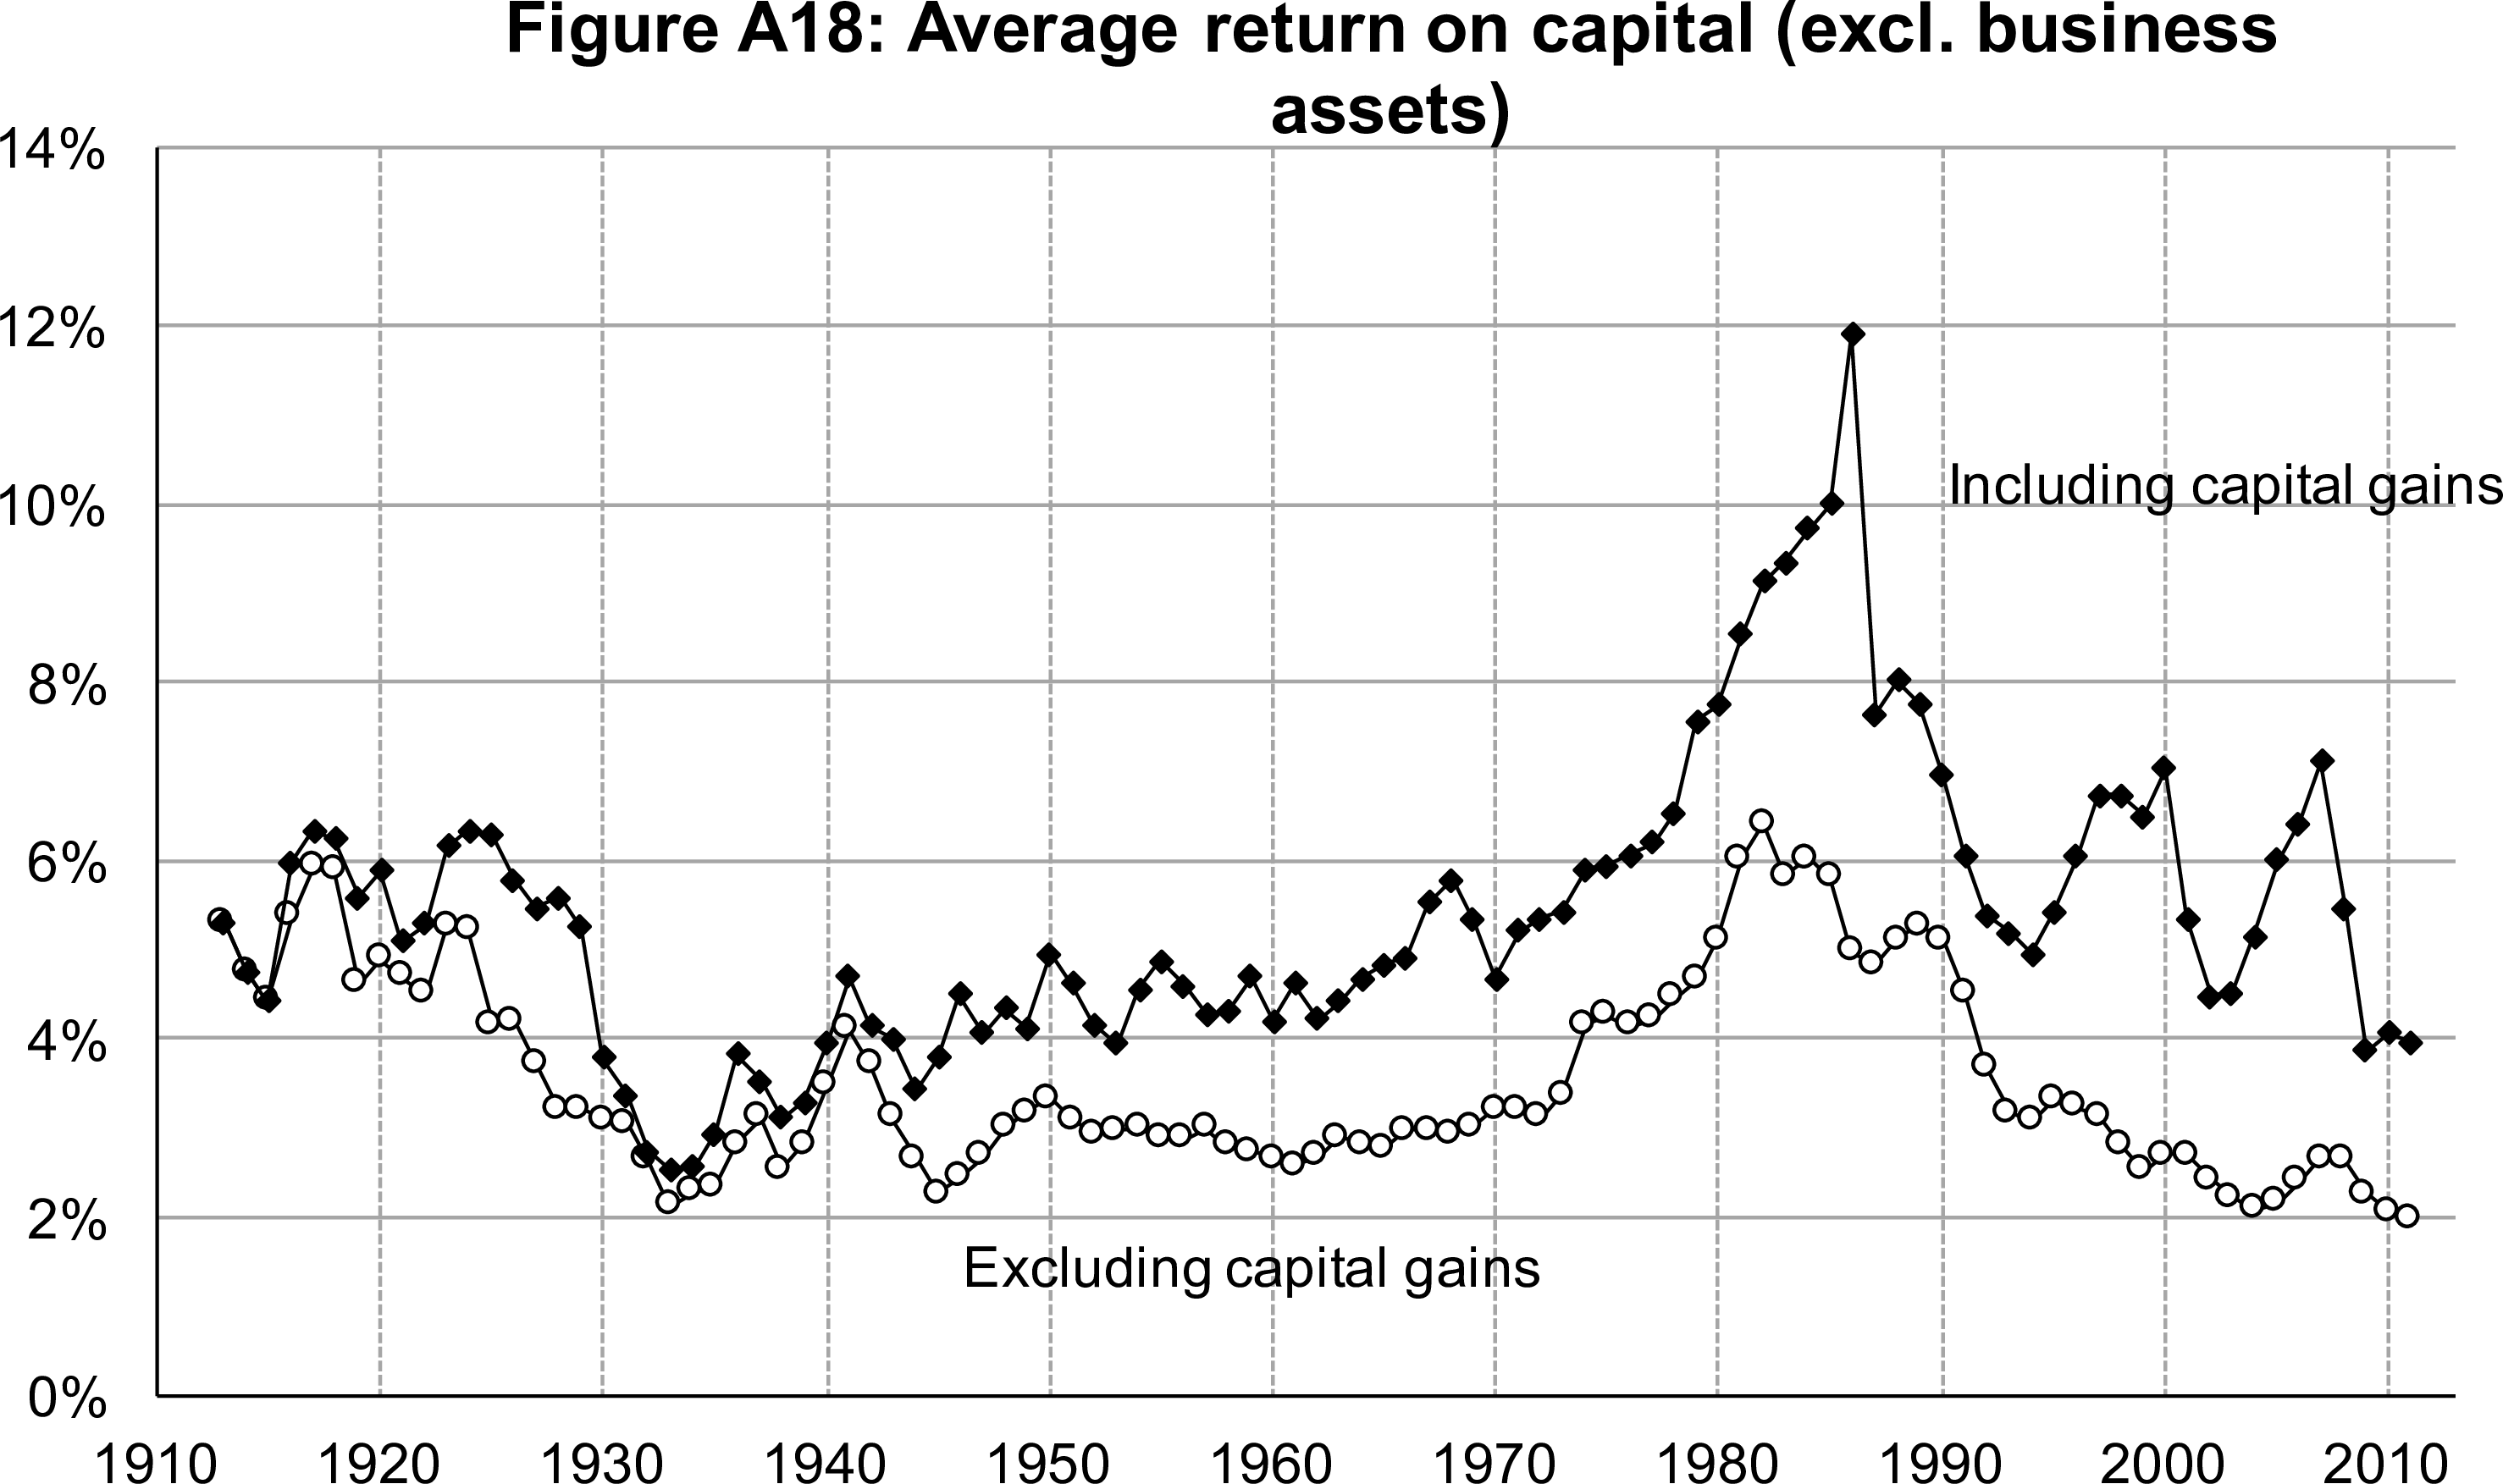
Saez and Zucman (2016) - Average return on capital
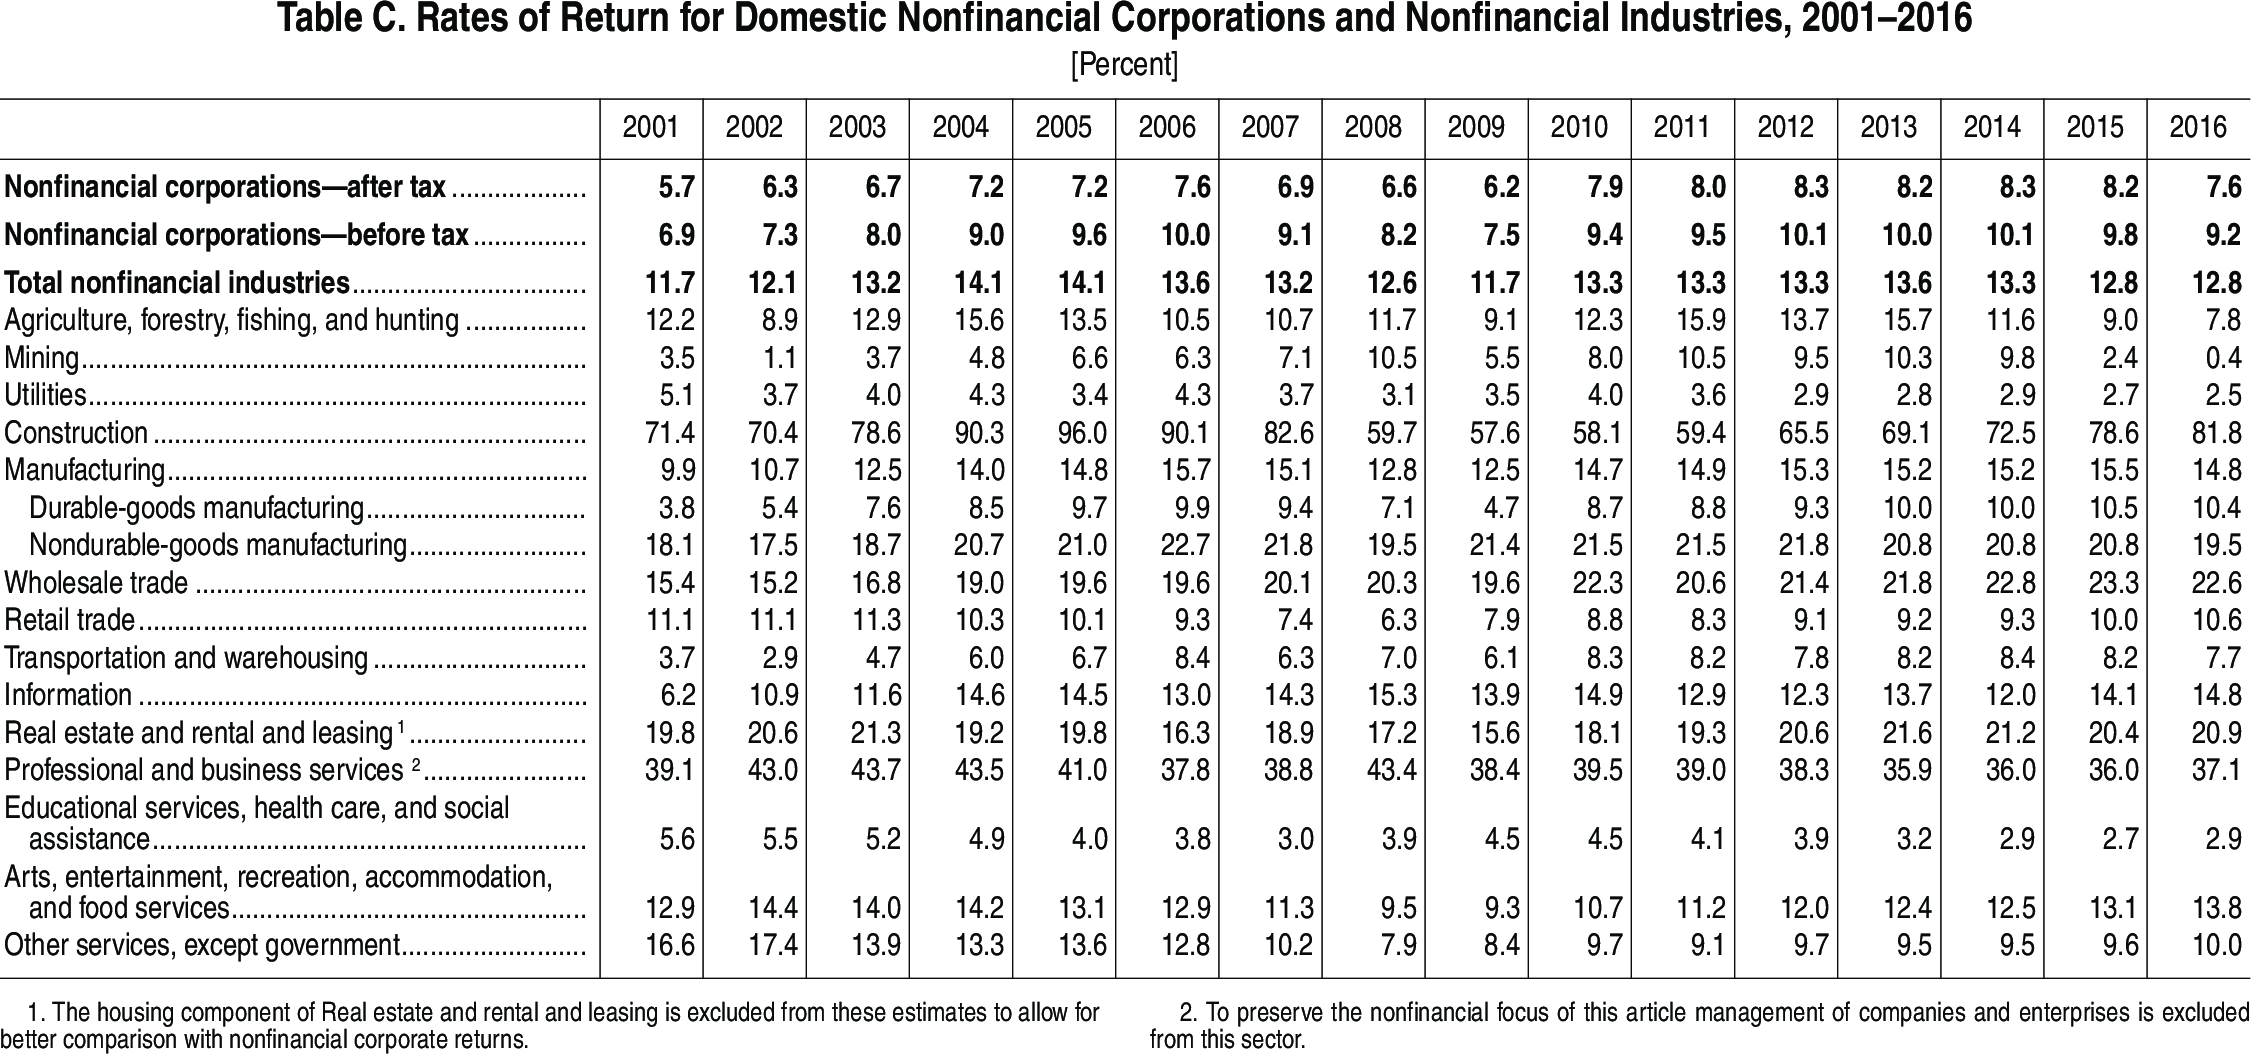
Returns to capital
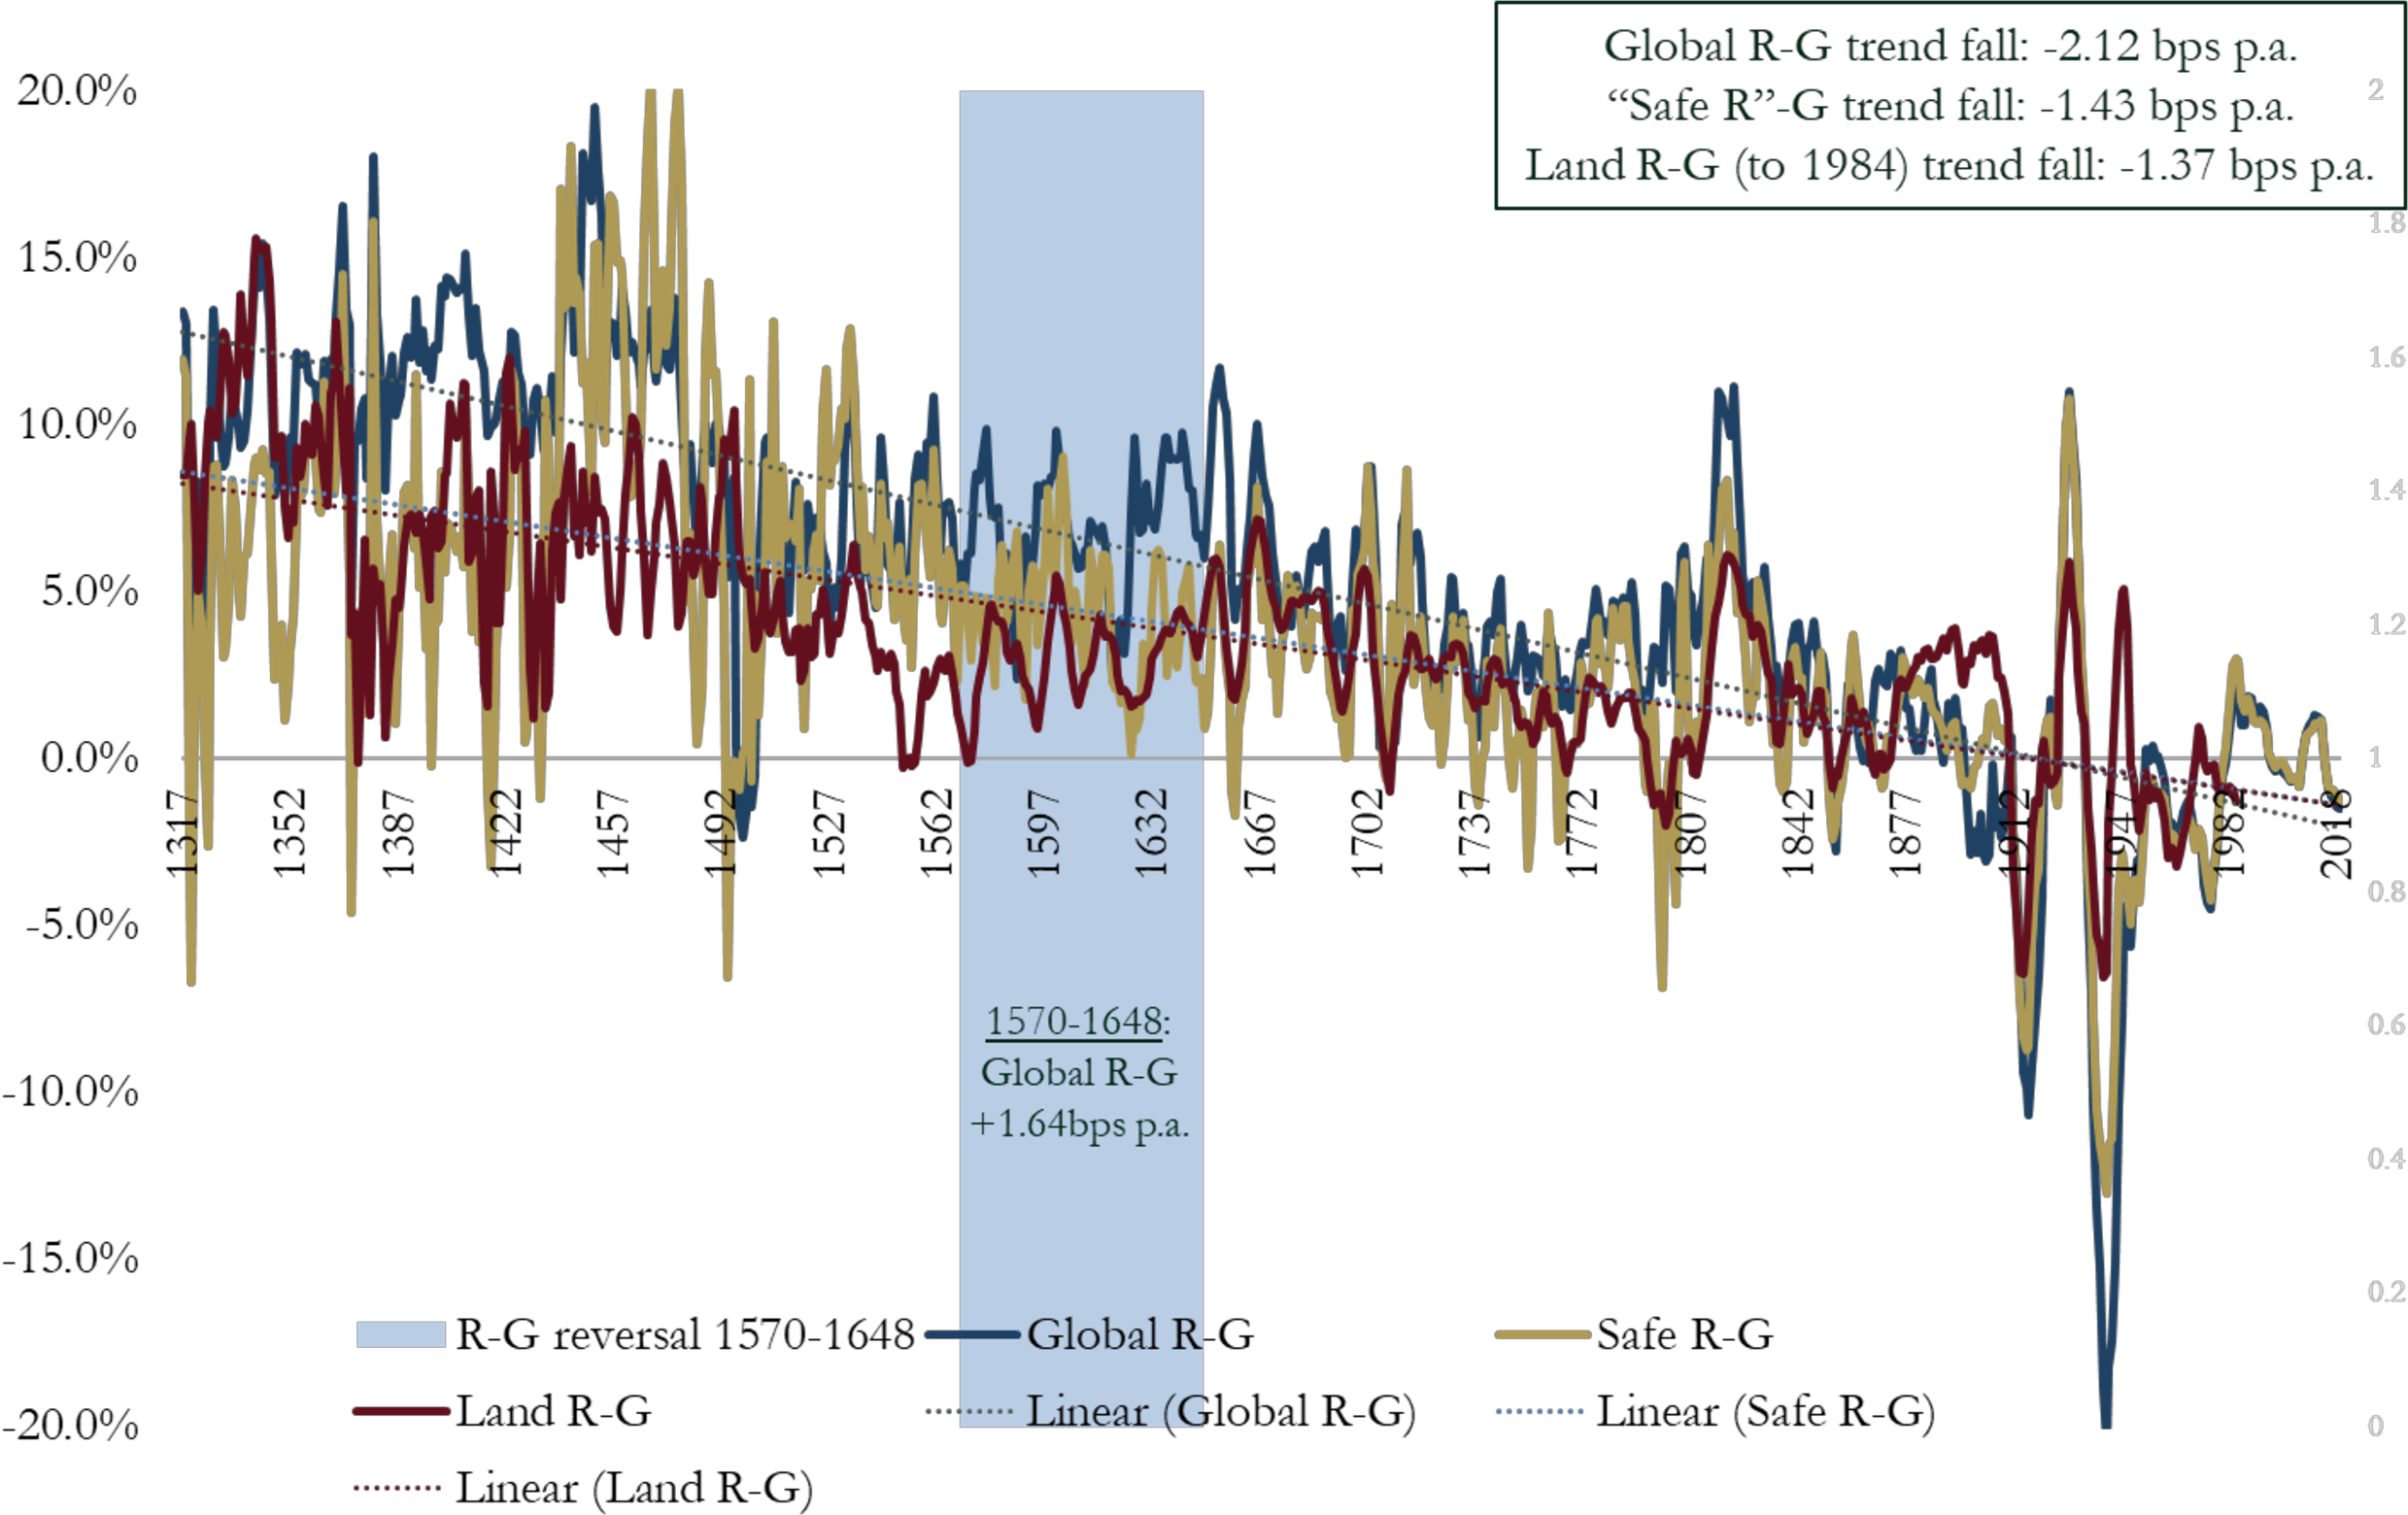
Schmelzing (2020)
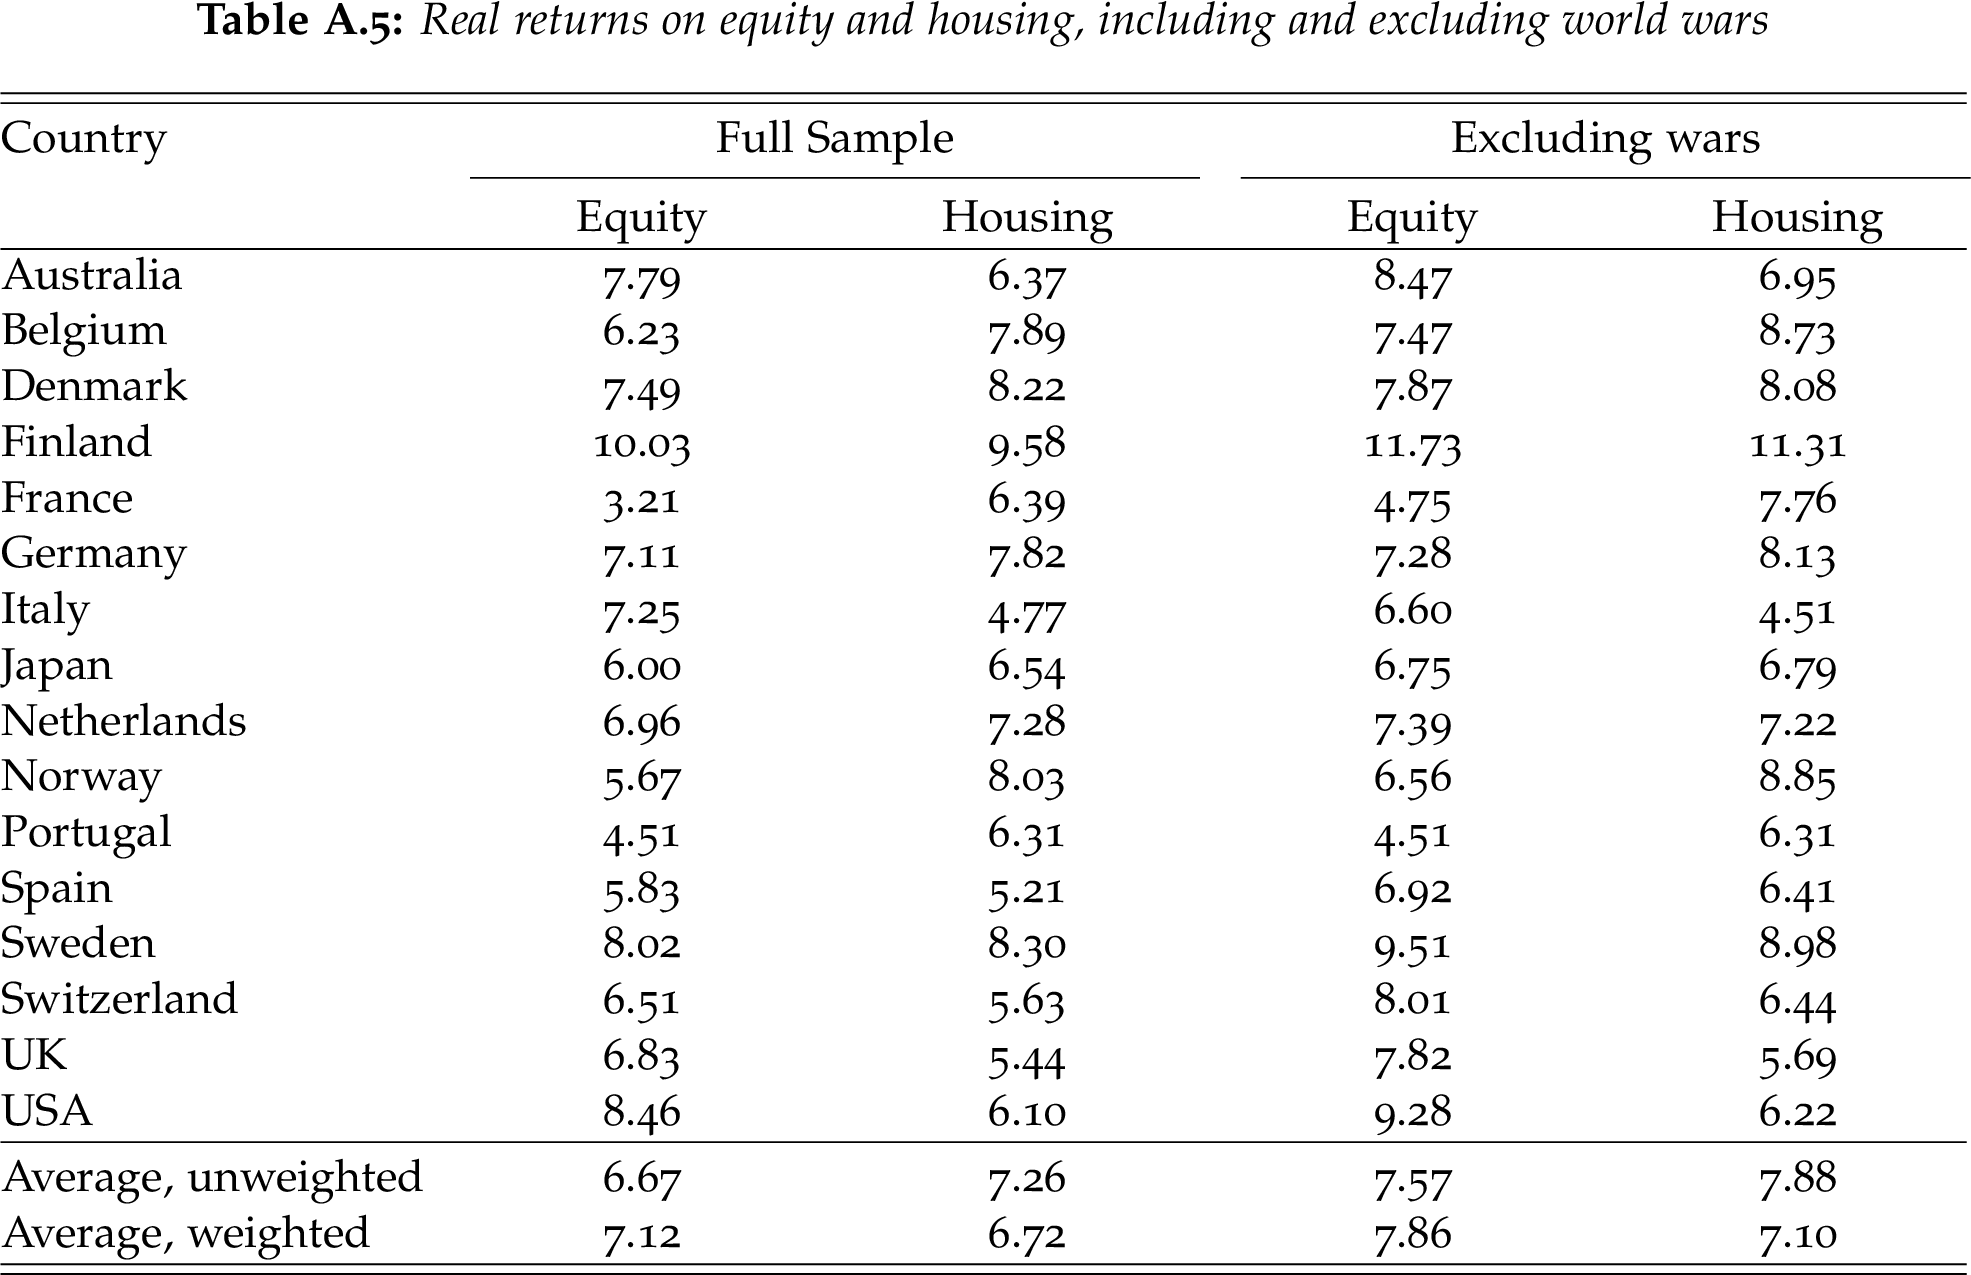
Jordà et al. (2019)
Presentation

Results
Most interesting result: housing has a much higher sharpe ratio than equities.
Return is roughly similar, but it’s much less risky.
To me it’s another “blow” to the CAPM, which as we now know does not work at all to explain the cross-section of assets.
We are back to one fundamental question: why do bonds have such low returns compared to housing / stocks?
Question: is the preformance we measure one that was to be expected or not?
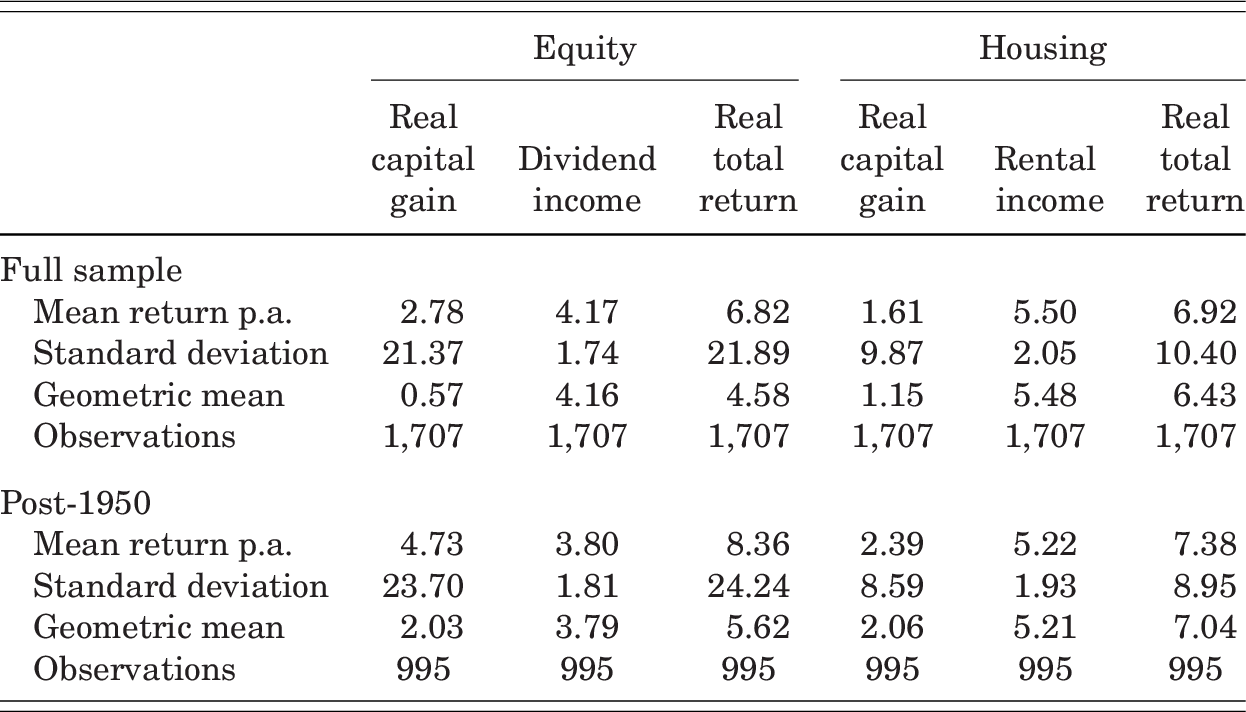
Housing and Equity

Main result
Equity VS Housing
Dividends VS Capital gains
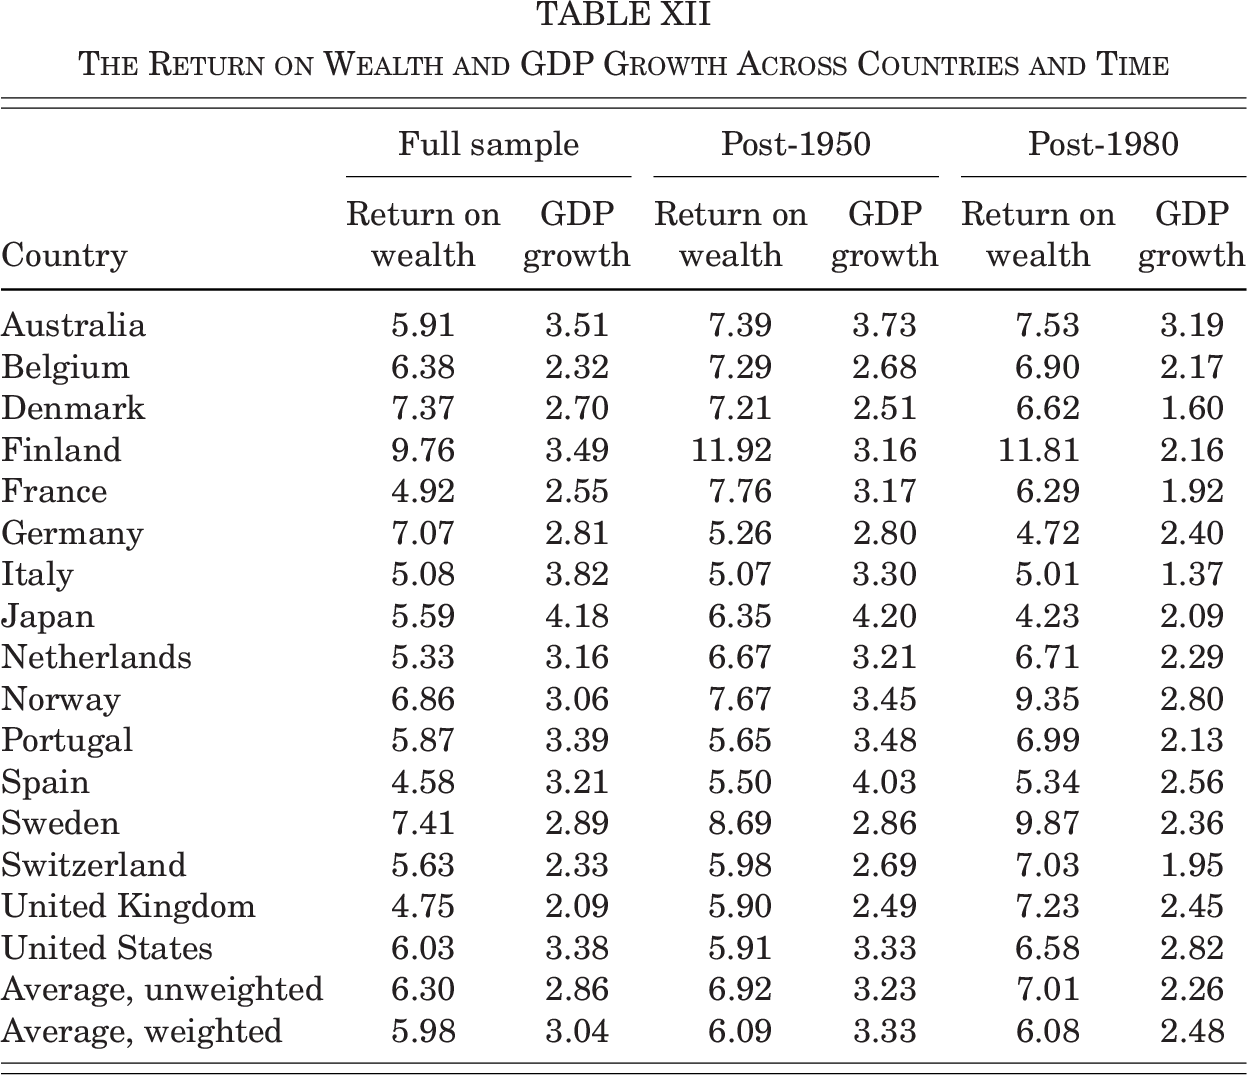
r-g
Stores of Value
List
If one wants to transfer resources into the future, how can one do this? Here’s the list:
Gold.
Oil.
Residential property.
Global Asset Classes
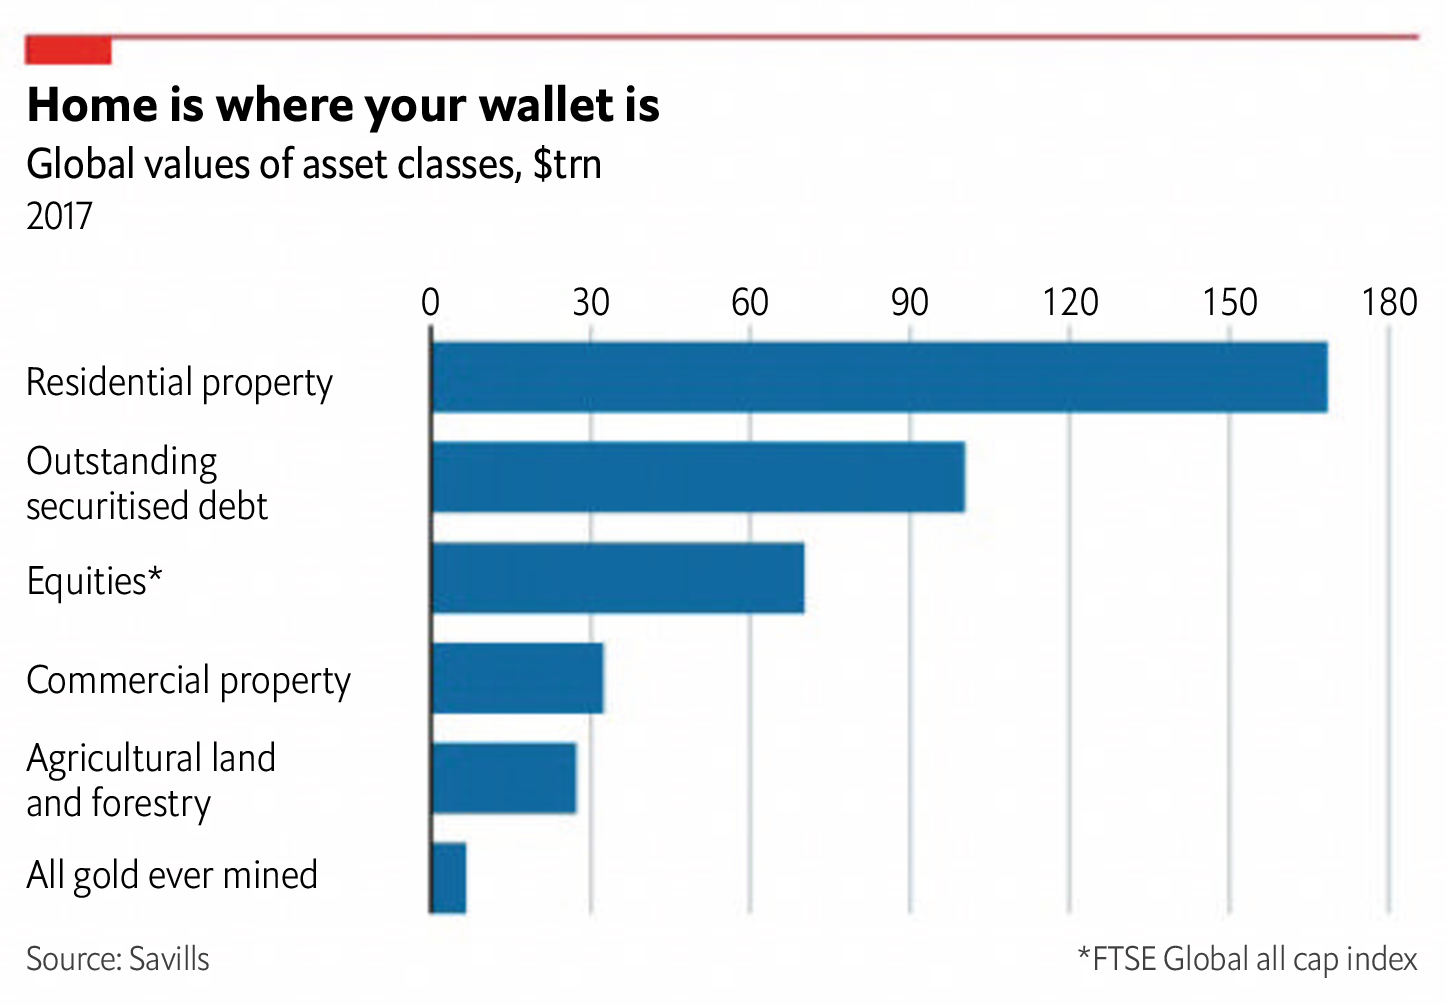
World Real Estate: $180 Tn

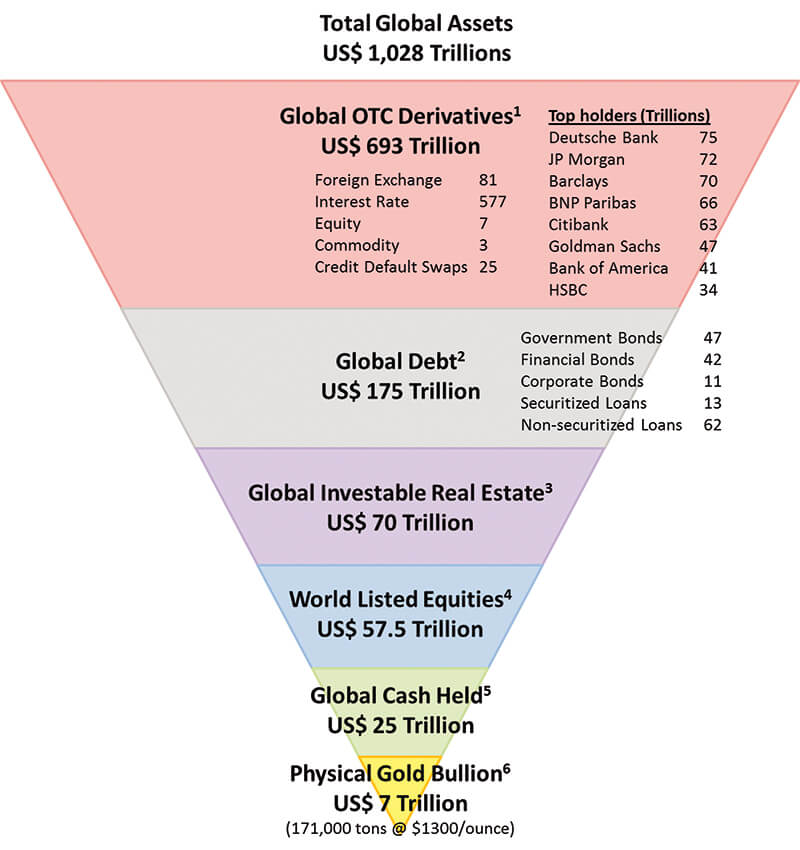
World Asset Classes
https://global-precious-metals.com/the-case-for-gold-in-one-chart/
Ultra High Net Worth Individuals (UHNWIs)

Crude Oil reserves in Billion Barrels
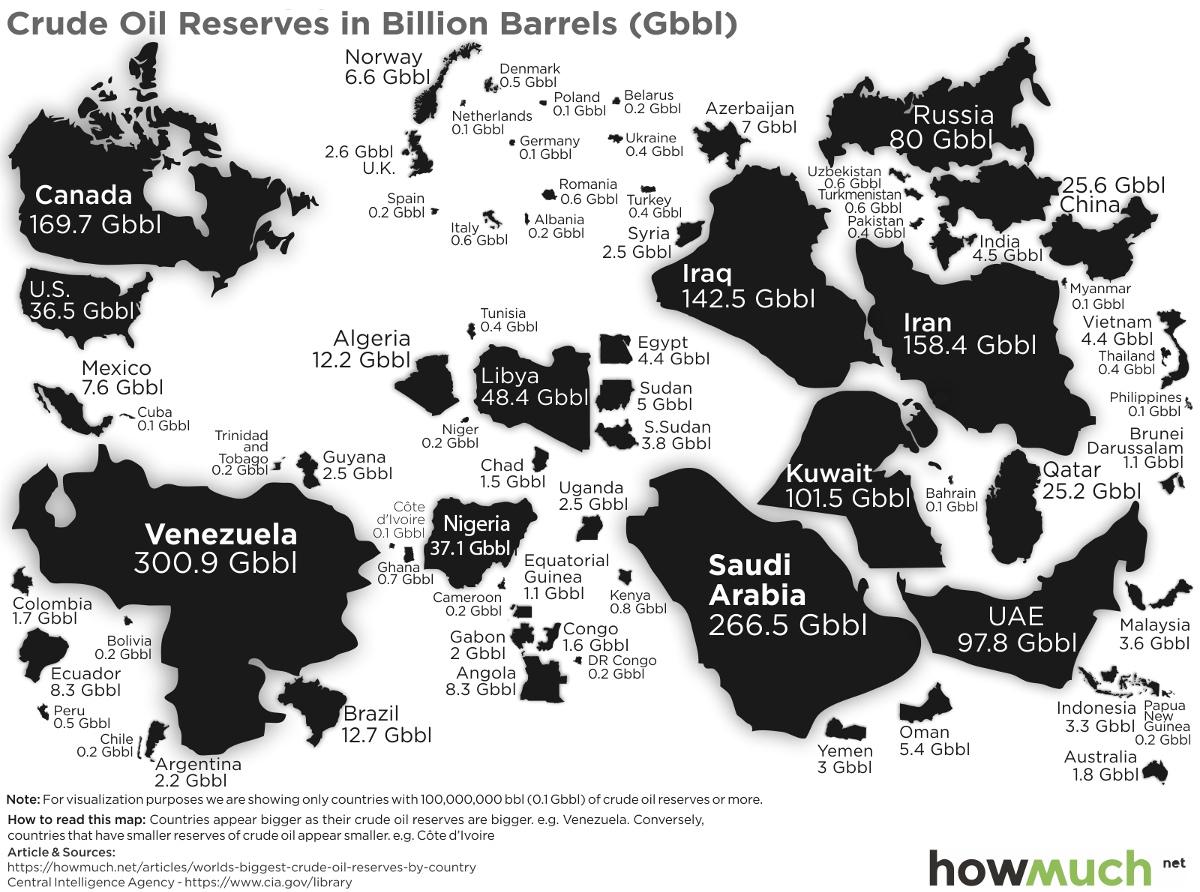
Crude Oil reserves in Billion Barrels
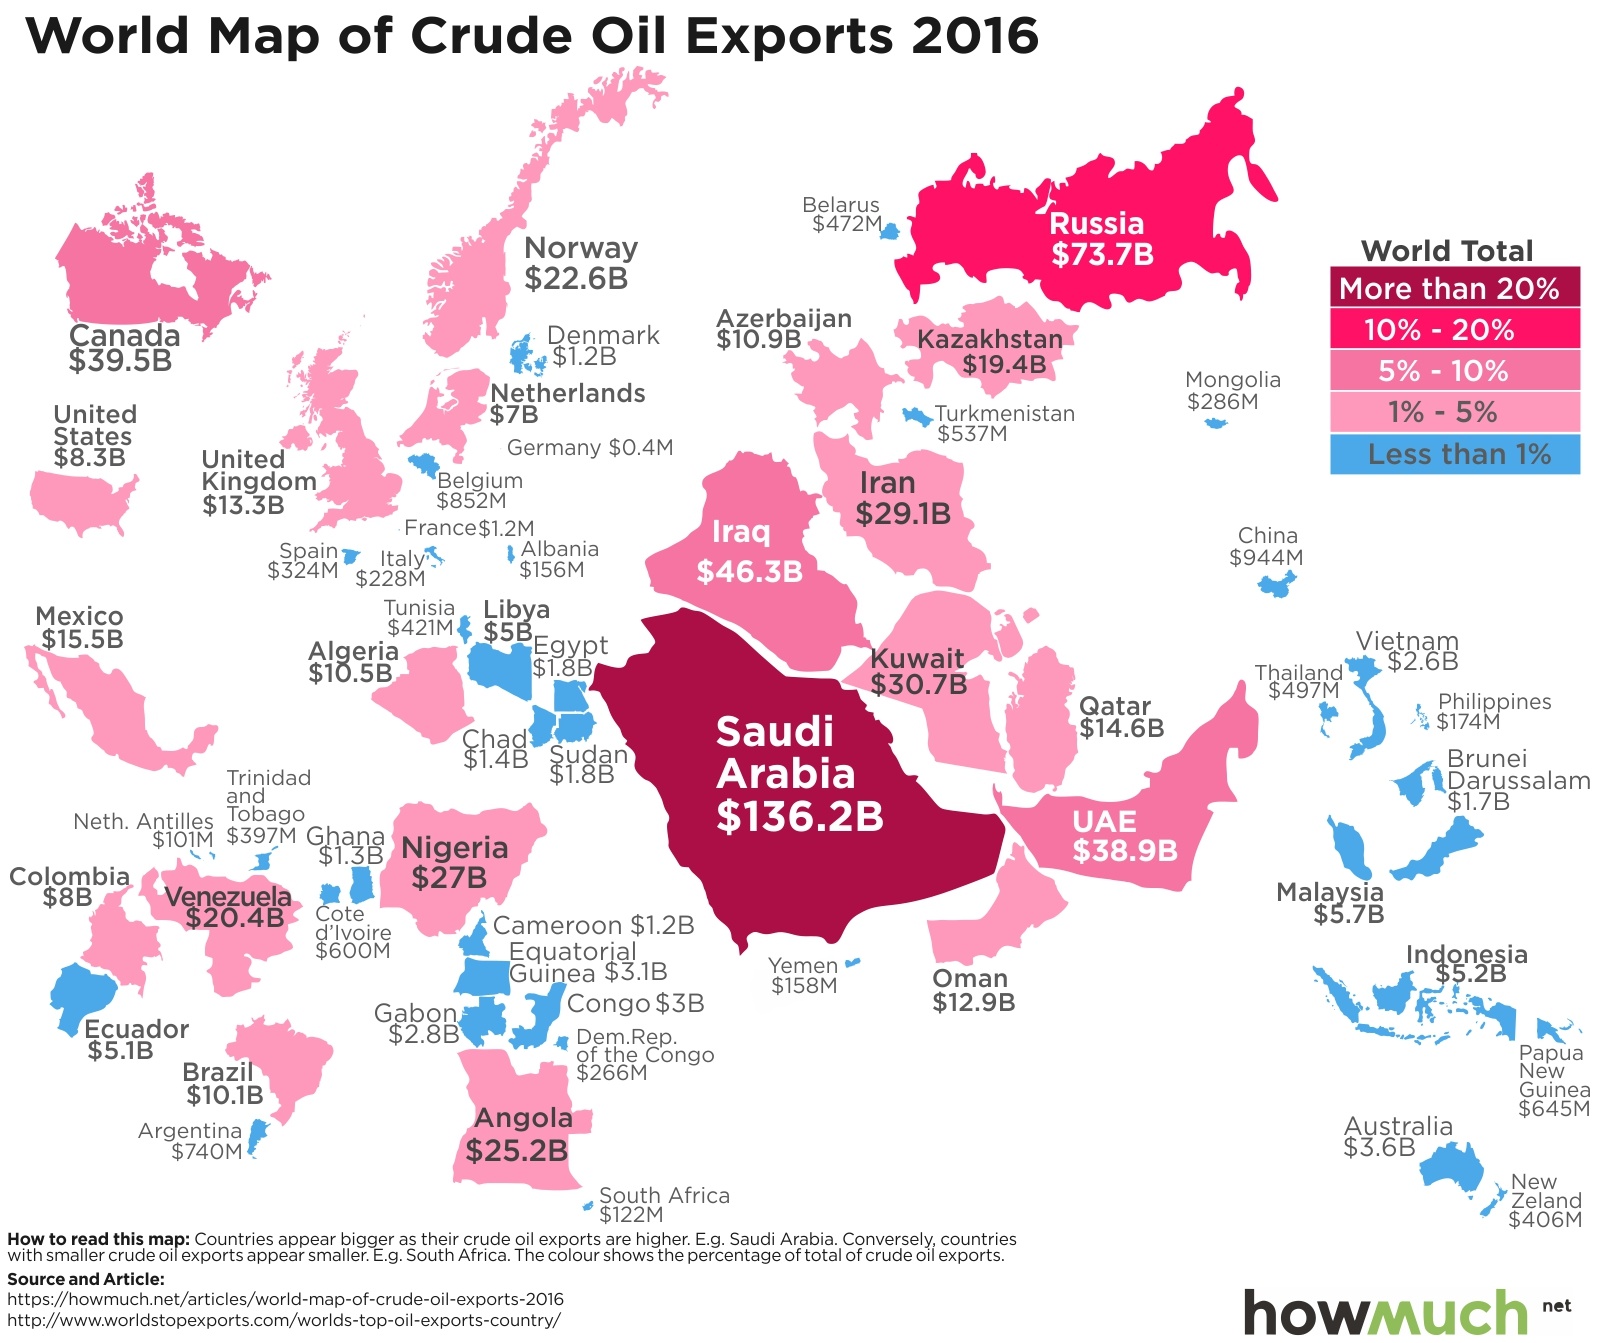
Crude Oil Reseres: Orders of magnitude
1.73 trillion barrels in soil.
World uses 95 million barrels per day = 34 billion barrels per year.
Enough to last another 50 years.
Say value is $65/Barrel: \[\boxed{\text{Proven Oil Reserves} = 112 \text{ Tn Dollars}}\].
Barro, Misra: Return on Gold

Bibliography
Dimson, Elroy, Paul Marsh, and Mike Staunton. 2009. Triumph of the Optimists: 101 Years of Global Investment Returns. Princeton University Press.
Jordà, Òscar, Katharina Knoll, Dmitry Kuvshinov, Moritz Schularick, and Alan M. Taylor. 2019. “The Rate of Return on Everything, 1870 2015.” The Quarterly Journal of Economics 134 (3): 1225–98. https://doi.org/10.1093/qje/qjz012.
Jorion, Philippe, and William N. Goetzmann. 1999. “Global Stock Markets in the Twentieth Century.” The Journal of Finance 54 (3): 953–80. https://doi.org/10.1111/0022-1082.00133.
Saez, Emmanuel, and Gabriel Zucman. 2016. “Wealth Inequality in the United States Since 1913: Evidence from Capitalized Income Tax Data.” The Quarterly Journal of Economics 131 (2): 519–78. https://doi.org/10.1093/qje/qjw004.