October 12, 2020
Introduction
Question
What are the sources of GDP growth, and of GDP differences across countries?
Supply-side approach to GDP presented in lecture 1, with GDP given as \(Y_t = A_t K_t^{\alpha} L_t^{1-\alpha},\) implies that growth in GDP may arise from technology, capital, or population.
Population is not that interesting from an economist’s point of view, since the object of interest for an economist usually is GDP per capita. However, population is very important for discussions of relative economic or military power, which ultimately also impact the economy.
In this lecture, we study the Solow (1956) / Swan model of economic growth, which deals with the problem of capital accumulation.
Solow (1956)
Solow (1956) emphasized the importance of capital accumulation.
He built what is now referred to as the neoclassical growth model.
Production requires that some people forgo consumption for later, which allows to build machines, and railroads, and increases the capital stock.
One long-standing question in the economics literature however is whether there can be too much savings. (that is, is any amount of savings going to be demanded by the private sector?)
Crucial question
After the war, important discussions were held around the substitutability between capital and labor:
According to Keynesian economists, the growth process was basically unstable, because there wasn’t much substitutability between capital and labor. As a consequence, capital would quickly fall into diminishing returns, and “too much saving” would result in stagnant growth.
According to neoclassical economists (including Solow), the growth process was stable, as there would always be enough demand to capital to absorb excess savings.
While we look at the data on the capital stock, and investment, keep thinking about whether you can increase production by just adding capital; and keep thinking about the substitutability between capital and labor.
U.S. Saving and Investment
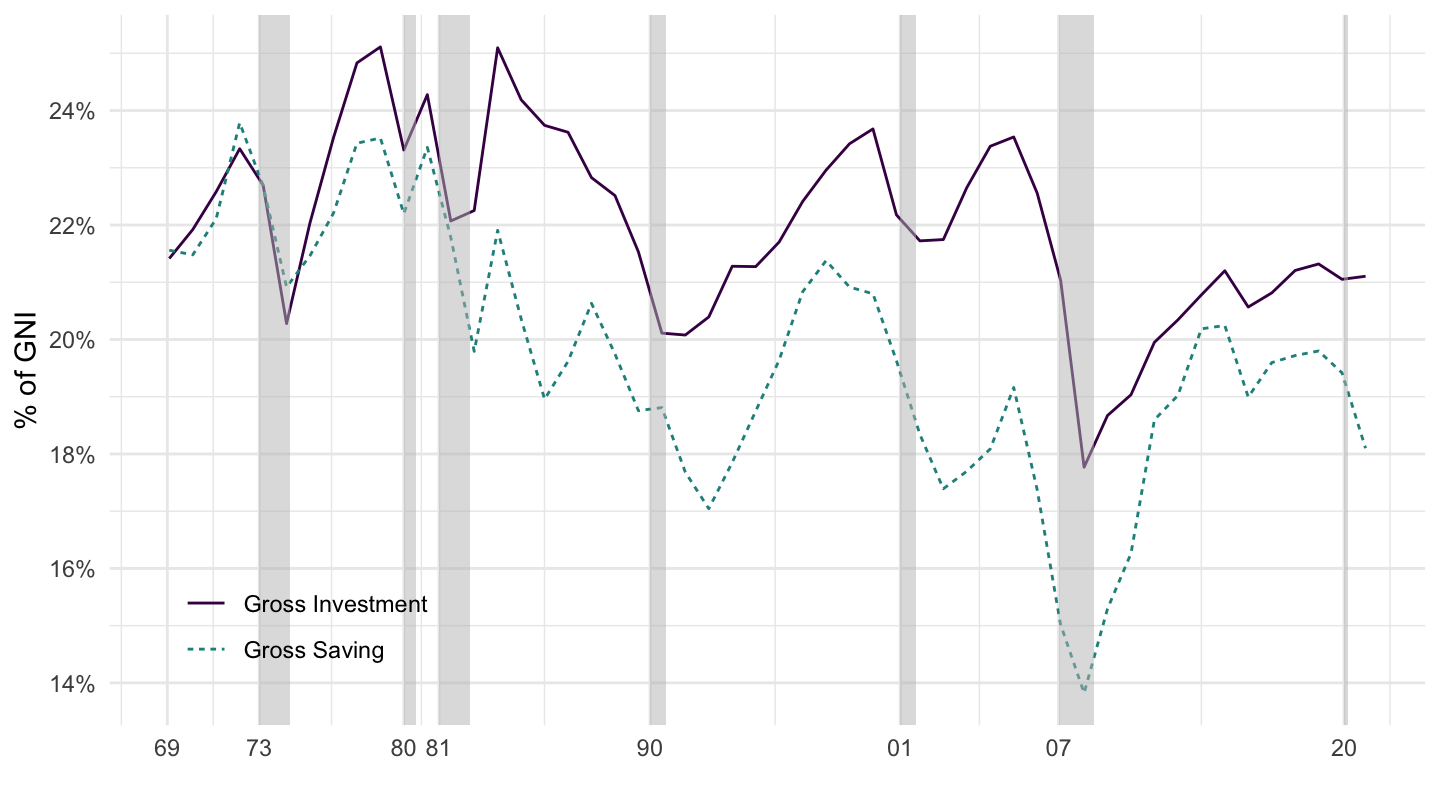
Gross Savings and Investment in the U.S. (World Bank)
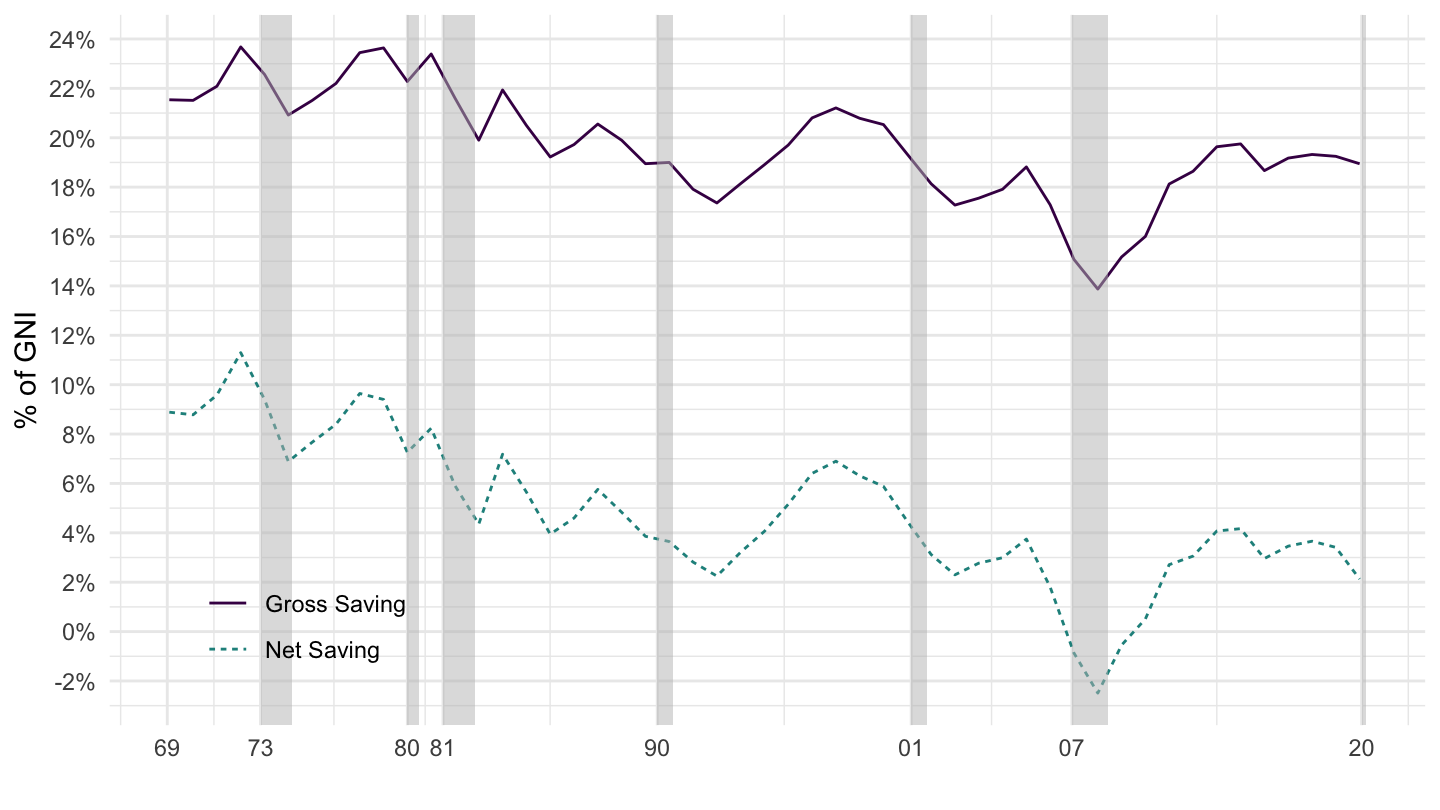
Net Savings and Gross savings (World Bank)
Longer Perspective: NIPA

Saving and Investment (NIPA)

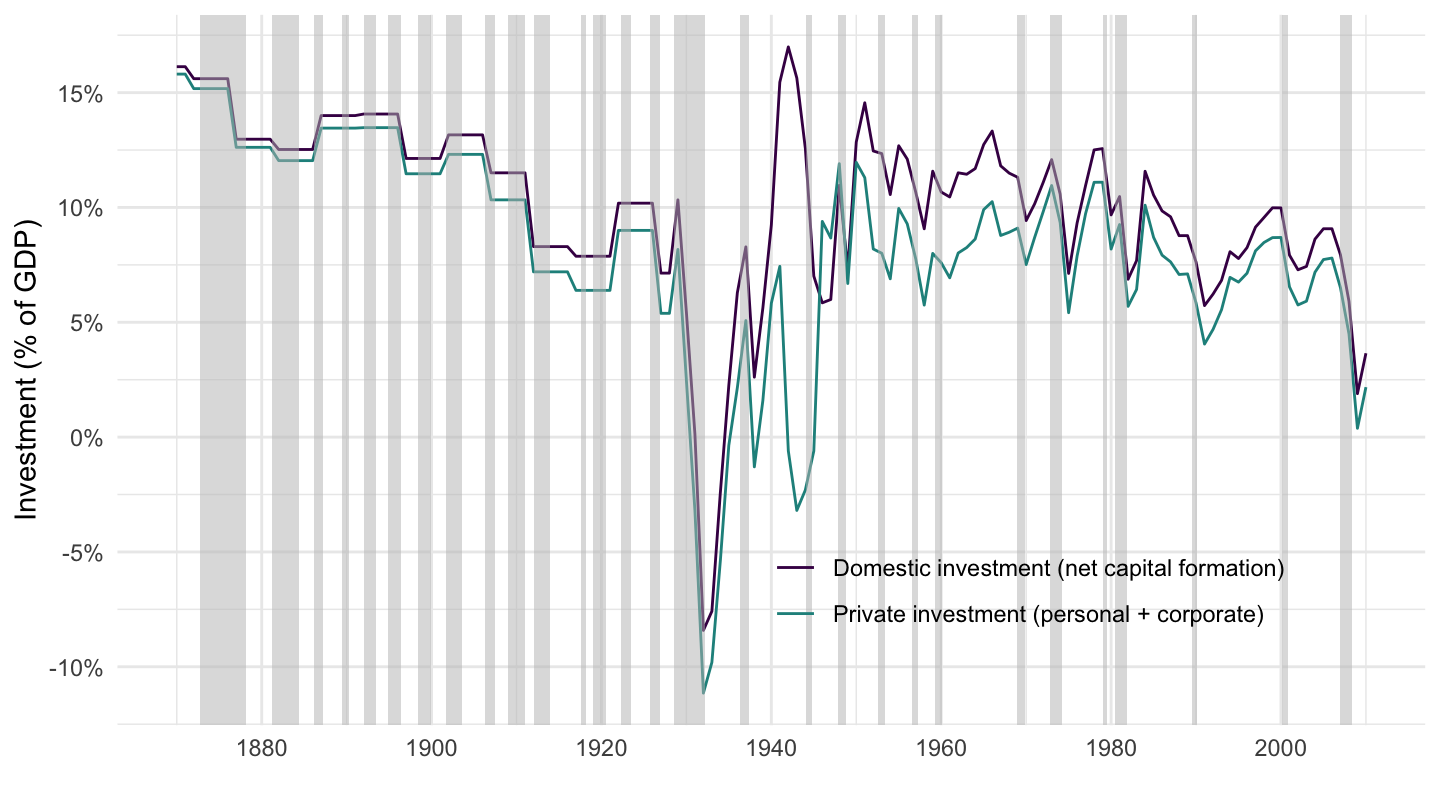
U.S. Private and Total Net Investment
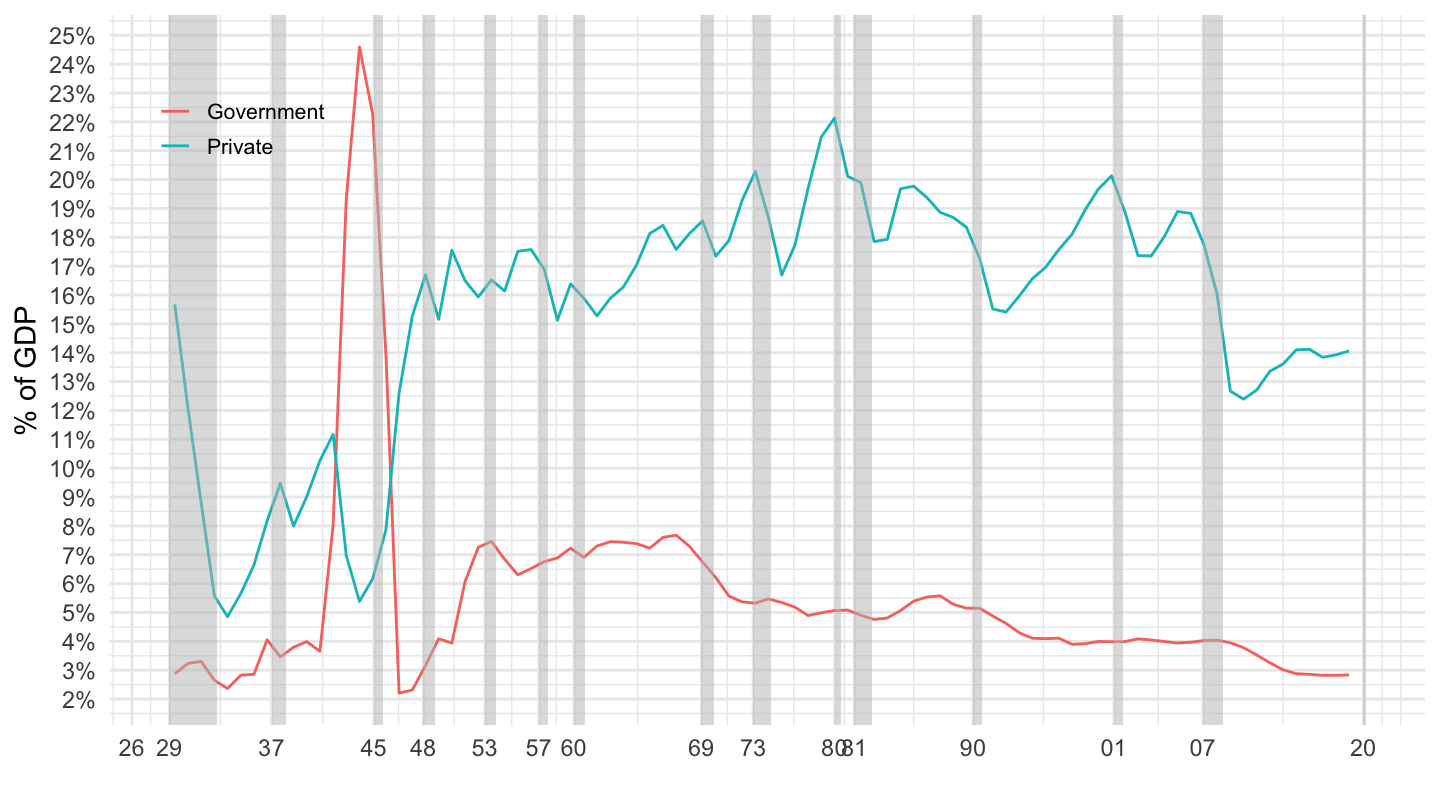
U.S. Investment, Government VS Private
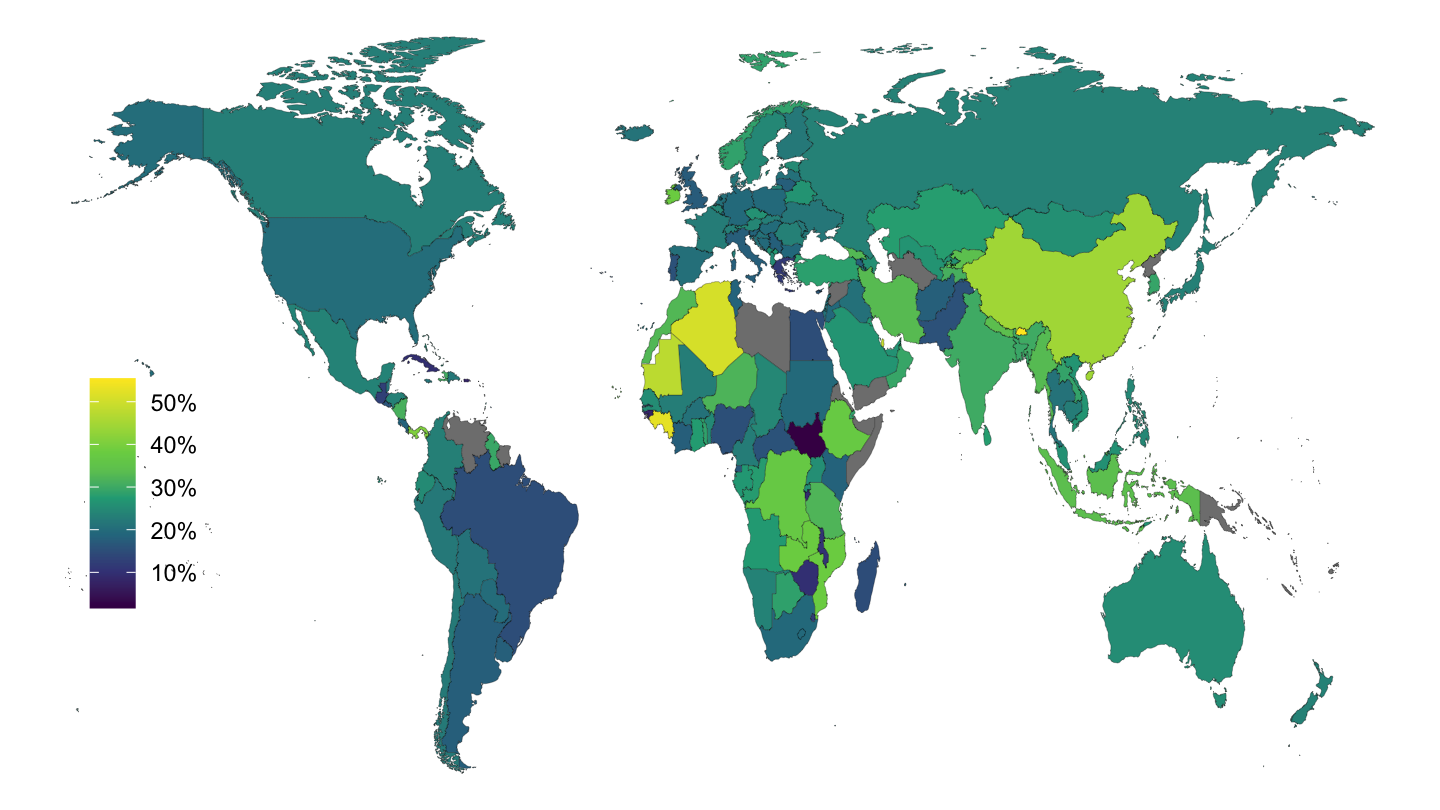
World Saving and Investment
Investment (% of GDP), 2016
Gross Saving (% of GDP), 2016
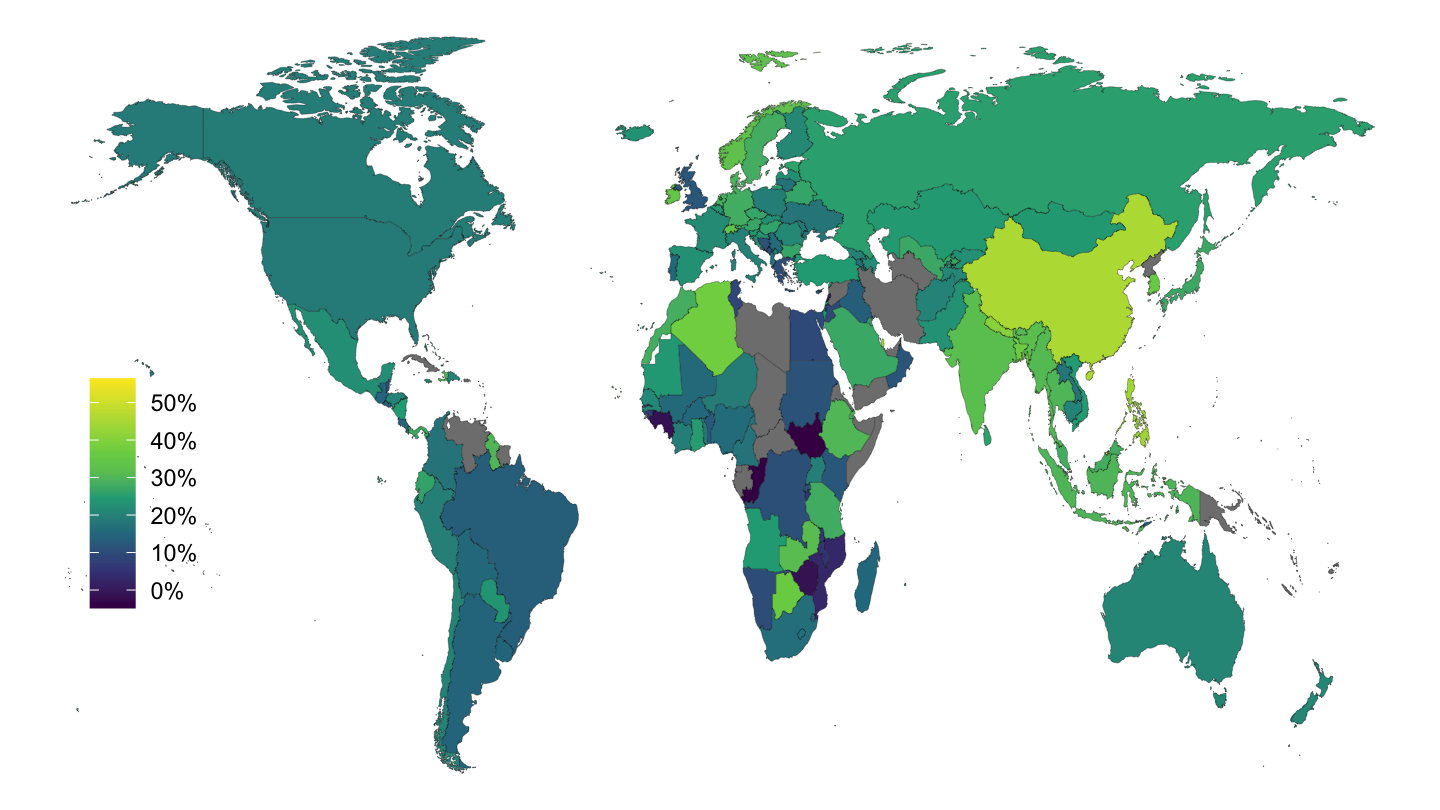
OECD Data, 2018

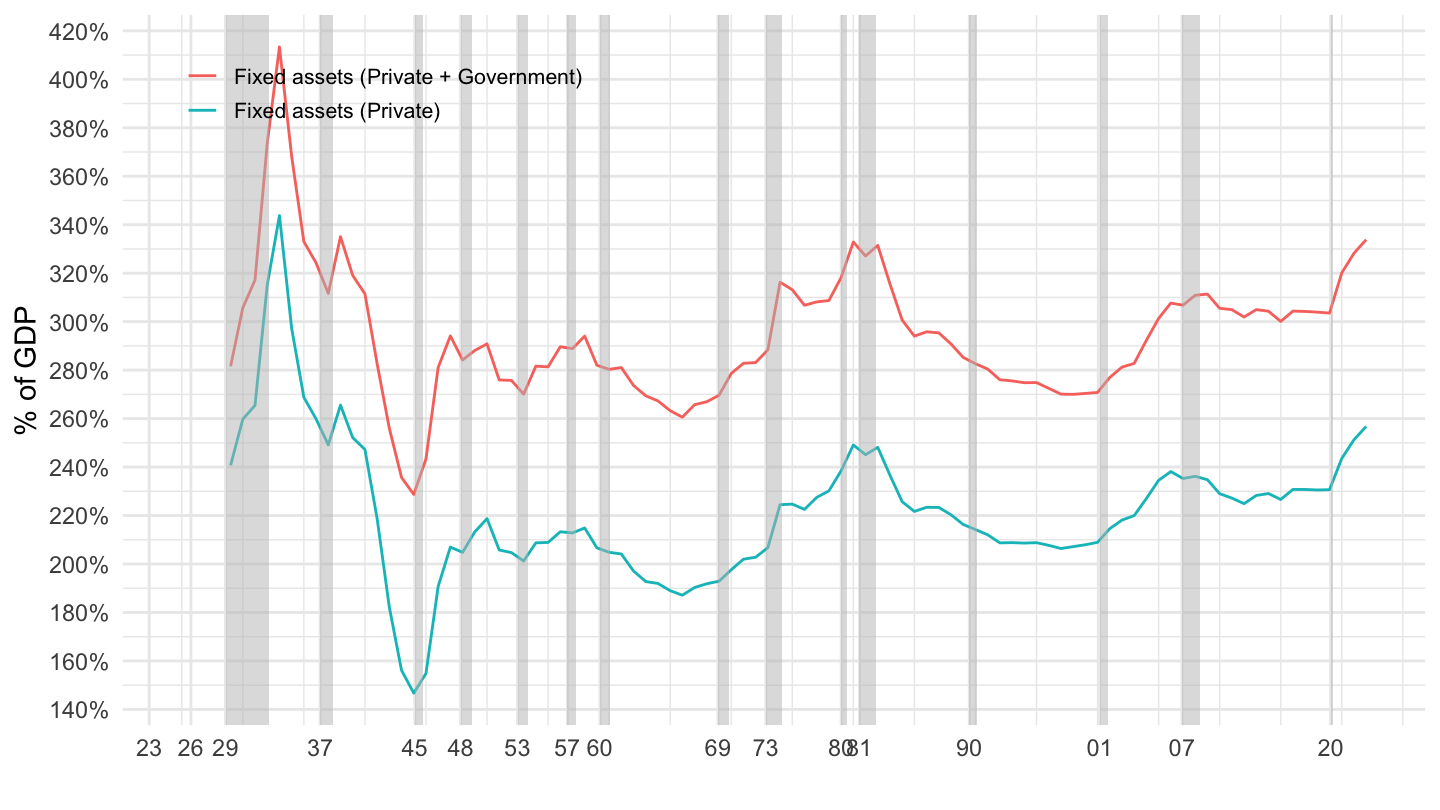
Data on the capital stock
Private and Government Fixed Assets (Book)
Types of Capital (Broad Categories)

U.S. Main Fixed Asset Components
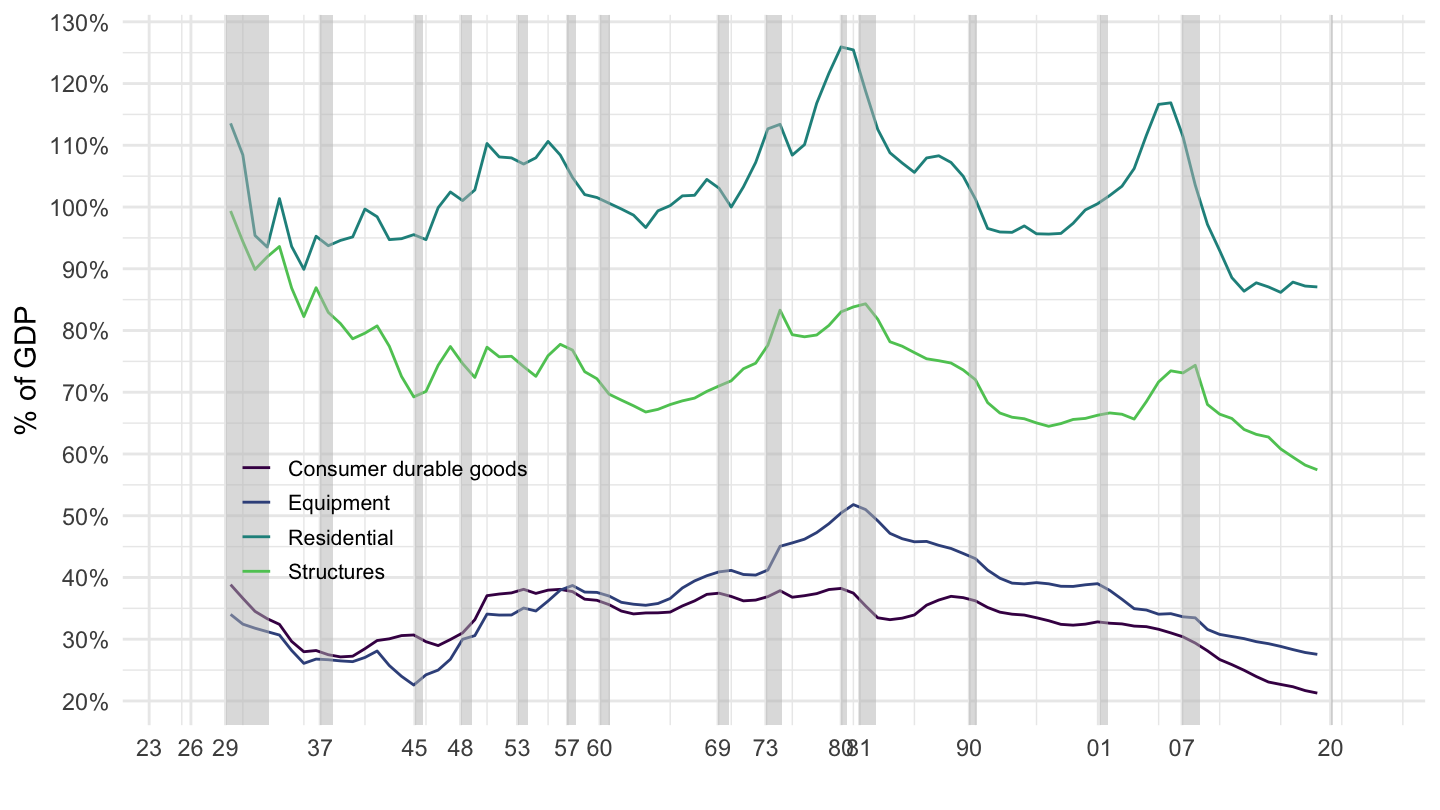
U.S. Main Fixed Asset Components

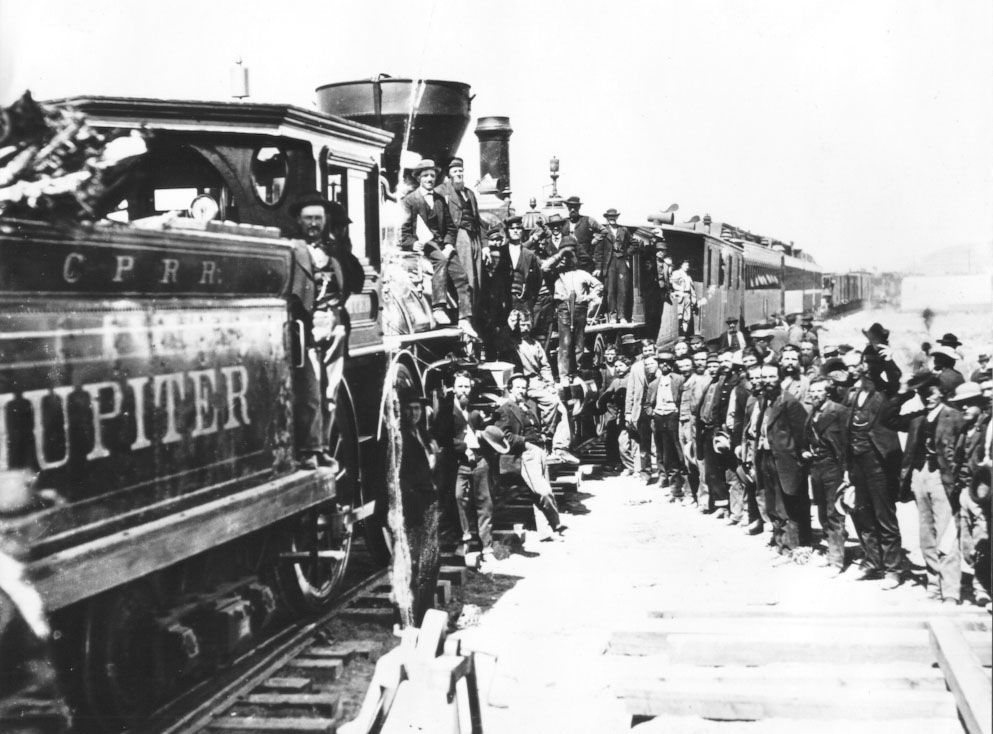
Capital: mostly railroads in XIXth century
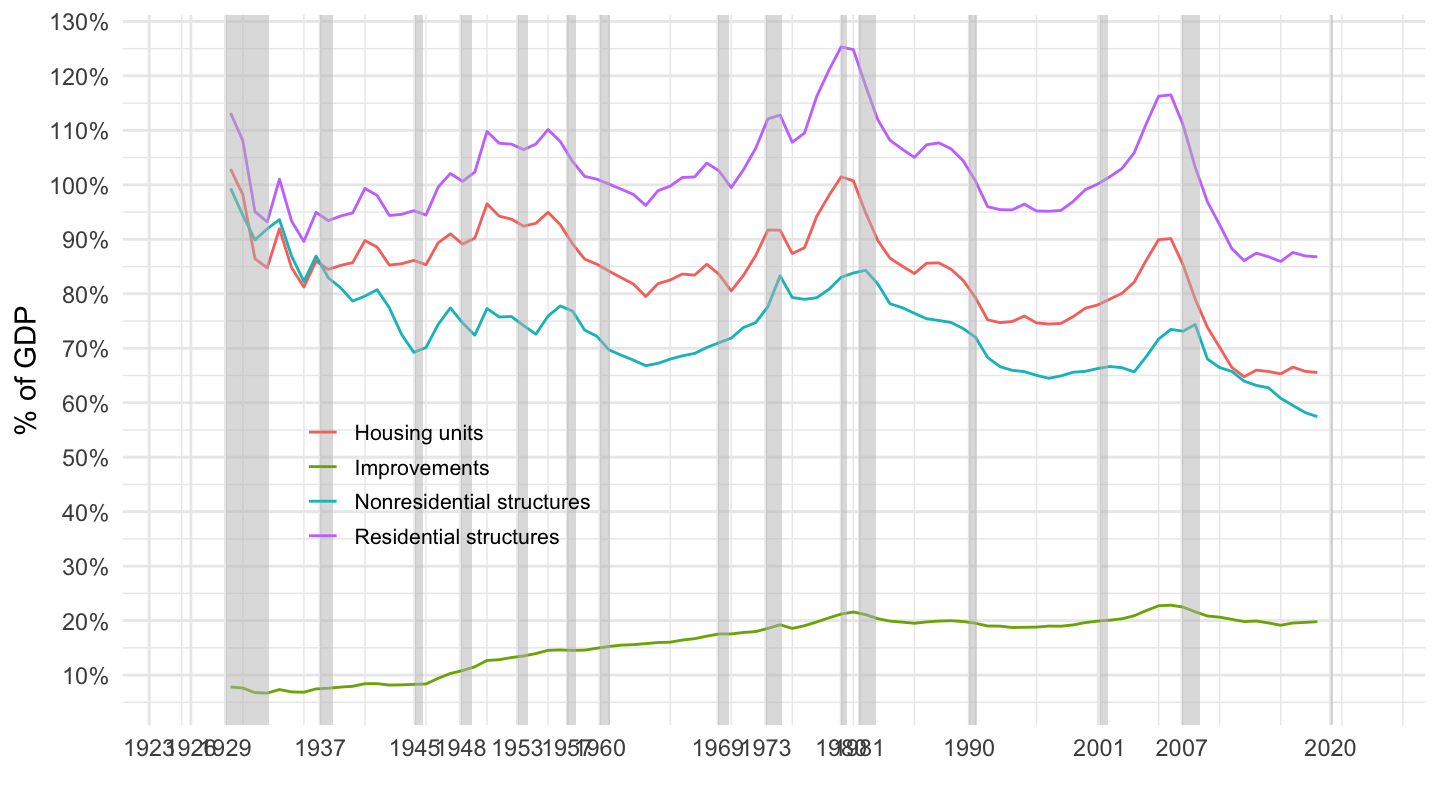
Structures (% of GDP)
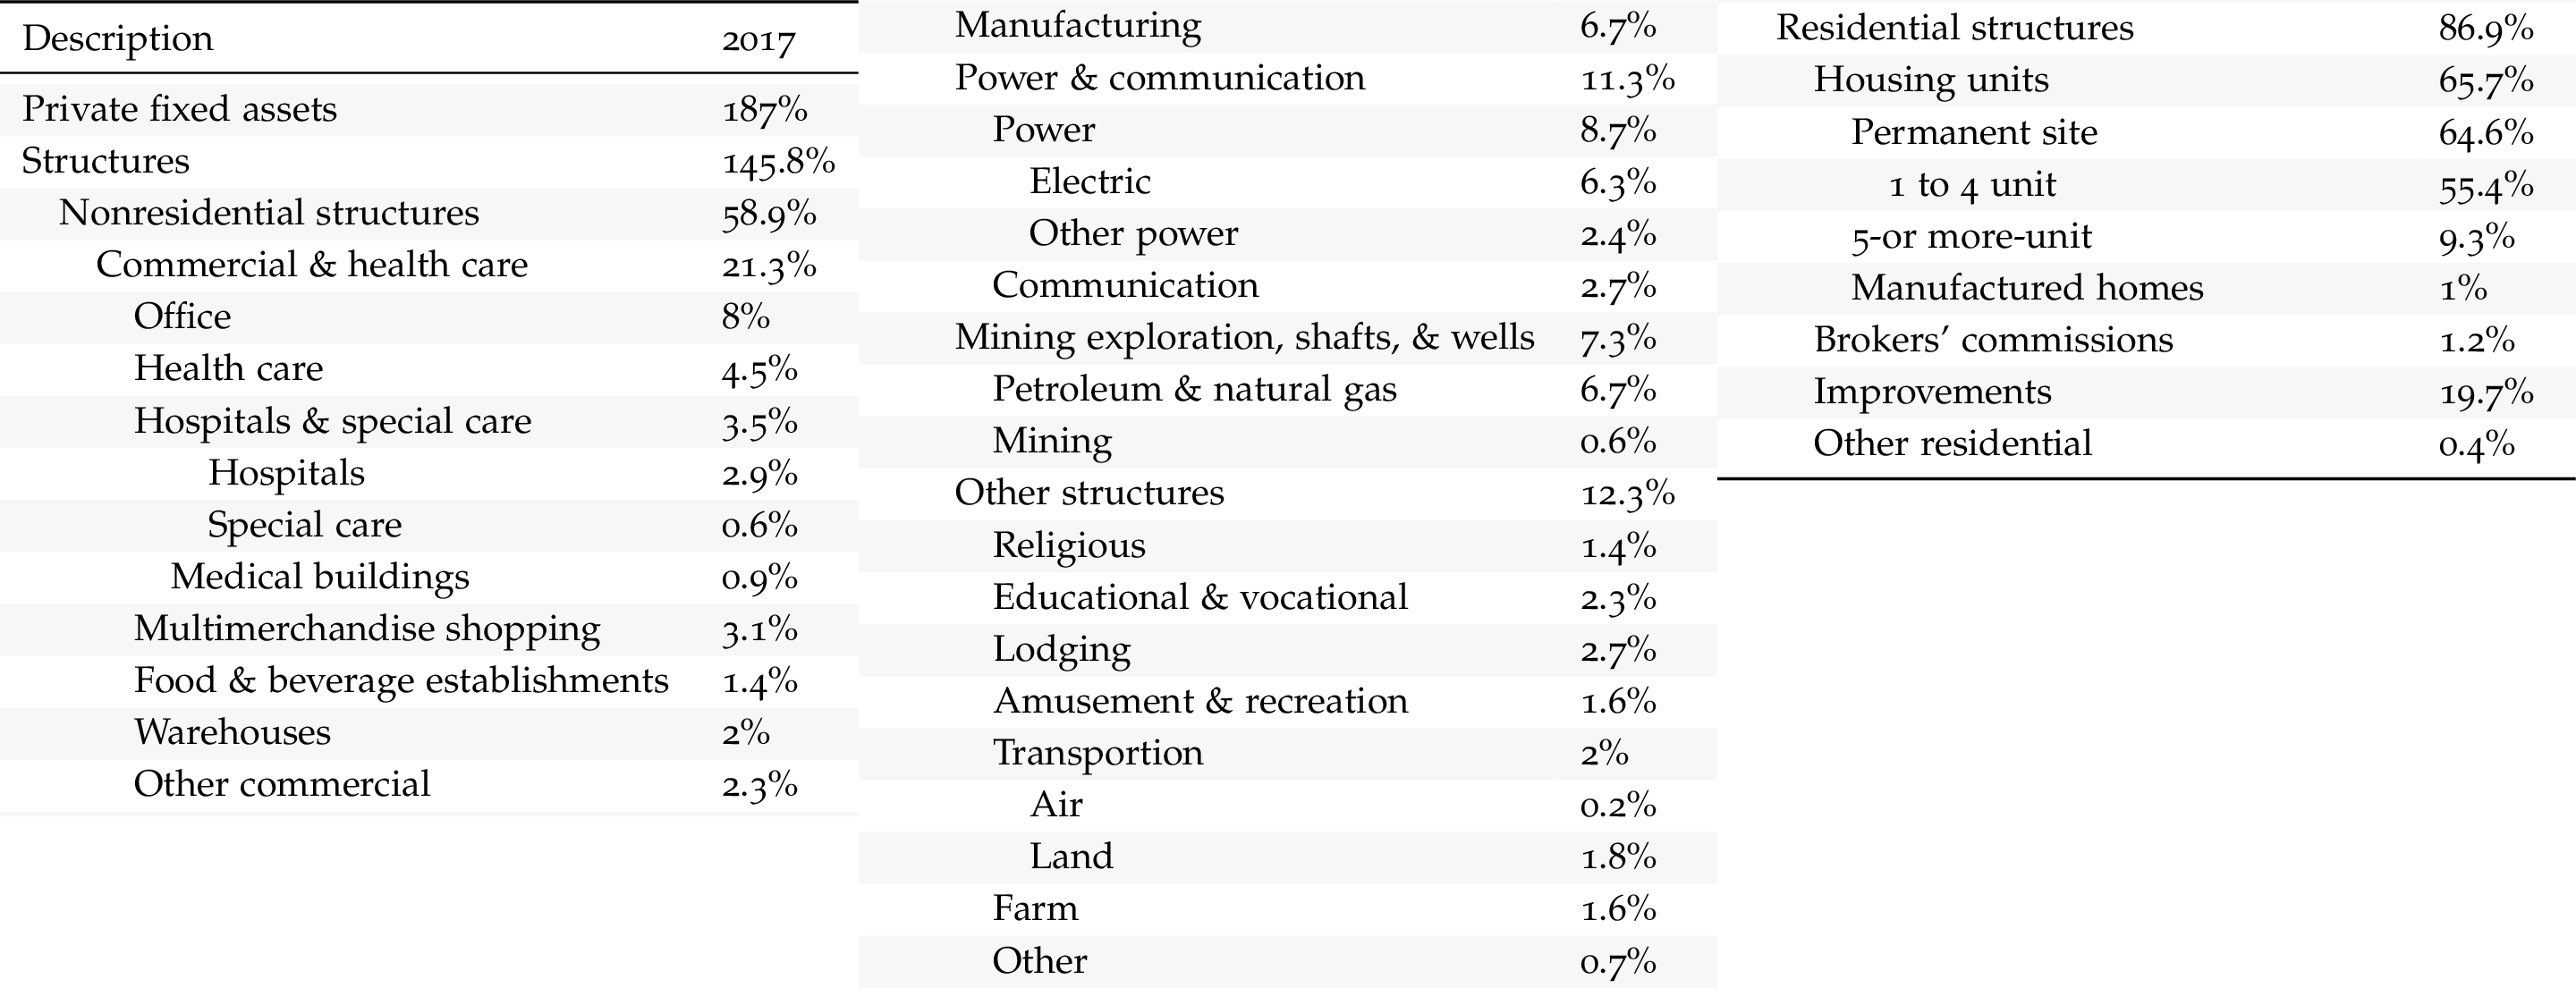
Decomposition of Structures
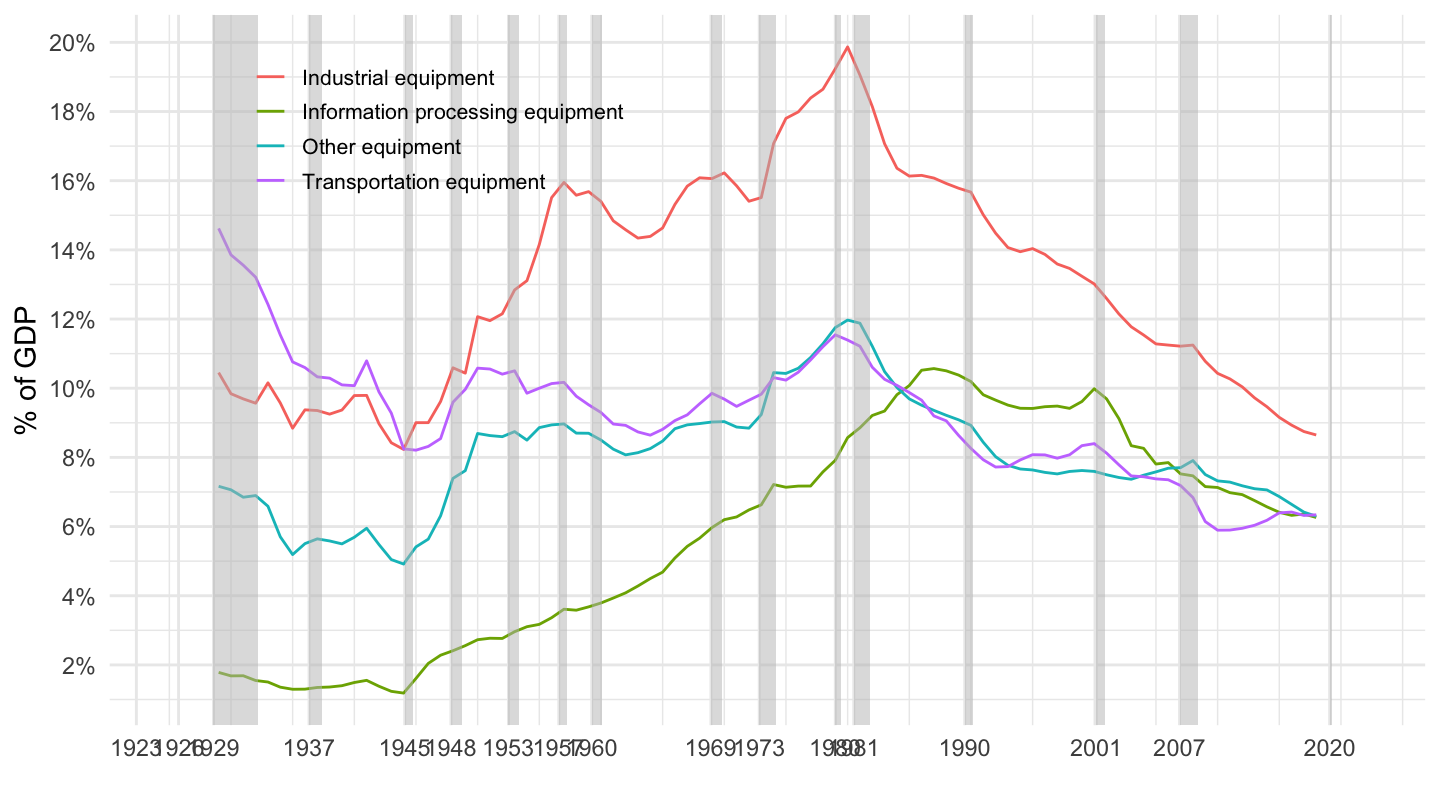
Equipment Capital (% of GDP)
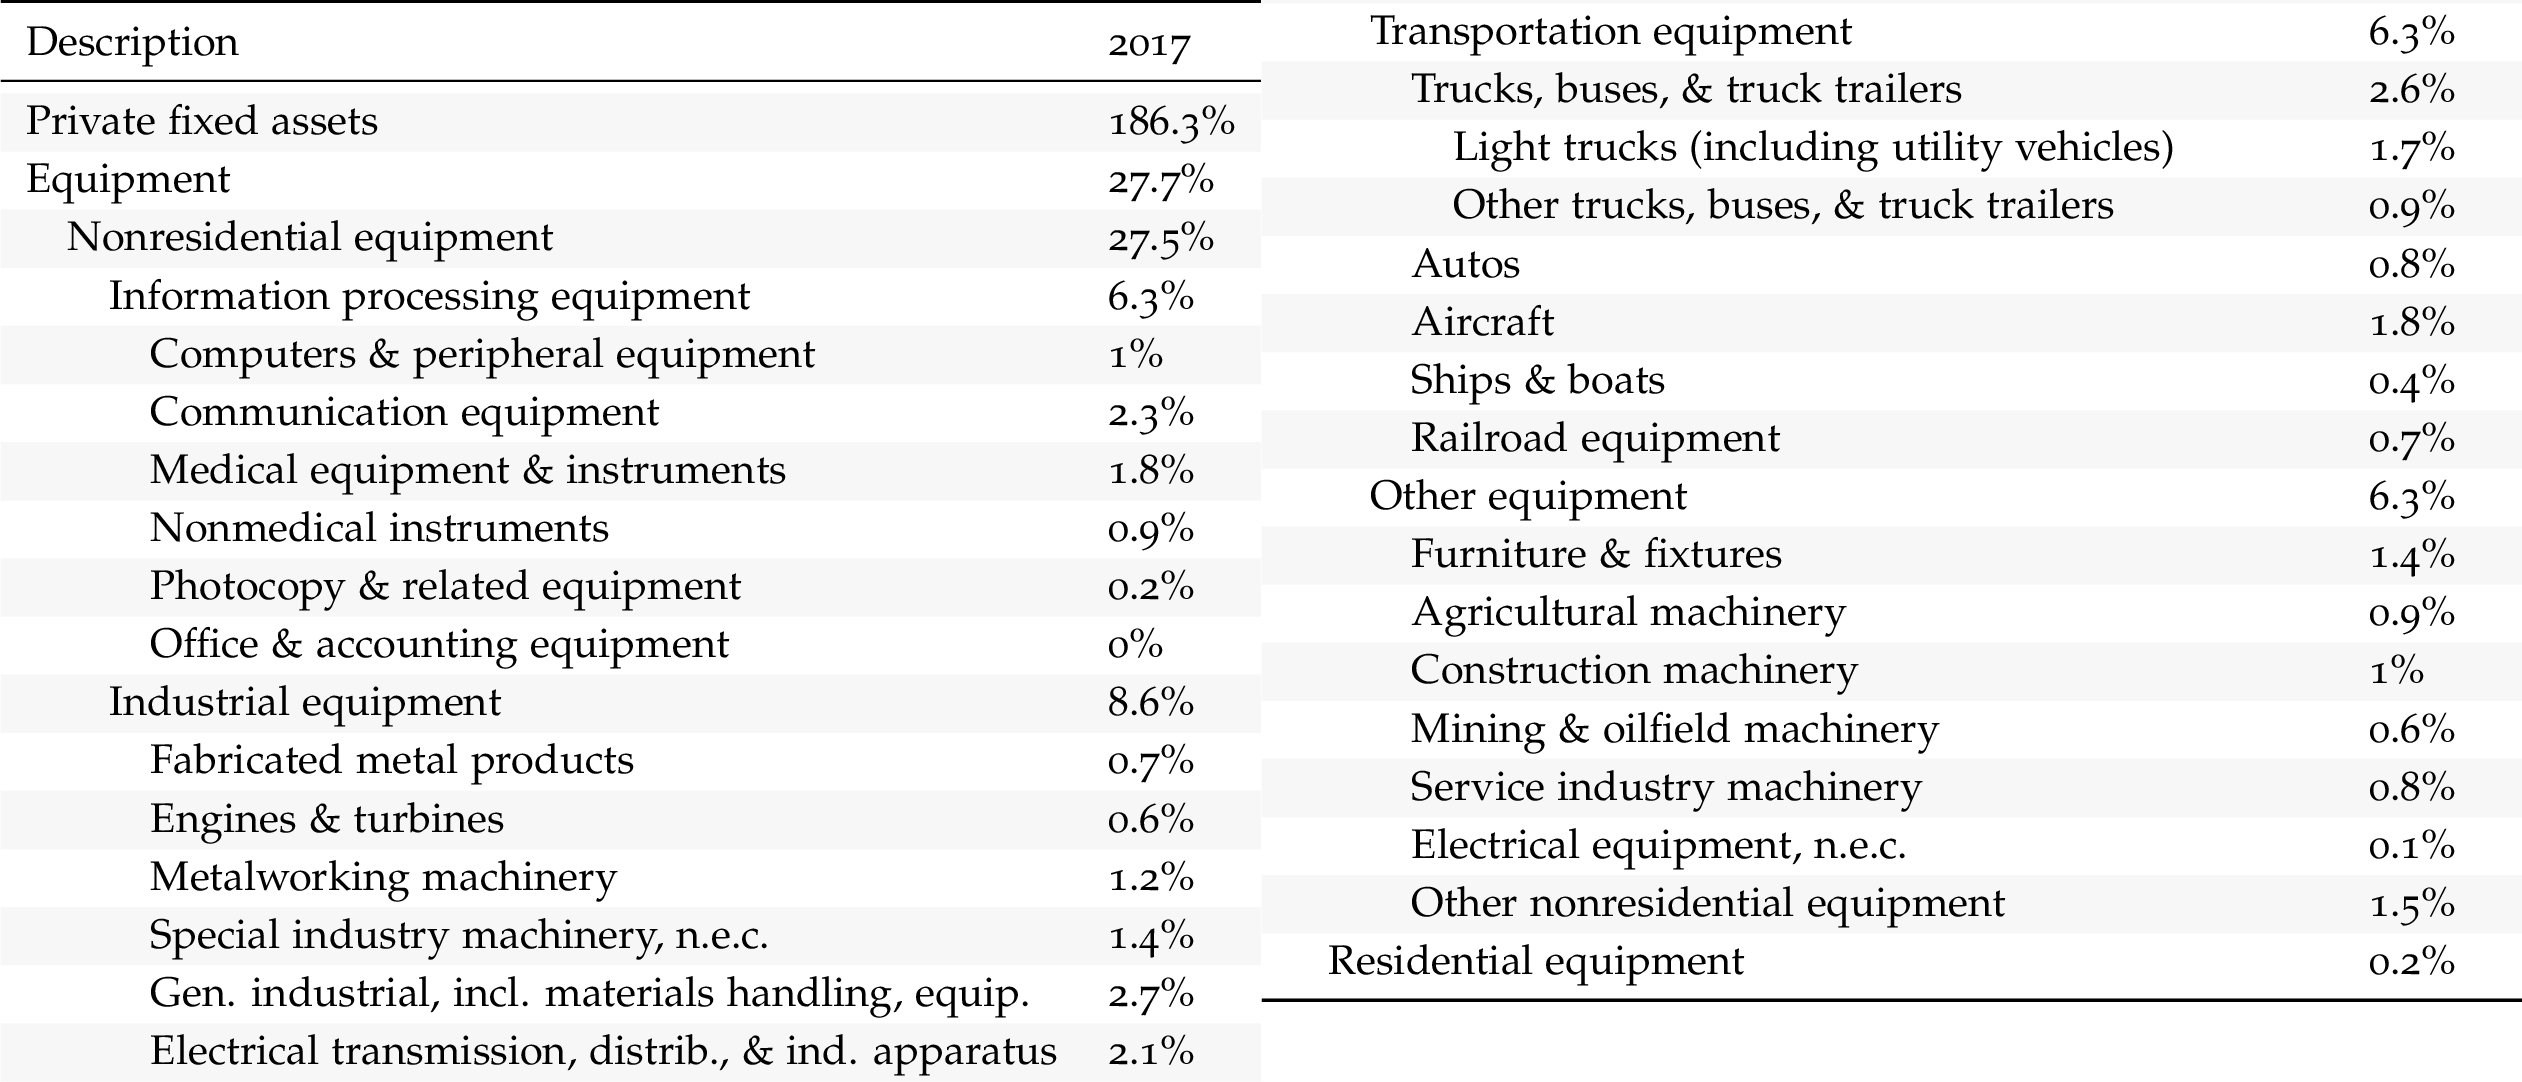
Decomposition of Equipment Capital
Data on investment
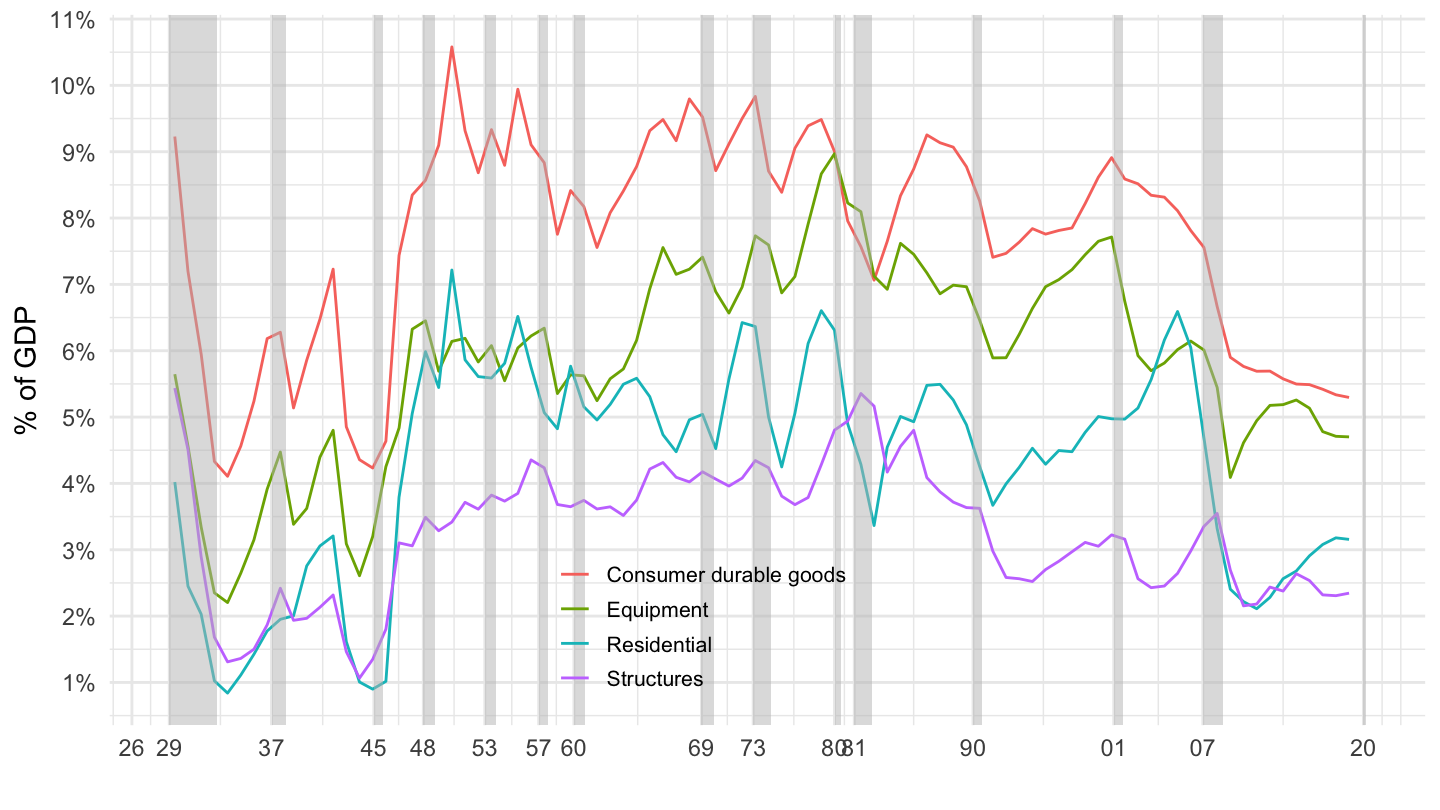
Investment (Broad Categories)

U.S. Main Private Investment Components
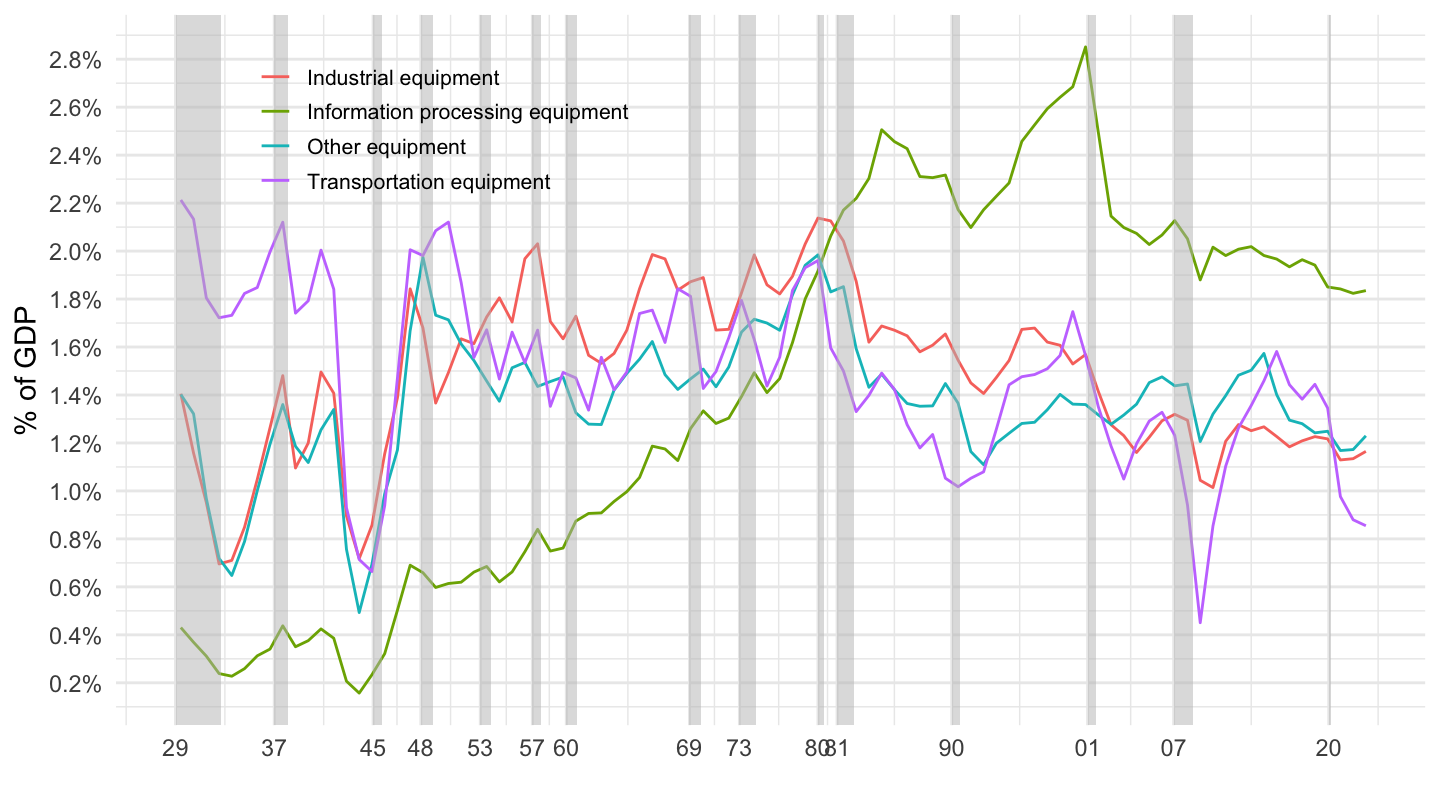
Equipment Investment (Detailed Categories)

Equipment Investment
Data on depreciation
How much is depreciation?
The Solow (1956) growth model is very stylized (some would say, too stylized): it only has one type of capital.
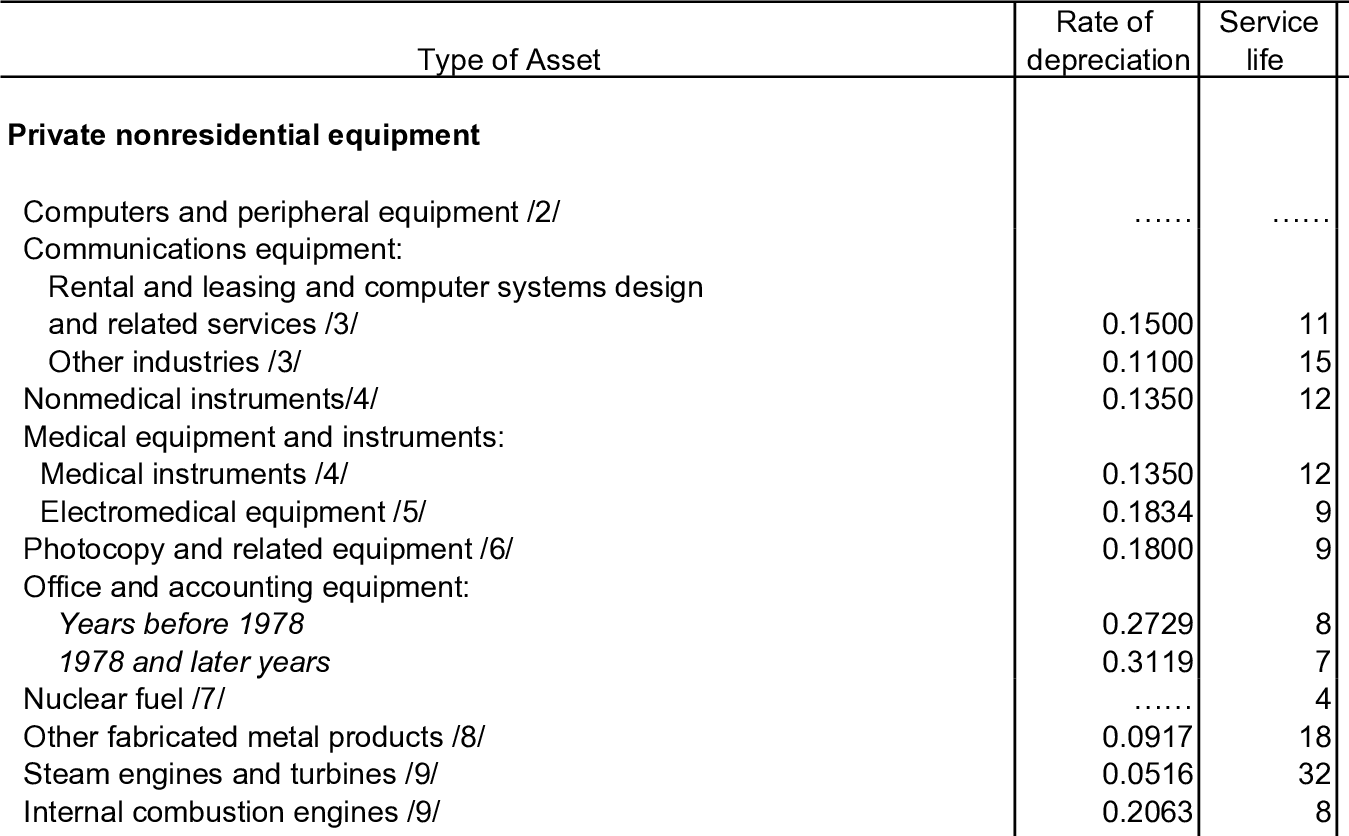
In practice, depreciation is very different for different types of capital. Some examples:
Office and accounting equipment, after 1978: 31.2%.
Office buildings: 2.5%.
Here you can find 6 pages of BEA’s depreciation estimates for different types of capital. (needless to say, this is not exam material…)
Equipment
Structures
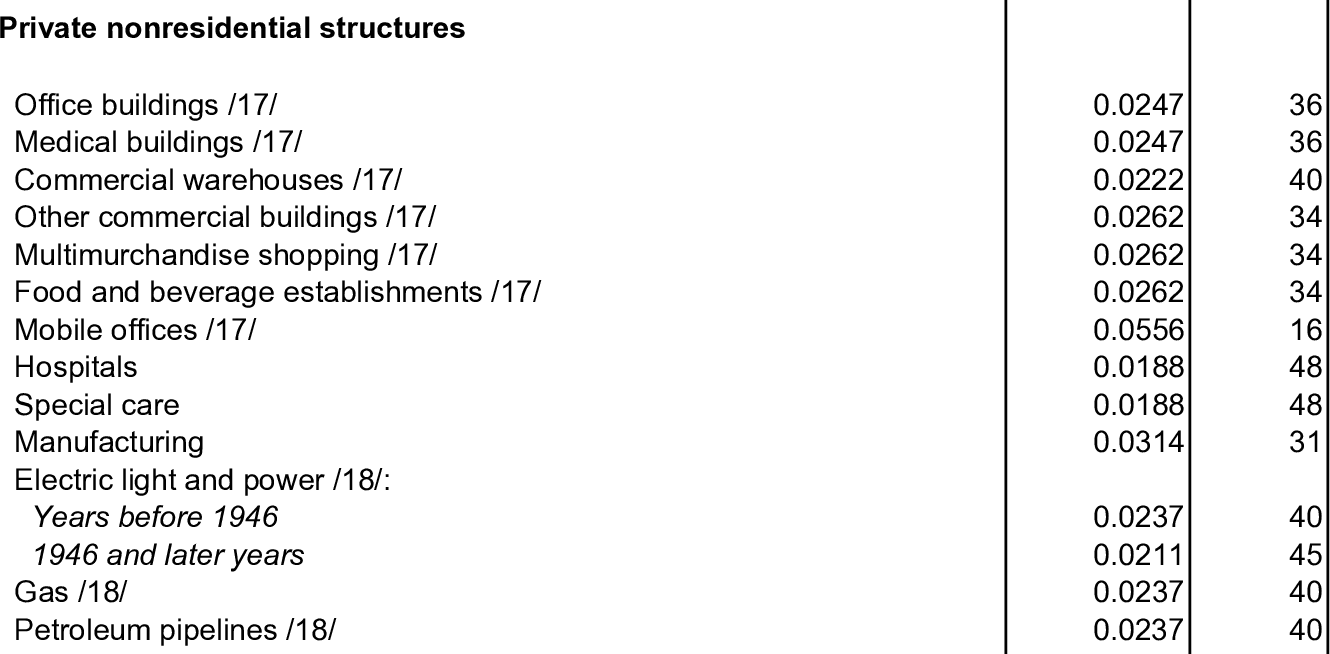
Intellectual Property Products

Residential
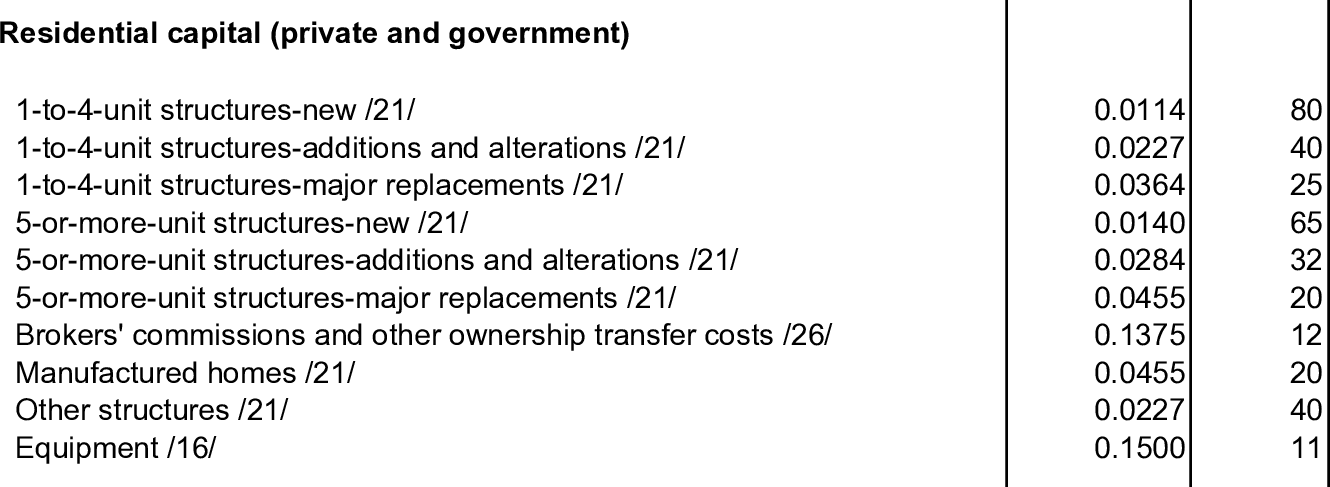
Durables

U.S. Depreciation, Gvt VS Private (% of GDP)
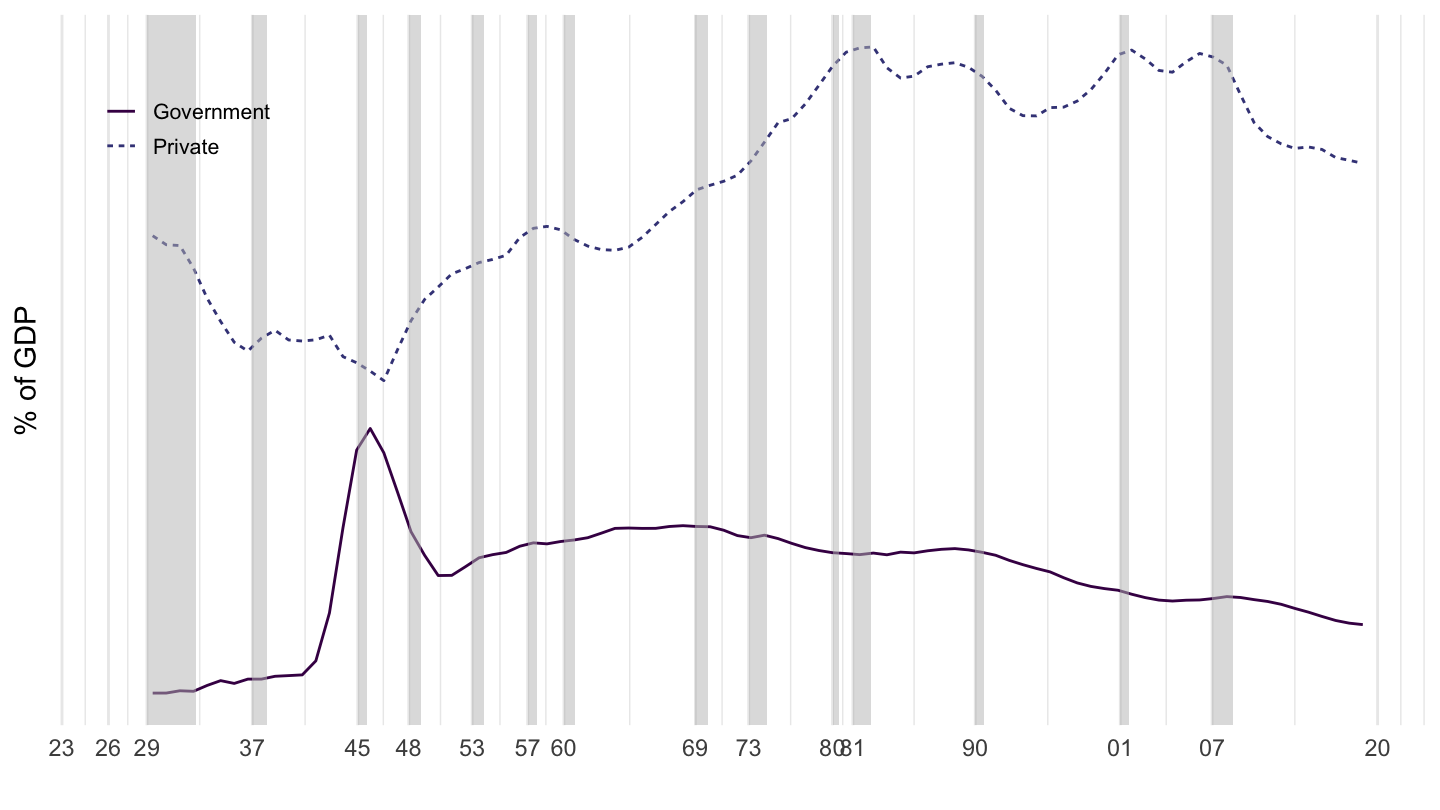
U.S. Private Depreciation
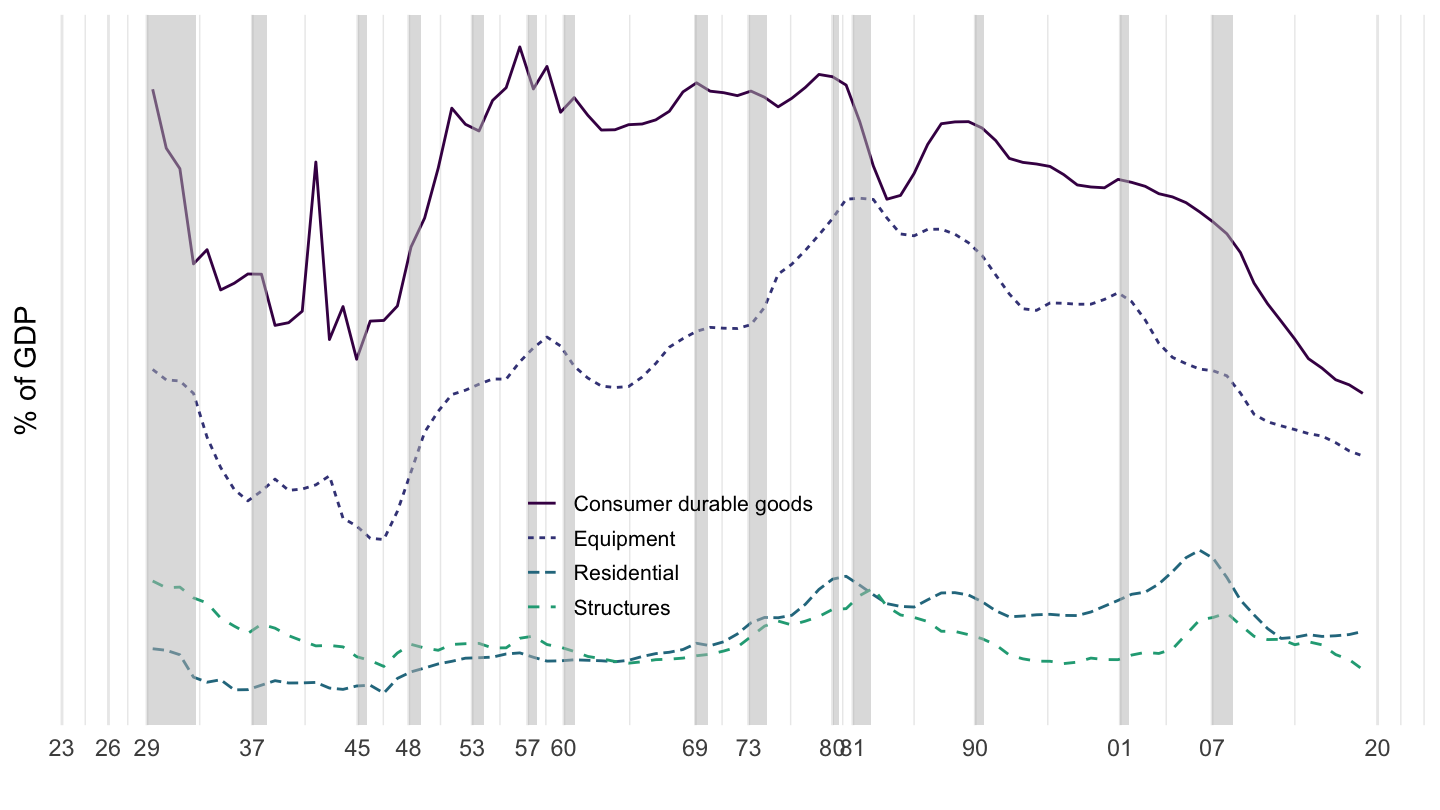
Value VS Quantity of Capital
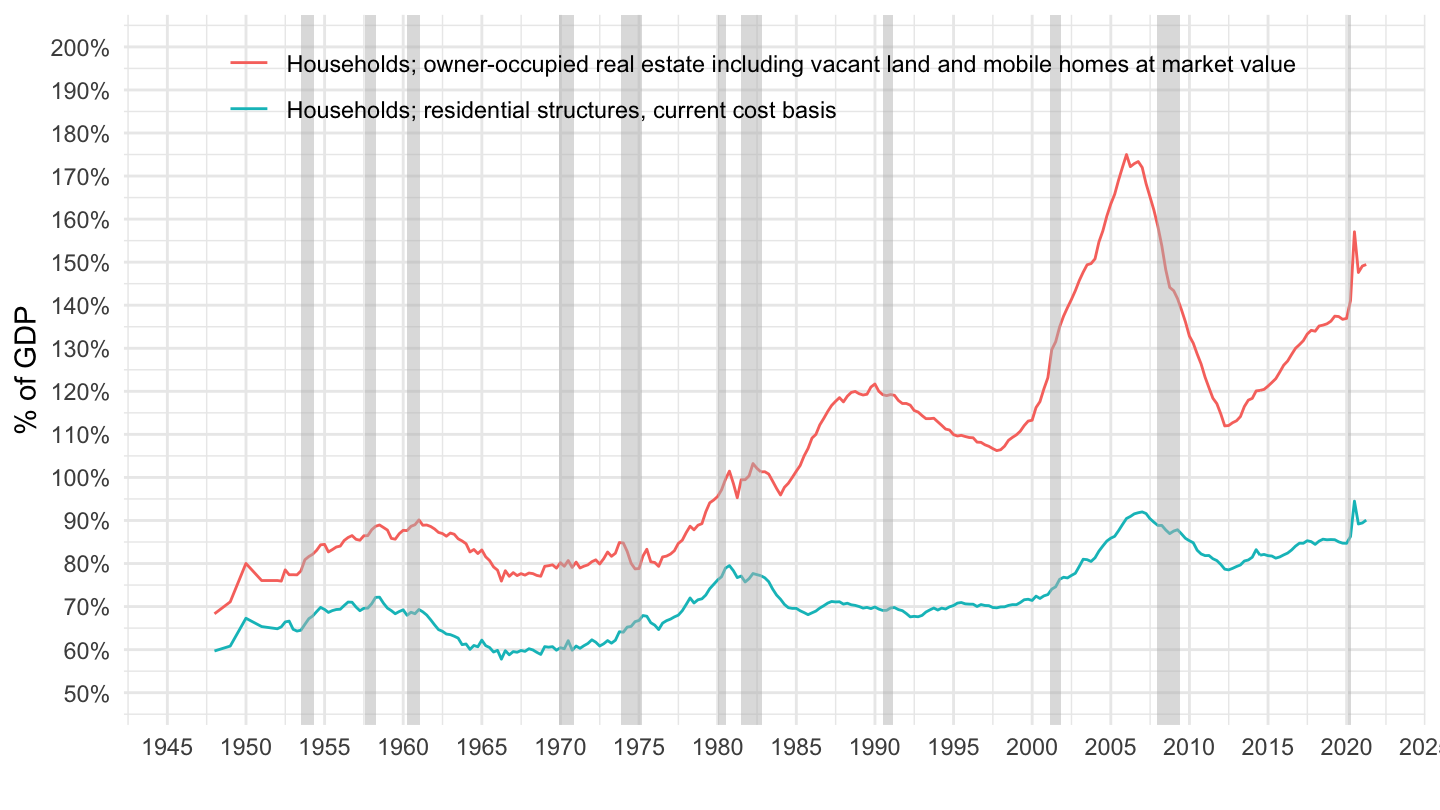
Change in Net Worth of Households - R101

Value VS Quantity - Households - R101
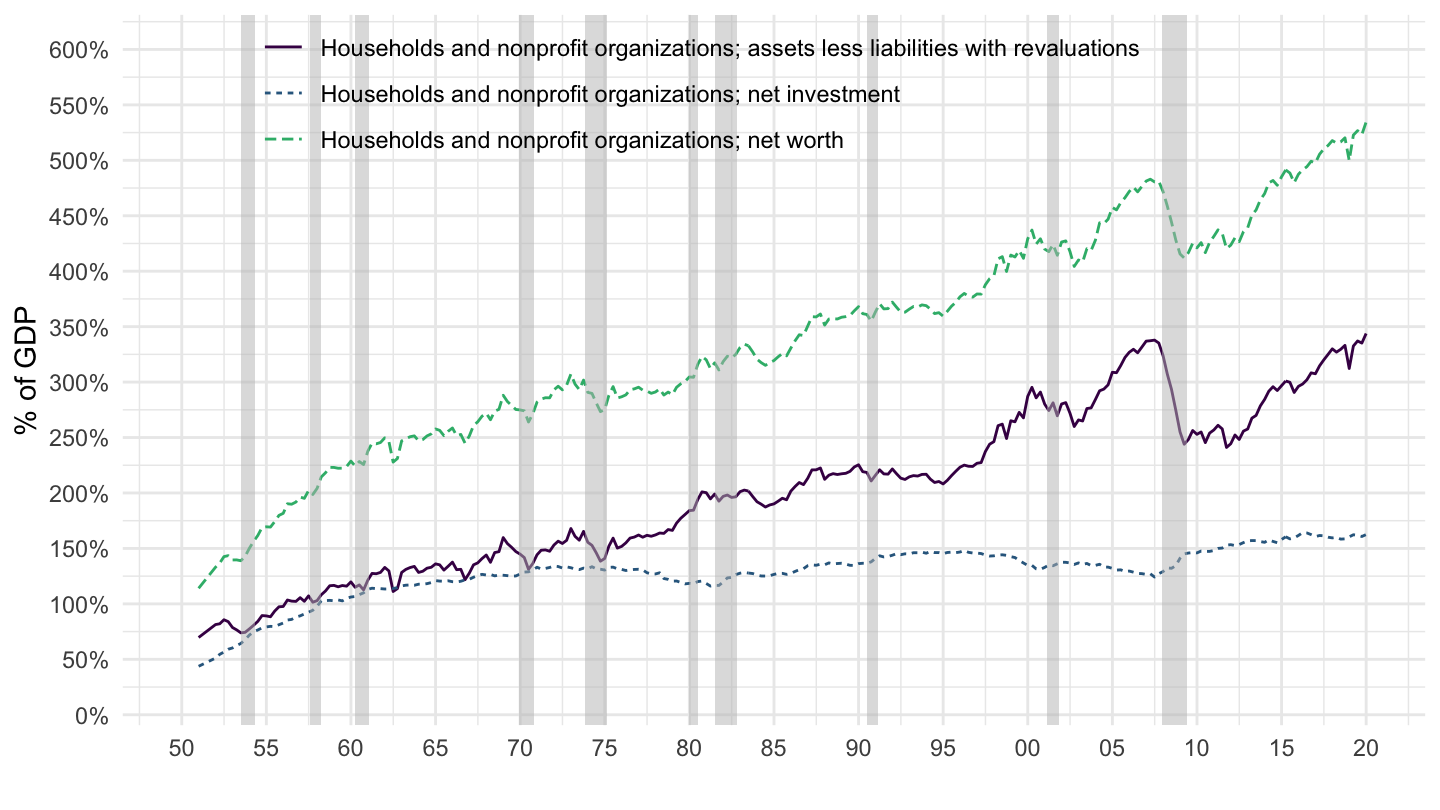
Balance Sheets - Households - B101
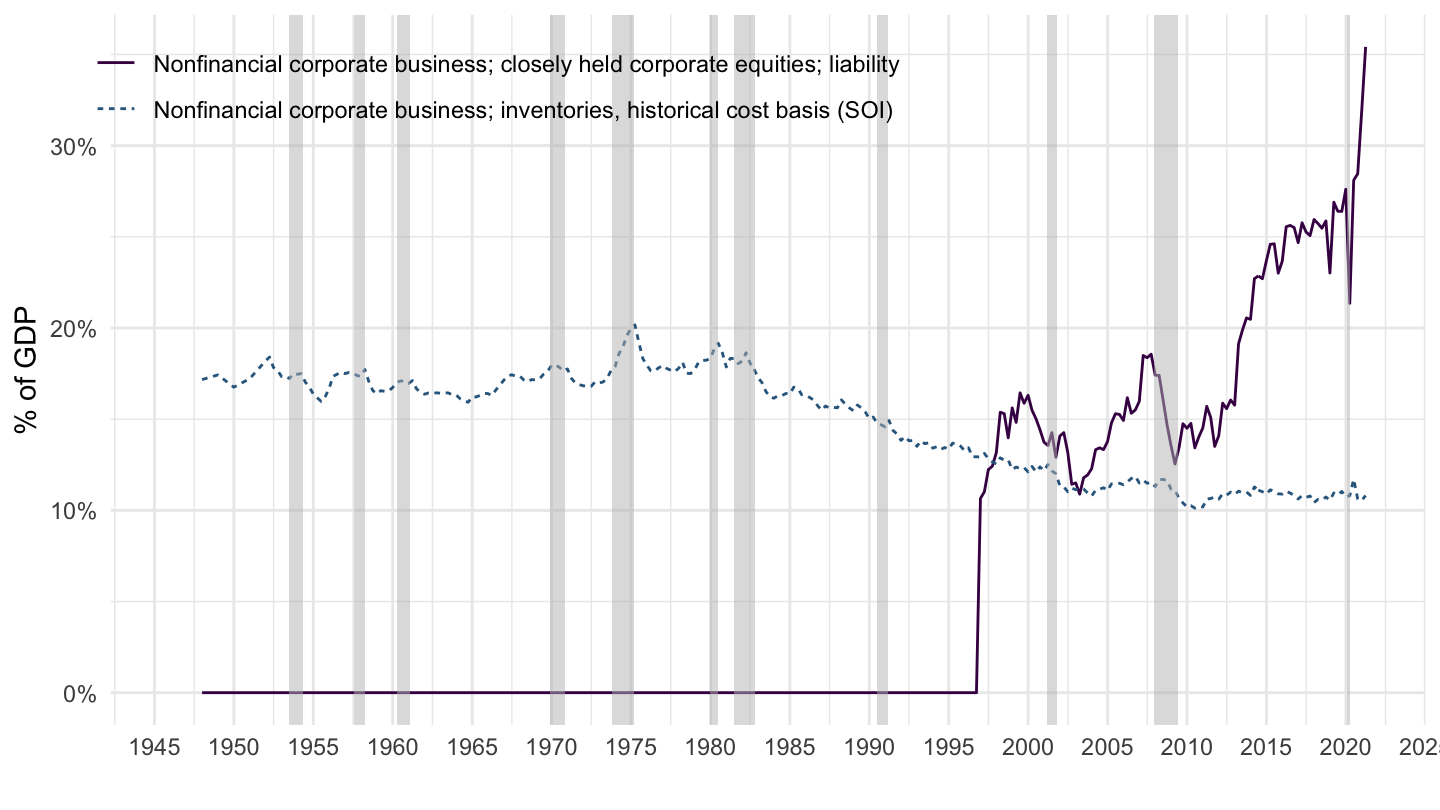
Change in Net Worth - Corporates - R103

Value VS Quantity - Corporates - R103

Balance Sheets - Corporates - B103
Change in Net Worth - Noncorporates - R104
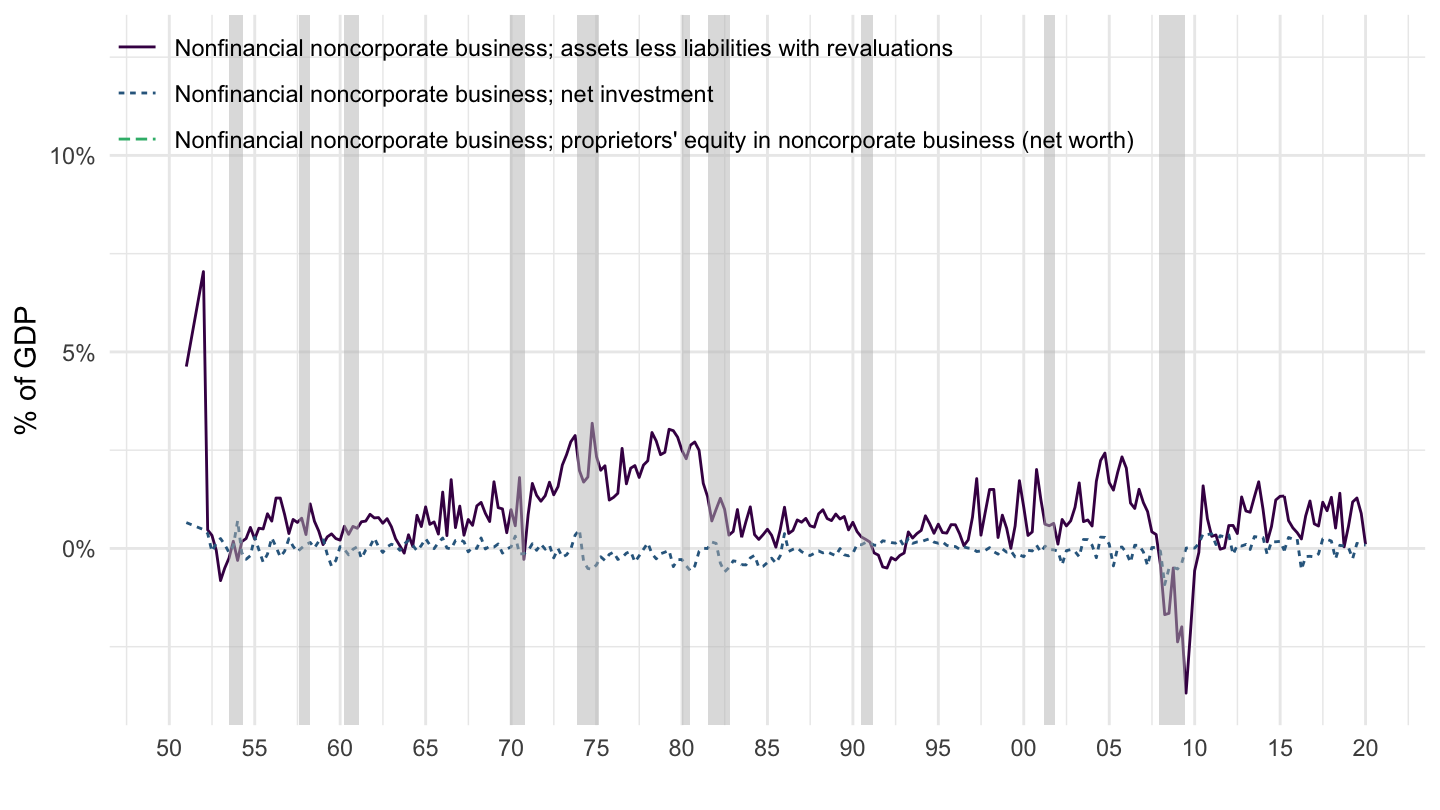
Value VS Quantity - Noncorporates - R104

Market Value of Capital (% of GDP)

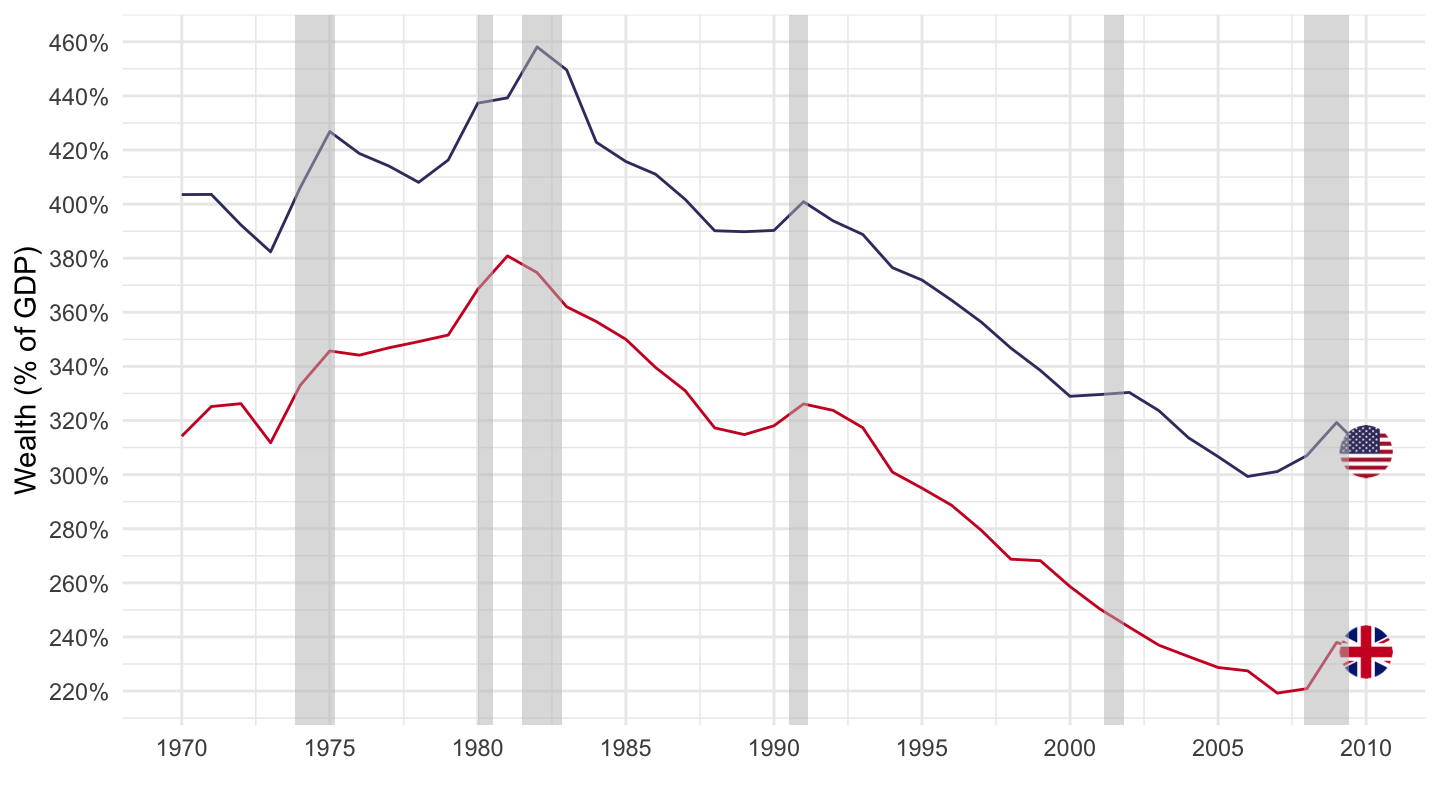
Simulated 1970-2010 based on saving flows 1/2
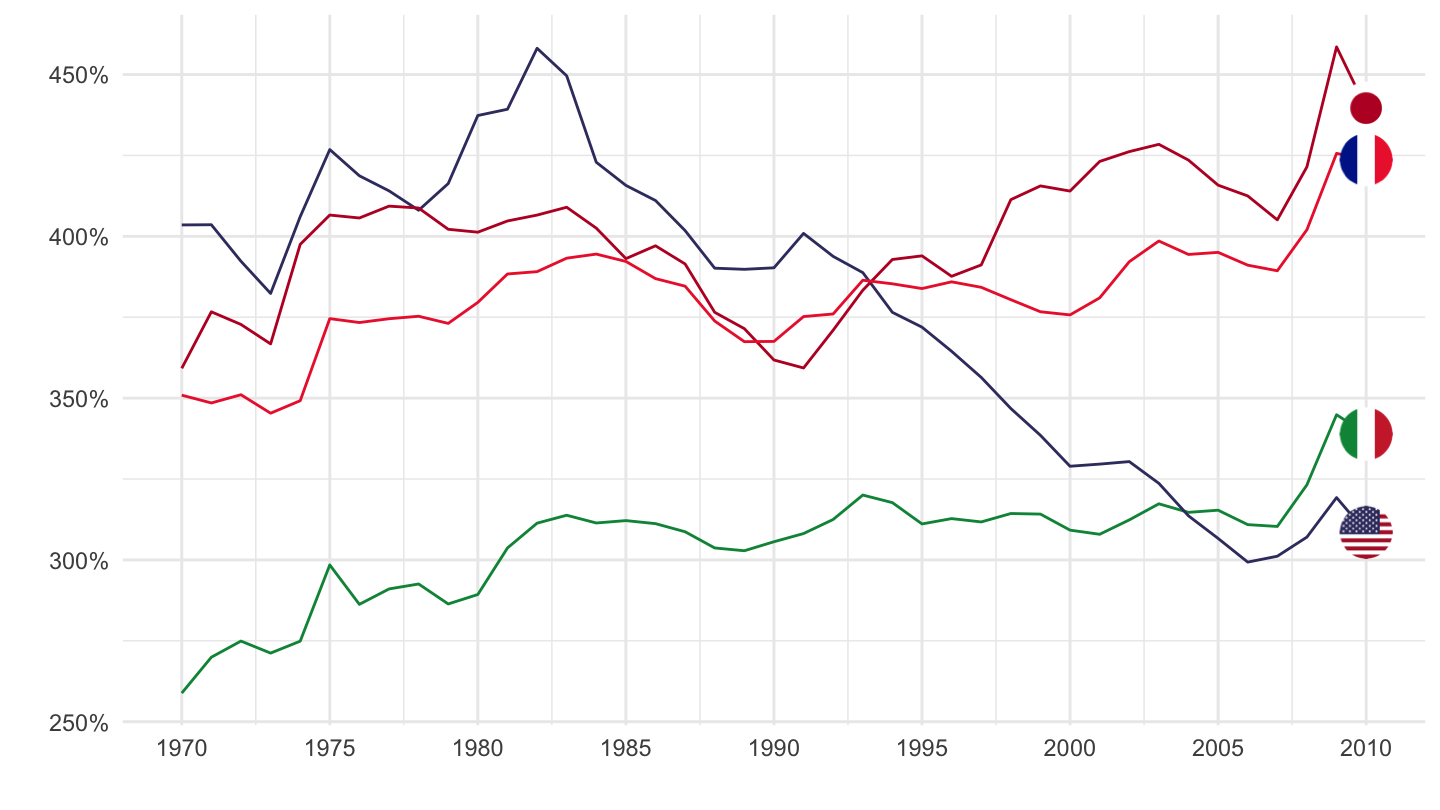
Simulated 1970-2010 based on saving flows 2/2
France - Value of Assets
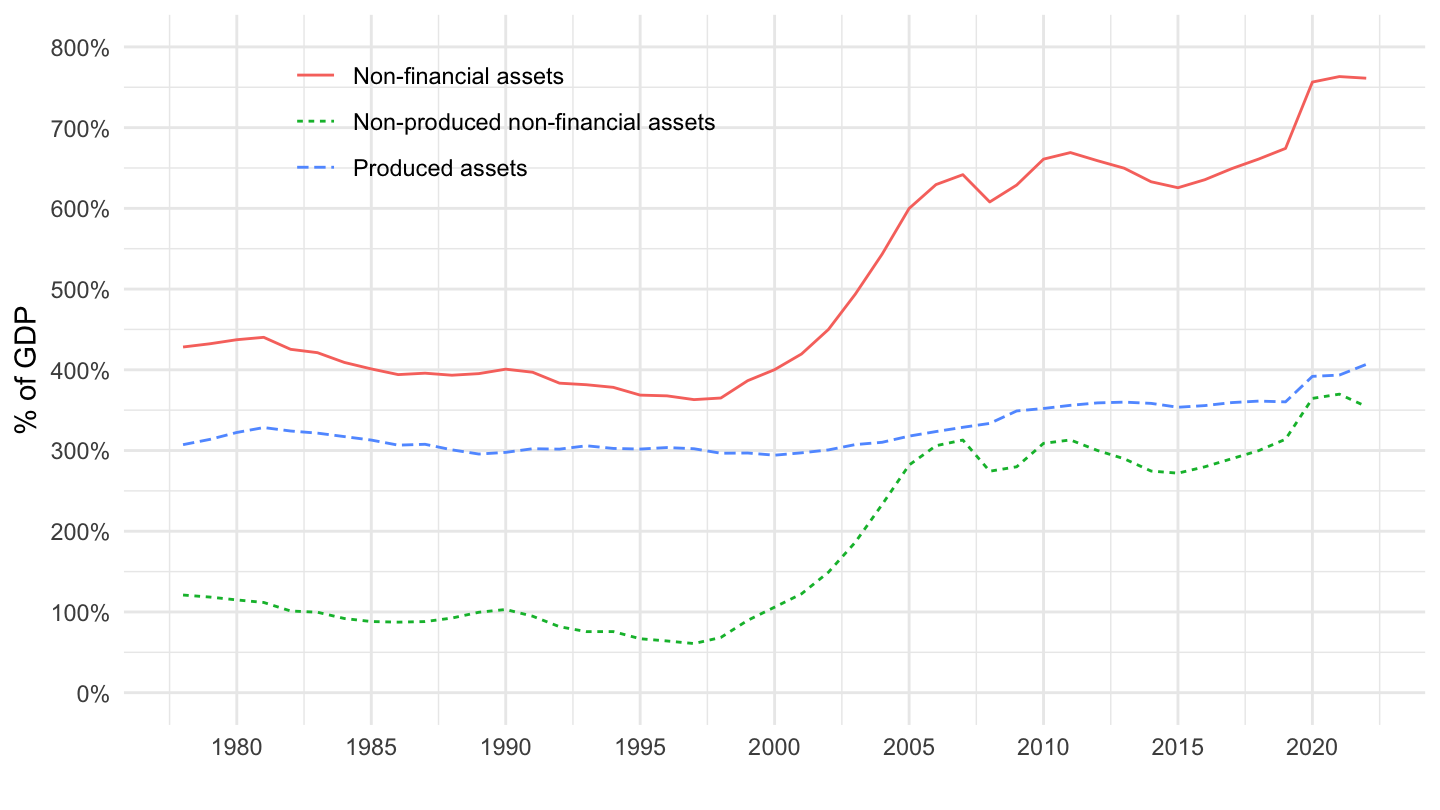
Japan - Value of Assets

“Intangible capital”
The nature of “capital” has changed

Tech companies

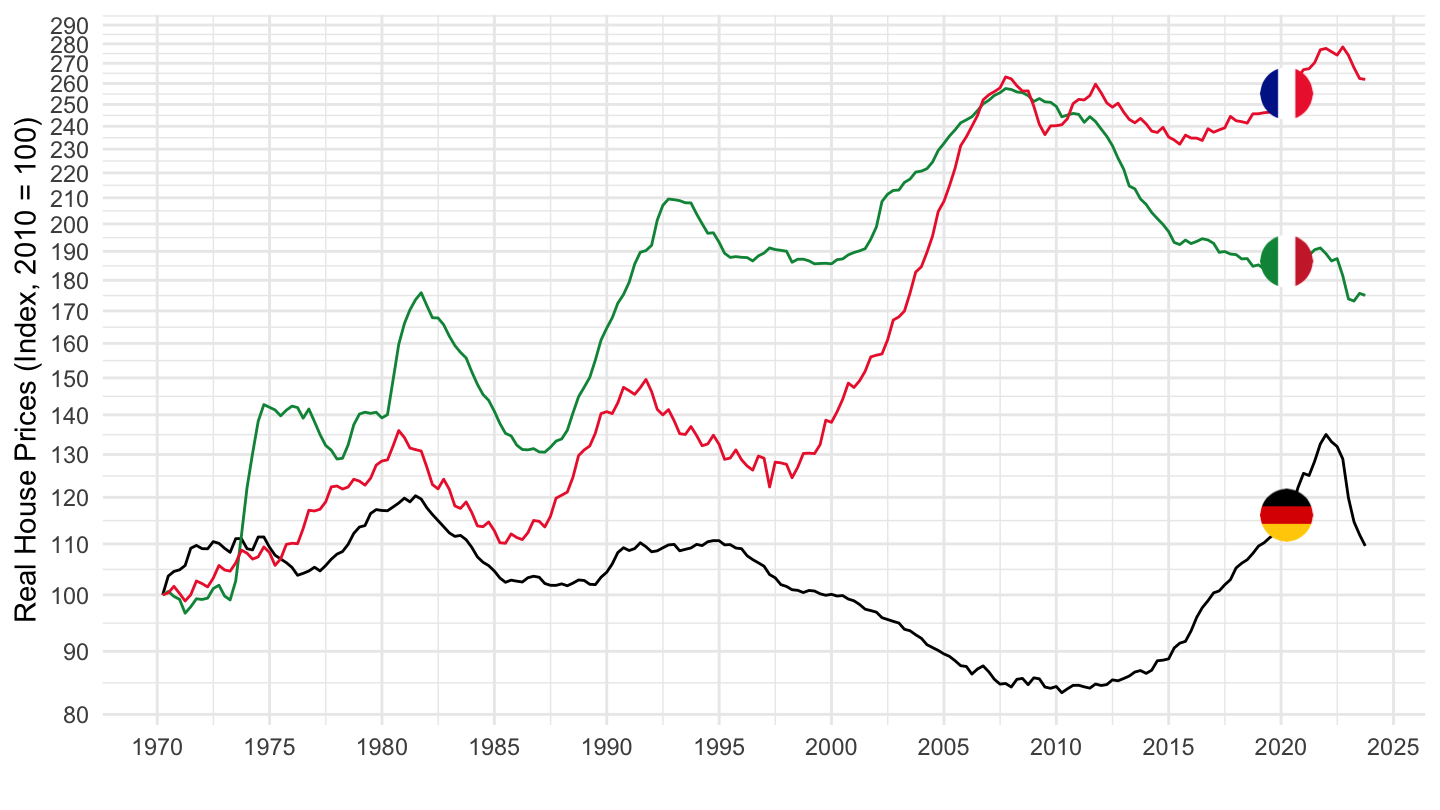
Real House Prices
Japan, United Kingdom, United States

Germany, France, Italy
Over-accumulation of capital?
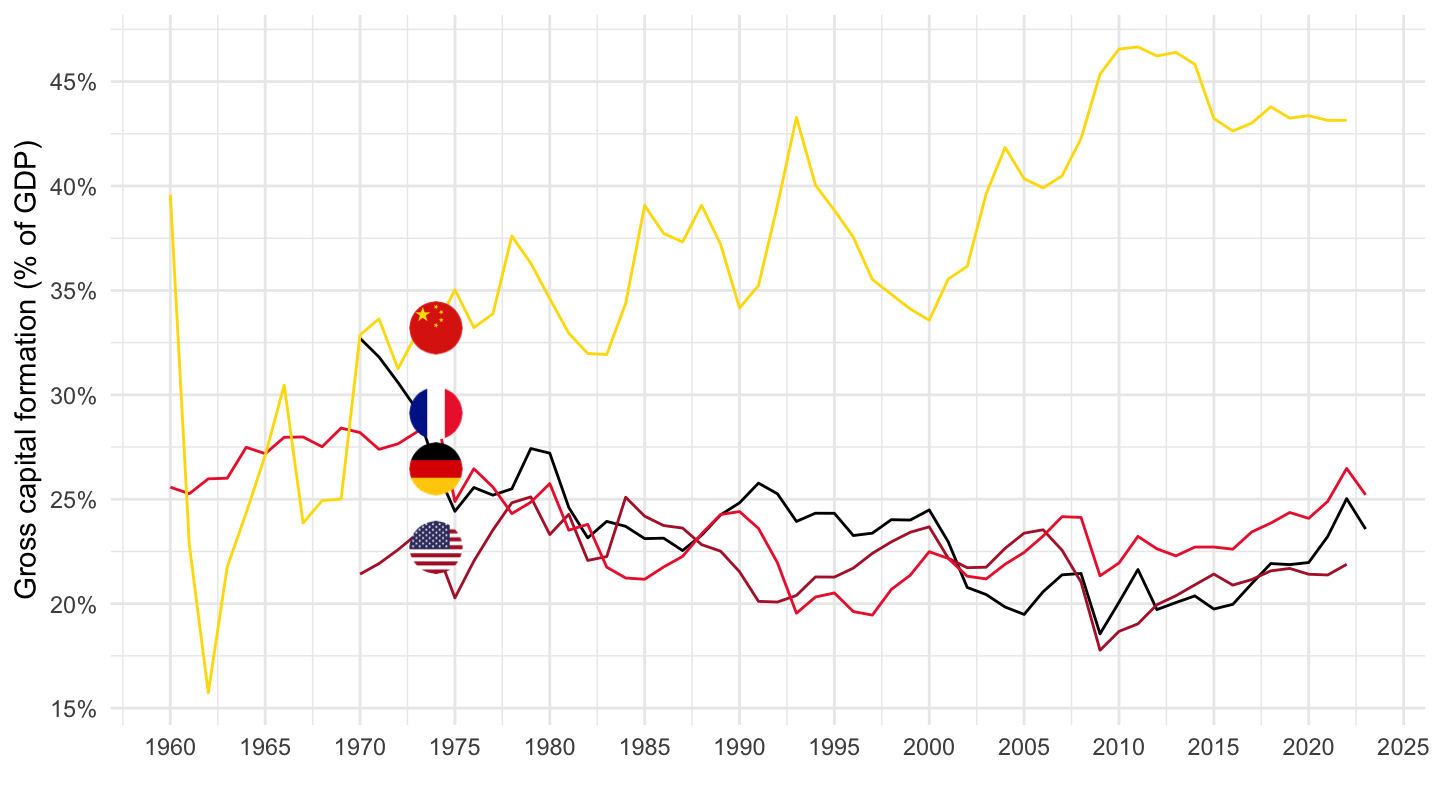
Chinese investment
Low returns to K: Chinese ghost cities
August 27, 2021 - 15 tower blocks get demolished simultaneously in China
Decreasing Returns to capital
Solow, Robert M. 1956. “A Contribution to the Theory of Economic Growth.” The Quarterly Journal of Economics 70 (1): 65–94. https://doi.org/10.2307/1884513.