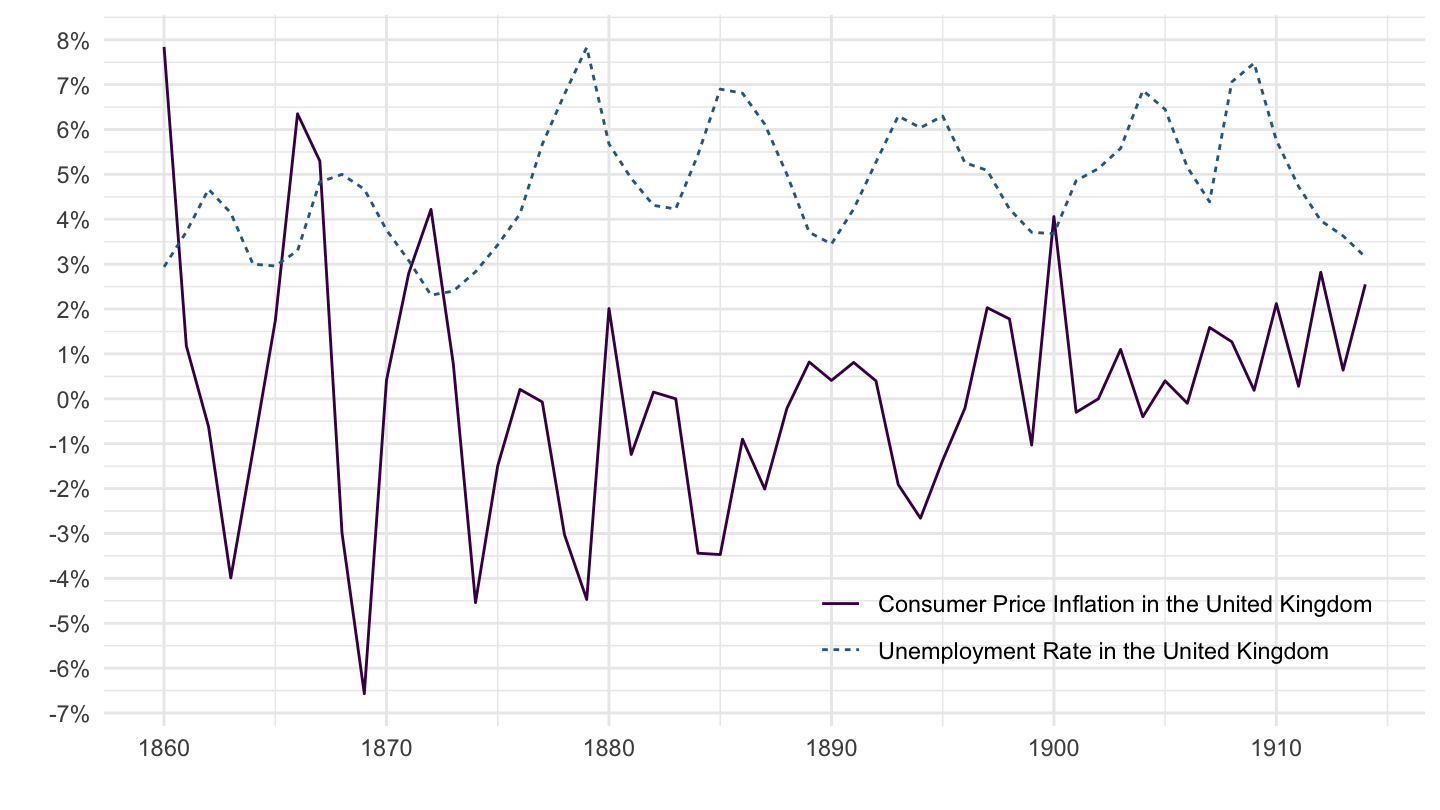
Phillips Curve (1860-1914)
data %>%
  filter(variable %in% c("CPIIUKA", "UNRTUKA"),
         date >= as.Date("1860-01-01"),
         date <= as.Date("1914-01-01"),
         month(date) == 1) %>%
  left_join(data_variables %>%
              select(variable, variable_desc), by = "variable") %>%
  ggplot(.) + theme_minimal() +
  geom_line(aes(x = date, y = value/100, color = variable_desc, linetype = variable_desc)) +
  scale_color_manual(values = viridis(4)[1:3]) +
  scale_x_date(breaks = as.Date(paste0(seq(1850, 2025, 10), "-01-01")),
               labels = date_format("%Y")) +
  scale_y_continuous(breaks = 0.01*seq(-50, 50, 1),
                     labels = scales::percent_format(accuracy = 1)) +
  theme(legend.position = c(0.75, 0.15),
        legend.title = element_blank()) +
  ylab("") + xlab("")