
Last observation: Q3 2019 (N = 1511)
First observation: Q1 1960 (N = 1632)
Last data update: 02 août 2026, 09:05
Last compile: 16 oct. 2026, 01:30
QASA_TABLE720R |>
  left_join(QASA_TABLE720R_var$TRANSACTION |>
              setNames(c("TRANSACTION", "Transaction")), by = "TRANSACTION") |>
  left_join(QASA_TABLE720R_var$SECTOR |>
              setNames(c("SECTOR", "Sector")), by = "SECTOR") |>
  group_by(TRANSACTION, Transaction, SECTOR, Sector, MEASURE) |>
  summarise(Nobs = n()) |>
  arrange(-Nobs) %>%
{if (is_html_output()) datatable(., filter = 'top', rownames = F) else .}QASA_TABLE720R |>
filter(LOCATION == "DEU",
# RS14_S15: Household Sector
SECTOR == "RS14_S15",
# CAR: Current prices, annual levels
MEASURE == "CAR") |>
right_join(QASA_TABLE720R_var$TRANSACTION |>
filter(grepl("pension", label) | grepl("Pension", label)) |>
setNames(c("TRANSACTION", "Transaction")), by = "TRANSACTION") |>
filter(obsValue != 0) |>
arrange(-obsValue) |>
quarter_to_enddate() |>
mutate(TRANSACTION_desc = paste0(TRANSACTION, ": ", Transaction)) |>
ggplot() + theme_minimal() + xlab("") + ylab("") +
geom_line(aes(x = date, y = obsValue / 1000, color = TRANSACTION_desc, linetype = TRANSACTION_desc)) +
scale_color_manual(values = viridis(4)[1:3]) +
scale_x_date(breaks = as.Date(paste0(seq(1960, 2020, 2), "-01-01")),
labels = date_format("%Y")) +
scale_y_continuous(breaks = seq(0, 4000, 200),
labels = dollar_format(suffix = " Bn€", prefix = "", accuracy = 1)) +
theme(legend.position = c(0.4, 0.9),
legend.title = element_blank())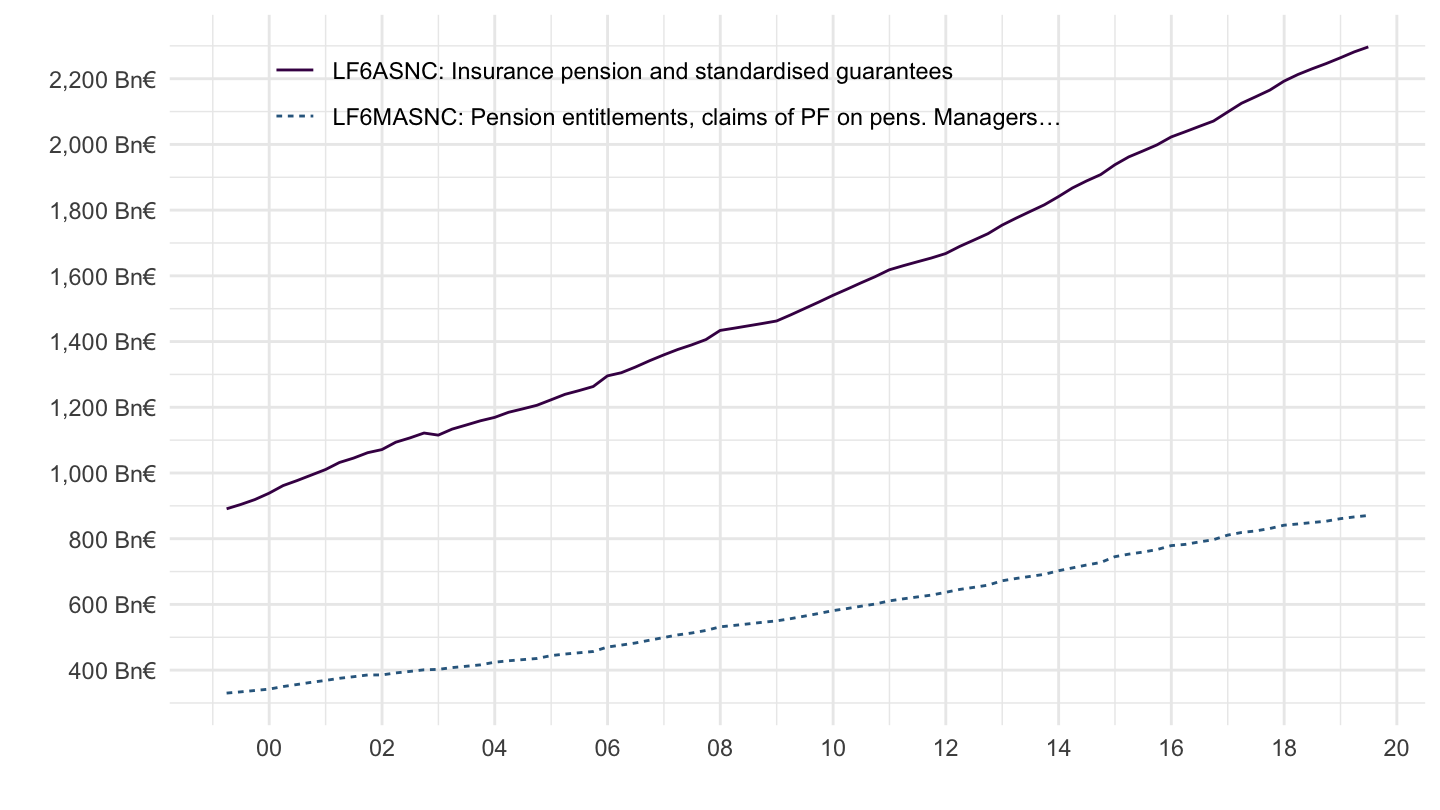
QASA_TABLE720R |>
  filter(LOCATION == "DEU",
         # RS14_S15: Household Sector
         SECTOR == "RS14_S15",
         # CAR: Current prices, annual levels
         MEASURE == "CAR") |>
  right_join(QASA_TABLE720R_var$TRANSACTION |>
               filter(grepl("pension", label) | grepl("Pension", label)) |>
              setNames(c("TRANSACTION", "Transaction")), by = "TRANSACTION") |>
  filter(obsValue != 0) |>
  arrange(-obsValue) |>
  quarter_to_enddate() |>
  mutate(TRANSACTION_desc = paste0(TRANSACTION, ": ", Transaction)) |>
  left_join(QNA_B1_GE_DEU, by = "date") |>
  # QNA_B1_GE_DEU.RData's GDP column is now named B1_GE_CPCARSA, not
  # B1_GE_CARSA (renamed upstream at some point, same series otherwise).
  mutate(obsValue = obsValue / B1_GE_CPCARSA) |>
  ggplot() + theme_minimal() + xlab("") + ylab("% of GDP") +
  geom_line(aes(x = date, y = obsValue, color = TRANSACTION_desc, linetype = TRANSACTION_desc)) +
  scale_color_manual(values = viridis(4)[1:3]) +
  scale_x_date(breaks = as.Date(paste0(seq(1960, 2020, 2), "-01-01")),
               labels = date_format("%Y")) +
  scale_y_continuous(breaks = 0.01*seq(0, 100, 5),
                     labels = scales::percent_format(accuracy = 1)) +
  theme(legend.position = c(0.6, 0.5),
        legend.title = element_blank())
QASA_TABLE720R |>
  filter(LOCATION == "DEU",
         # RS1: Total economy
         SECTOR == "RS1",
         # CAR: Current prices, annual levels
         MEASURE == "CAR") |>
  right_join(QASA_TABLE720R_var$TRANSACTION |>
               filter(grepl("pension", label) | grepl("Pension", label)) |>
              setNames(c("TRANSACTION", "Transaction")), by = "TRANSACTION") |>
  filter(obsValue != 0) |>
  arrange(-obsValue) |>
  quarter_to_enddate() |>
  mutate(TRANSACTION_desc = paste0(TRANSACTION, ": ", Transaction)) |>
  ggplot() + theme_minimal() + xlab("") + ylab("") +
  geom_line(aes(x = date, y = obsValue / 1000, color = TRANSACTION_desc, linetype = TRANSACTION_desc)) +
  scale_color_manual(values = viridis(5)[1:4]) +
  scale_x_date(breaks = as.Date(paste0(seq(1960, 2020, 2), "-01-01")),
               labels = date_format("%Y")) +
  scale_y_continuous(breaks = seq(0, 4000, 200),
                     labels = dollar_format(suffix = " Bn€", prefix = "", accuracy = 1)) +
  theme(legend.position = c(0.38, 0.87),
        legend.title = element_blank())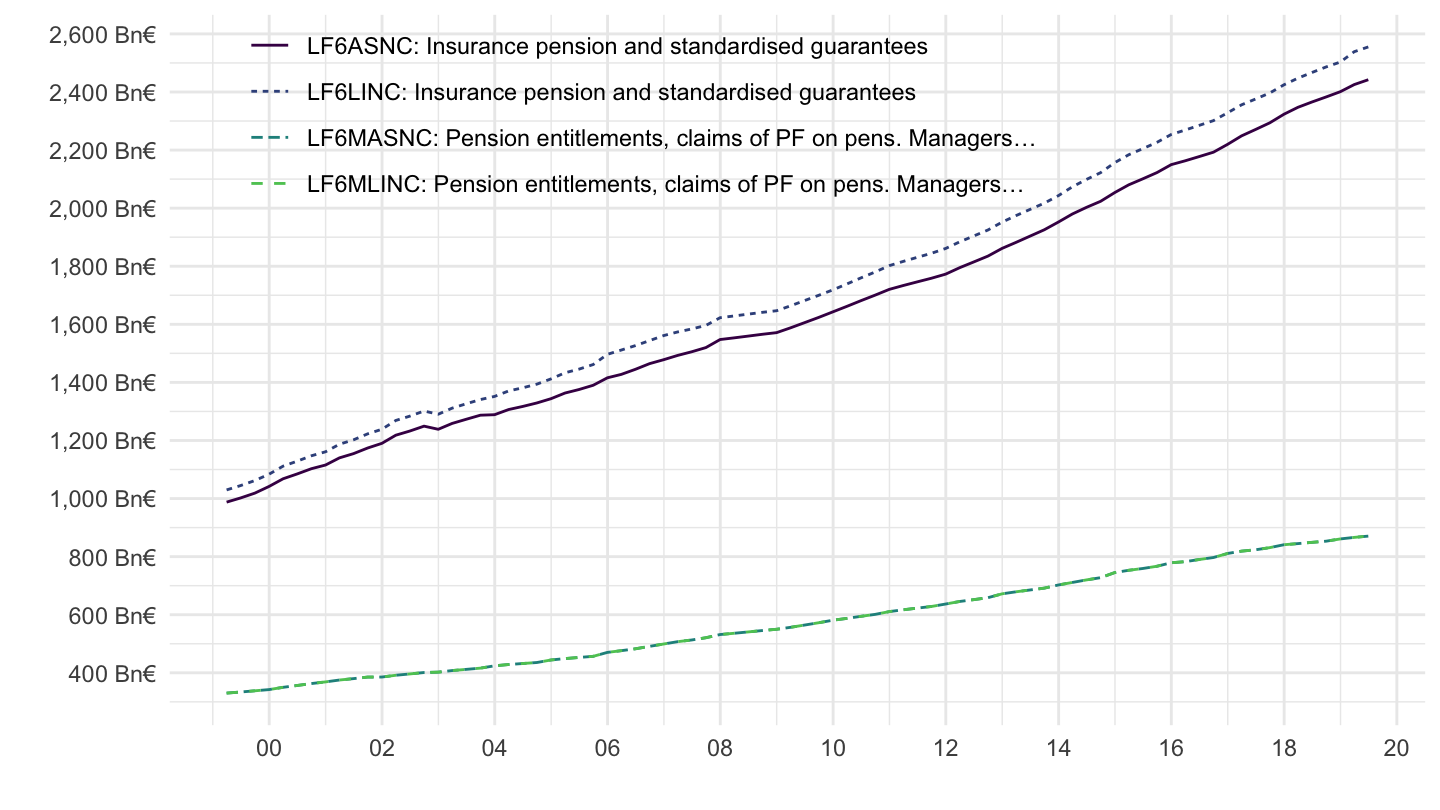
QASA_TABLE720R |>
  filter(LOCATION == "DEU",
         # RS1: Total economy
         SECTOR == "RS1",
         # CAR: Current prices, annual levels
         MEASURE == "CAR") |>
  right_join(QASA_TABLE720R_var$TRANSACTION |>
               filter(grepl("pension", label) | grepl("Pension", label)) |>
              setNames(c("TRANSACTION", "Transaction")), by = "TRANSACTION") |>
  filter(obsValue != 0) |>
  arrange(-obsValue) |>
  quarter_to_enddate() |>
  mutate(TRANSACTION_desc = paste0(TRANSACTION, ": ", Transaction)) |>
  left_join(QNA_B1_GE_DEU, by = "date") |>
  # QNA_B1_GE_DEU.RData's GDP column is now named B1_GE_CPCARSA, not
  # B1_GE_CARSA (renamed upstream at some point, same series otherwise).
  mutate(obsValue = obsValue / B1_GE_CPCARSA) |>
  ggplot() + theme_minimal() + xlab("") + ylab("% of GDP") +
  geom_line(aes(x = date, y = obsValue, color = TRANSACTION_desc, linetype = TRANSACTION_desc)) +
  scale_color_manual(values = viridis(5)[1:4]) +
  scale_x_date(breaks = as.Date(paste0(seq(1960, 2020, 2), "-01-01")),
               labels = date_format("%Y")) +
  scale_y_continuous(breaks = 0.01*seq(0, 100, 5),
                     labels = scales::percent_format(accuracy = 1)) +
  theme(legend.position = c(0.6, 0.5),
        legend.title = element_blank())
QASA_TABLE720R |>
  filter(LOCATION == "DEU",
         # RS129: Pension funds
         SECTOR == "RS129",
         MEASURE == "CAR",
         # LBF90NC: Financial net worth
         # LFASNC: Financial assets
         # LFLINC: Financial liabilities
         TRANSACTION %in% c("LBF90NC", "LFASNC", "LFLINC")) |>
  right_join(QASA_TABLE720R_var$TRANSACTION |>
               select(TRANSACTION = id, TRANSACTION_desc = label),
             by = "TRANSACTION") |>
  filter(obsValue != 0) |>
  arrange(-obsValue) |>
  quarter_to_date() |>
  mutate(obsValue = obsValue / 1000) |>
  select(date, TRANSACTION, TRANSACTION_desc, obsValue) |>
  ggplot() +
  geom_line(aes(x = date, y = obsValue, color = TRANSACTION_desc, linetype = TRANSACTION_desc)) +
  theme_minimal()  +
  scale_color_manual(values = viridis(5)[1:4]) +
  scale_x_date(breaks = as.Date(paste0(seq(1960, 2020, 1), "-01-01")),
               labels = date_format("%Y")) +
  theme(legend.position = c(0.4, 0.9),
        legend.title = element_blank()) +
  xlab("") + ylab("Euros Managed") +
  scale_y_continuous(breaks = seq(0, 4000, 100),
                     labels = dollar_format(suffix = " Bn€", prefix = "", accuracy = 1))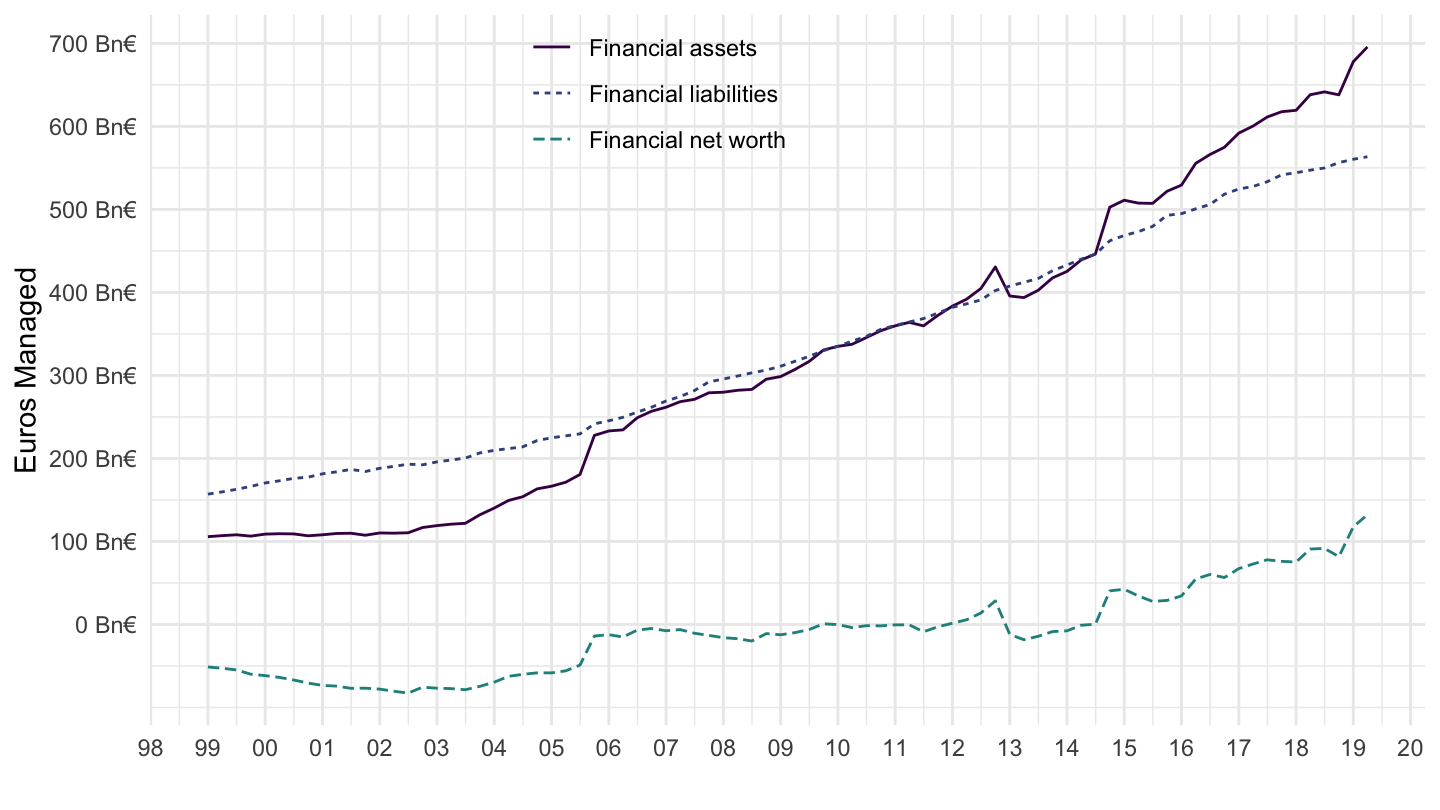
| source | dataset | Title | Updated |
|---|---|---|---|

