Productivity by industry (ISIC Rev.3) - PDBI
Data - OECD
François Geerolf
SUBJECT
PDBI %>%
  left_join(PDBI_var$SUBJECT, by = "SUBJECT") %>%
  group_by(SUBJECT, Subject) %>%
  summarise(nobs = n()) %>%
  arrange(-nobs) %>%
print_table_conditional()| SUBJECT | Subject | nobs |
|---|---|---|
| I3_GVA | Gross value added (GVA) | 4978 |
| I3_TOTK | Total capital input | 4581 |
| I3_HRSTO | Hours worked | 4535 |
| I3_GVAHRS | GVA per hour worked | 4256 |
| I3_LCOST | Share of labour input costs in total costs | 3753 |
| I3_MFP | Multi-factor productivity | 3324 |
MEASURE
PDBI %>%
  left_join(PDBI_var$MEASURE, by = "MEASURE") %>%
  group_by(MEASURE, Measure) %>%
  summarise(nobs = n()) %>%
  arrange(-nobs) %>%
print_table_conditional()| MEASURE | Measure | nobs |
|---|---|---|
| GRW | Annual growth/change, in % | 21674 |
| PCT | Annual share, in % | 3753 |
ACTIVITY
PDBI %>%
  left_join(PDBI_var$ACTIVITY, by = "ACTIVITY") %>%
  group_by(ACTIVITY, Activity) %>%
  summarise(nobs = n()) %>%
  arrange(-nobs) %>%
print_table_conditional()| ACTIVITY | Activity | nobs |
|---|---|---|
| C01T05 | Agriculture, hunting, forestry and fishing | 2006 |
| C45 | Construction | 2006 |
| C15T37 | Manufacturing | 1991 |
| C10T41 | Industry including energy | 1959 |
| C40T41 | Electricity, gas and water supply | 1945 |
| C50T55 | Wholesale and retail trade, restaurants and hotels | 1937 |
| C50T52 | Wholesale and retail trade, repairs | 1845 |
| C55 | Hotel and restaurants | 1845 |
| C10T14 | Mining and quarrying | 1697 |
| C65T74X | Finance, insurance and business services | 1695 |
| CTOTALX | Total, excluding real estate | 1669 |
| C34T35 | Transport equipment | 1647 |
| C50T74X | Business sector services excluding real estate | 1632 |
| C29T33 | Machinery and equipment | 1553 |
LOCATION
PDBI %>%
  left_join(PDBI_var$LOCATION, by = "LOCATION") %>%
  group_by(LOCATION, Location) %>%
  summarise(Nobs = n()) %>%
  arrange(-Nobs) %>%
  mutate(Flag = gsub(" ", "-", str_to_lower(gsub(" ", "-", Location))),
         Flag = paste0('<img src="../../icon/flag/vsmall/', Flag, '.png" alt="Flag">')) %>%
  select(Flag, everything()) %>%
  {if (is_html_output()) datatable(., filter = 'top', rownames = F, escape = F) else .}
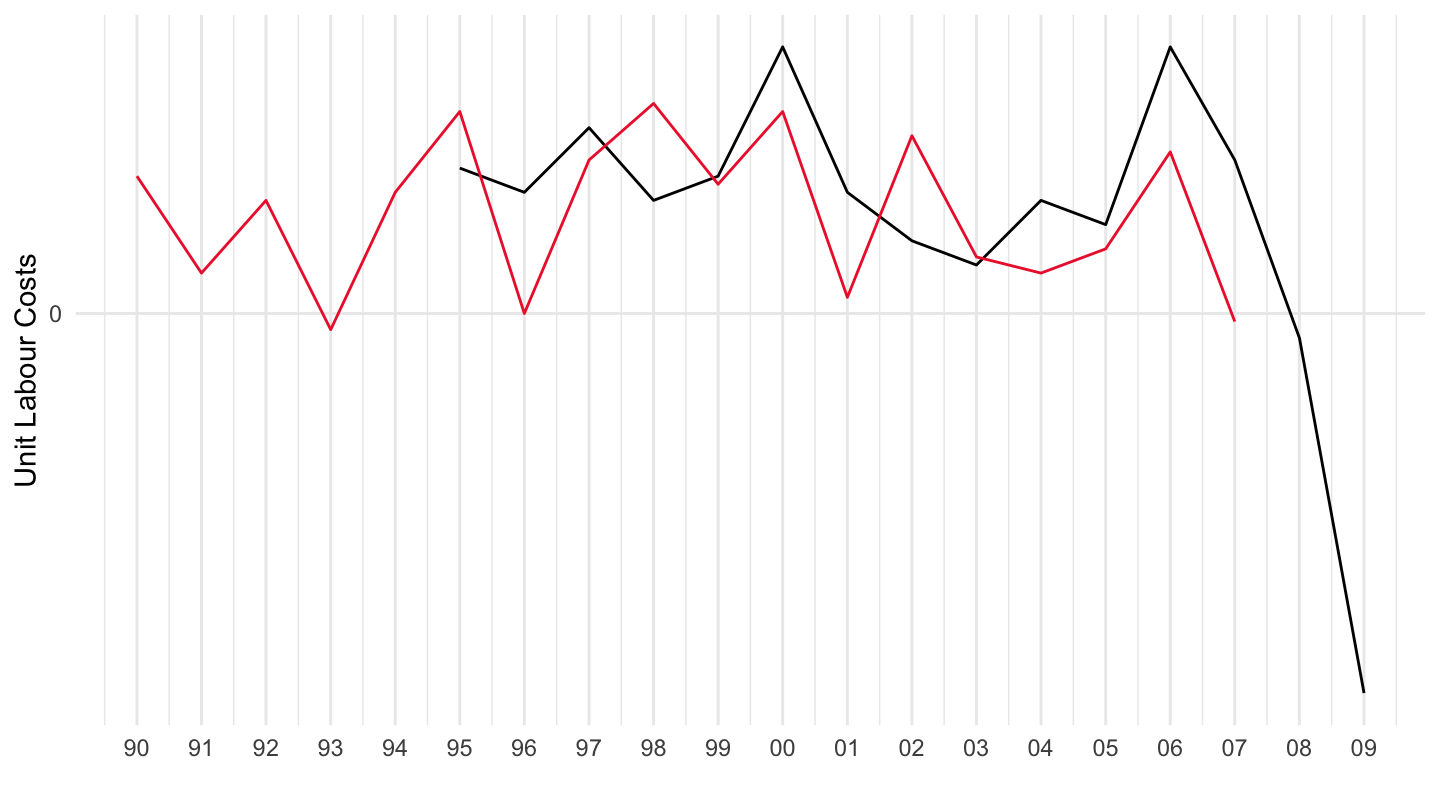
Unit Labour Costs
Table
PDBI %>%
  left_join(PDBI_var$LOCATION, by = "LOCATION") %>%
  filter(SUBJECT == "I3_MFP",
         ACTIVITY == "CTOTALX") %>%
  year_to_date() %>%
  group_by(LOCATION, Location) %>%
  summarise(Nobs = n(),
            date1 = first(date),
            date2 = last(date)) %>%
  arrange(-Nobs) %>%
  mutate(Flag = gsub(" ", "-", str_to_lower(gsub(" ", "-", Location))),
         Flag = paste0('<img src="../../icon/flag/vsmall/', Flag, '.png" alt="Flag">')) %>%
  select(Flag, everything()) %>%
  {if (is_html_output()) datatable(., filter = 'top', rownames = F, escape = F) else .}
France, Germany
All
PDBI %>%
  filter(SUBJECT == "I3_MFP",
         ACTIVITY == "CTOTALX",
         LOCATION %in% c("FRA", "DEU", "ITA")) %>%
  left_join(PDBI_var$LOCATION, by = "LOCATION") %>%
  left_join(colors, by = c("Location" = "country")) %>%
  year_to_date %>%
  arrange(Location) %>%
  ggplot(.) + geom_line(aes(x = date, y = obsValue, color = color)) +
  scale_color_identity() + add_3flags + theme_minimal() +
  scale_x_date(breaks = seq(1920, 2025, 1) %>% paste0("-01-01") %>% as.Date,
               labels = date_format("%y")) +
  scale_y_continuous(breaks = seq(0, 200, 10)) +
  ylab("Unit Labour Costs") + xlab("")