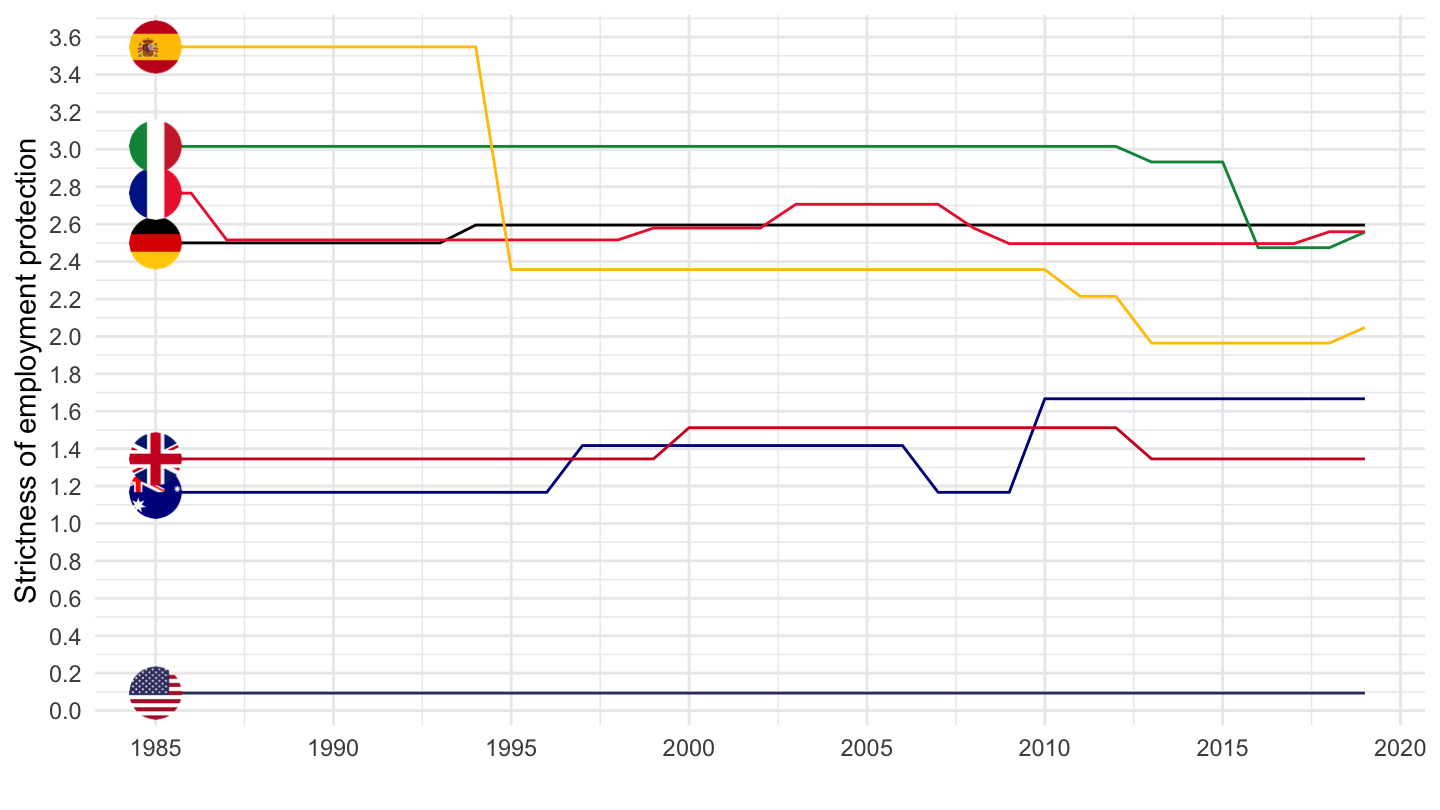
Last observation: 2019 (N = 129)
First observation: 1985 (N = 20)
Last data update: 02 août 2026, 08:59
Last compile: 16 oct. 2026, 01:15
EPL_R |>
  filter(SERIES == "EPR_V1",
         COUNTRY %in% c("FRA", "ITA", "DEU")) |>
  left_join(EPL_R_var$COUNTRY, by = "COUNTRY") |>
  year_to_date() |>
  add_flag_color("Country") |>
  rename(Location = Country) |>
  ggplot() + geom_line(aes(x = date, y = obsValue, color = color)) +
  scale_color_identity() + add_3flags + theme_minimal() +
  xlab("") + ylab("Strictness of employment protection") +
  scale_x_date(breaks = seq(1920, 2100, 2) |> paste0("-01-01") |> as.Date(),
               labels = date_format("%Y")) +
  scale_y_continuous(breaks = seq(0, 6, .1))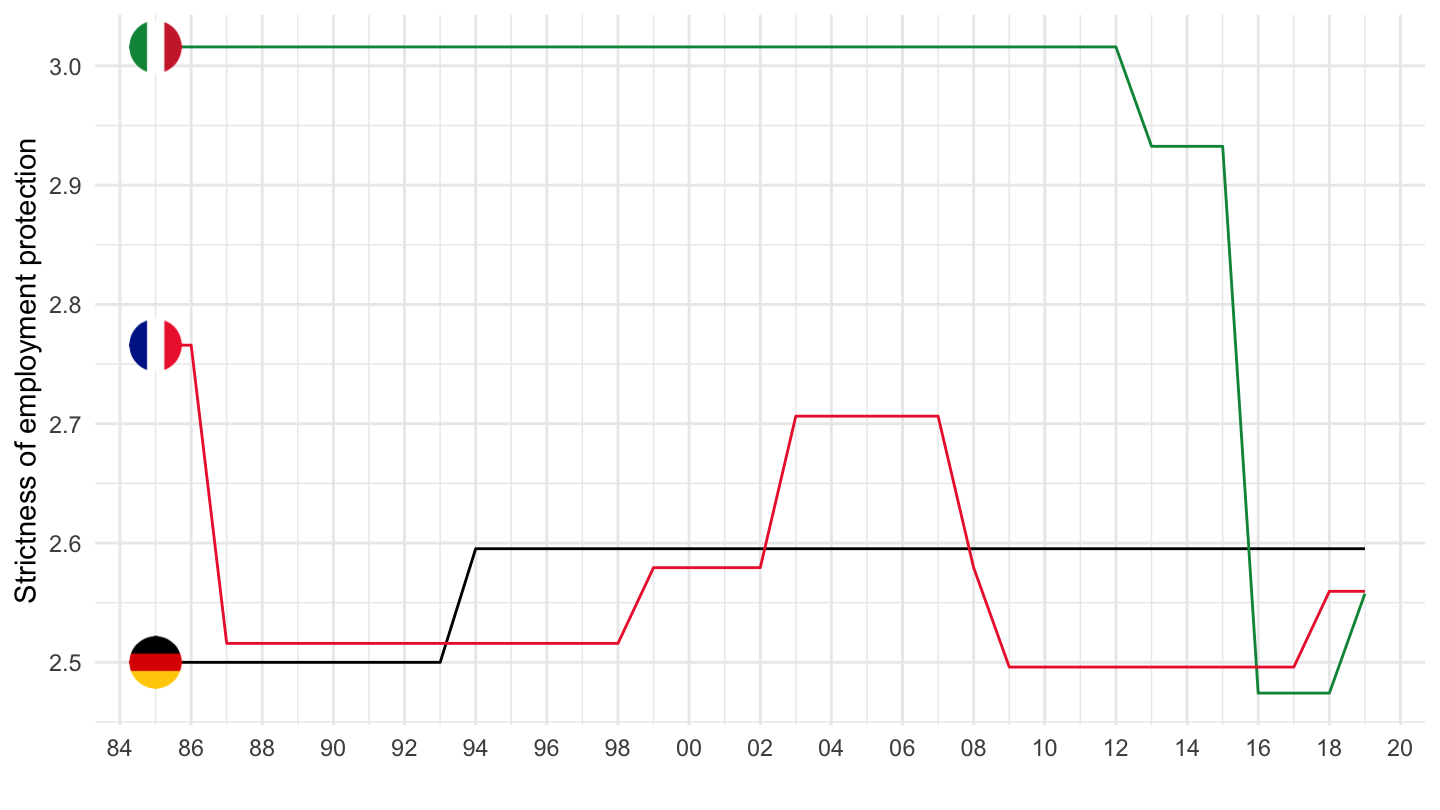
EPL_R |>
  filter(SERIES == "EPR_V1",
         COUNTRY %in% c("AUS", "GBR", "USA")) |>
  left_join(EPL_R_var$COUNTRY, by = "COUNTRY") |>
  year_to_date() |>
  add_flag_color("Country") |>
  rename(Location = Country) |>
  ggplot() + geom_line(aes(x = date, y = obsValue, color = color)) +
  scale_color_identity() + add_3flags + theme_minimal() +
  xlab("") + ylab("Strictness of employment protection") +
  scale_x_date(breaks = seq(1920, 2100, 2) |> paste0("-01-01") |> as.Date(),
               labels = date_format("%Y")) +
  scale_y_continuous(breaks = seq(0, 5, 0.2))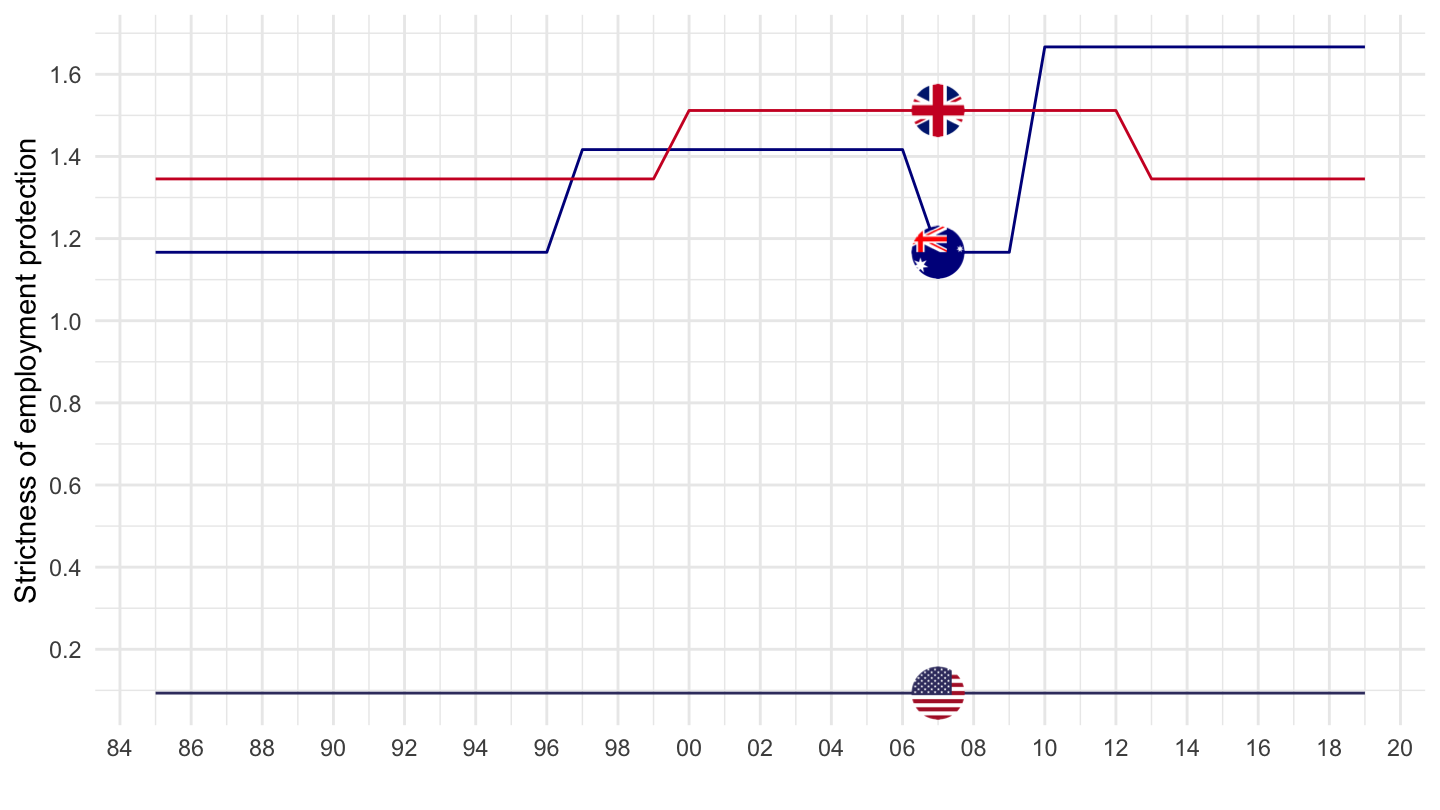
EPL_R |>
  filter(SERIES == "EPR_V1",
         COUNTRY %in% c("AUS", "GBR", "USA", "FRA", "ITA", "DEU", "ESP")) |>
  left_join(EPL_R_var$COUNTRY, by = "COUNTRY") |>
  year_to_date() |>
  add_flag_color("Country") |>
  rename(Location = Country) |>
  ggplot() + geom_line(aes(x = date, y = obsValue, color = color)) +
  scale_color_identity() + add_7flags + theme_minimal() +
  xlab("") + ylab("Strictness of employment protection") +
  scale_x_date(breaks = seq(1920, 2100, 5) |> paste0("-01-01") |> as.Date(),
               labels = date_format("%Y")) +
  scale_y_continuous(breaks = seq(0, 5, 0.2))