Last observation: 2019 (N = 86)
First observation: 1998 (N = 28)
Last data update: 02 août 2026, 08:59
Last compile: 09 oct. 2026, 23:09
EPL_CD_var |>
  pluck("VAR_DESC") %>%
{if (is_html_output()) print_table(.) else .}| id | description |
|---|---|
| COUNTRY | Country |
| TIME | Time |
| OBS_VALUE | Observation Value |
| TIME_FORMAT | Time Format |
| OBS_STATUS | Observation Status |
| UNIT | Unit |
| POWERCODE | Unit multiplier |
| REFERENCEPERIOD | Reference period |
EPL_CD |>
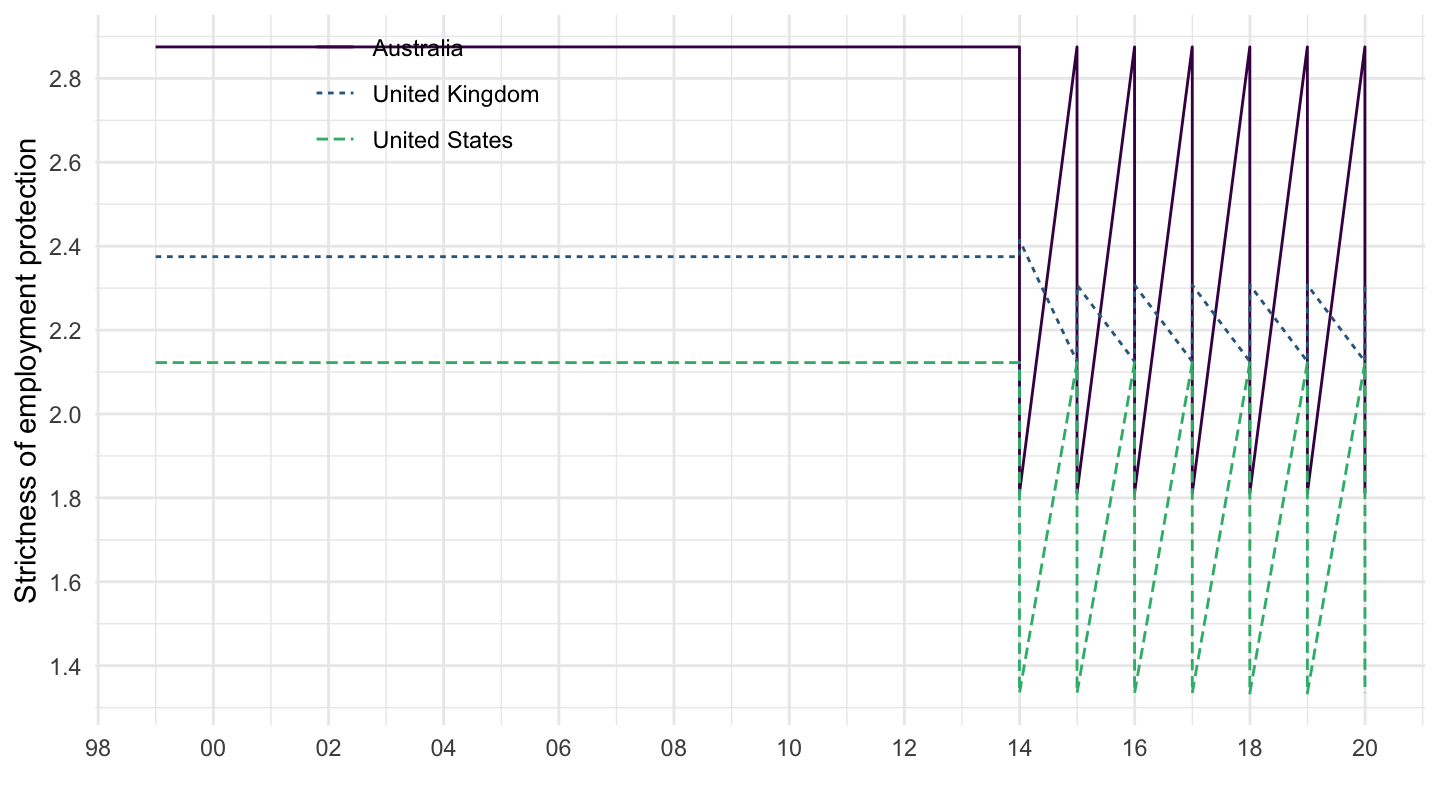
  filter(COUNTRY %in% c("FRA", "ITA", "DEU")) |>
  left_join(EPL_CD_var$COUNTRY |>
              setNames(c("COUNTRY", "COUNTRY desc")), by = "COUNTRY") |>
  year_to_enddate() |>
  ggplot() + theme_minimal() +
  geom_line(aes(x = date, y = obsValue, color = `COUNTRY desc`, linetype = `COUNTRY desc`)) +
  scale_color_manual(values = viridis(4)[1:3]) +
  theme(legend.position = c(0.85, 0.9),
        legend.title = element_blank()) +
  xlab("") + ylab("Strictness of employment protection") +
  scale_x_date(breaks = seq(1920, 2100, 2) |> paste0("-01-01") |> as.Date(),
               labels = date_format("%Y")) +
  theme(legend.position = c(0.85, 0.9),
        legend.title = element_blank()) +
  scale_y_continuous(breaks = seq(0, 6, 1),
                     limits = c(0, 6))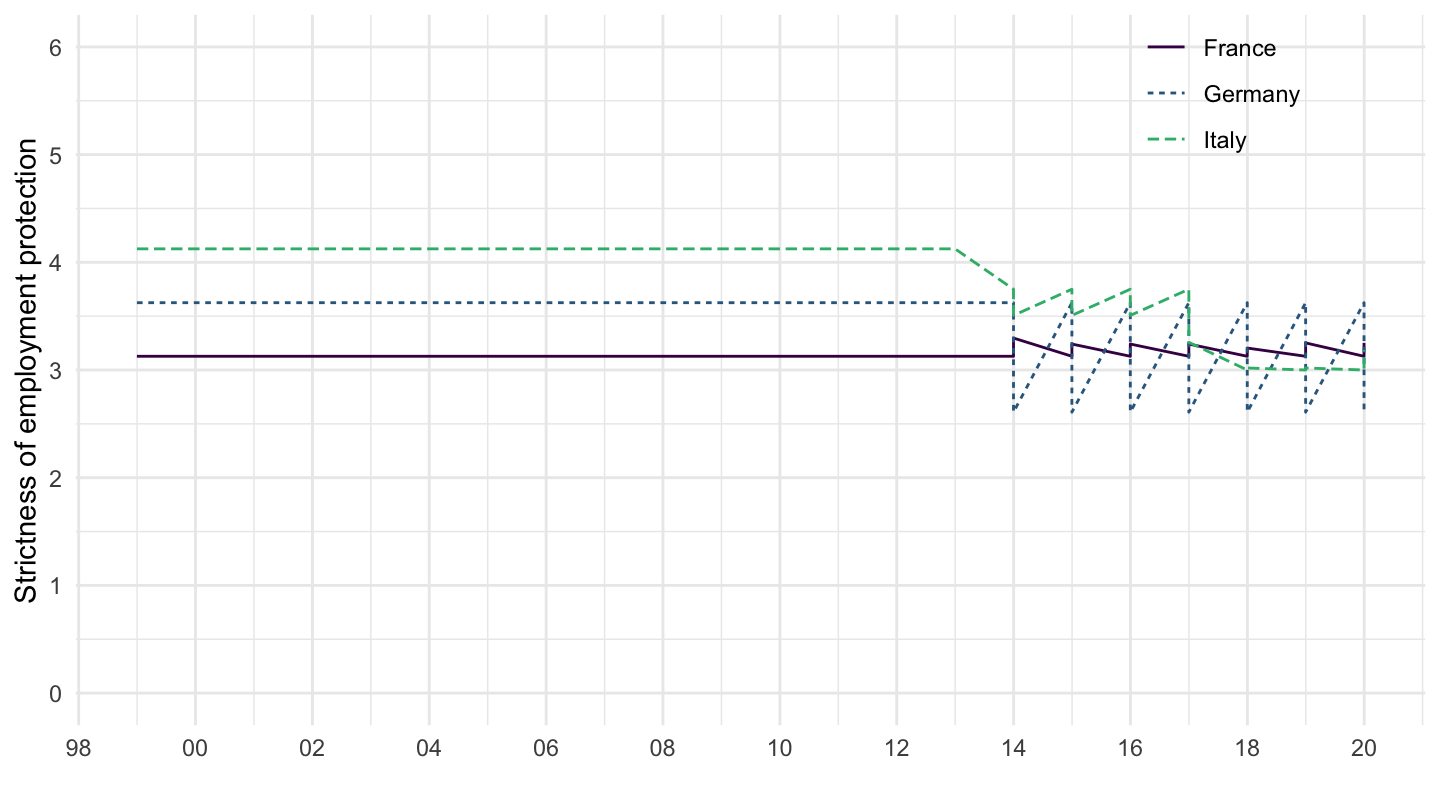
EPL_CD |>
  filter(COUNTRY %in% c("AUS", "GBR", "USA")) |>
  left_join(EPL_CD_var$COUNTRY |>
              setNames(c("COUNTRY", "COUNTRY desc")), by = "COUNTRY") |>
  year_to_enddate() |>
  ggplot() + theme_minimal() +
  geom_line(aes(x = date, y = obsValue, color = `COUNTRY desc`, linetype = `COUNTRY desc`)) +
  scale_color_manual(values = viridis(4)[1:3]) +
  theme(legend.position = c(0.85, 0.9),
        legend.title = element_blank()) +
  xlab("") + ylab("Strictness of employment protection") +
  scale_x_date(breaks = seq(1920, 2100, 2) |> paste0("-01-01") |> as.Date(),
               labels = date_format("%Y")) +
  theme(legend.position = c(0.25, 0.9),
        legend.title = element_blank()) +
  scale_y_continuous(breaks = seq(0, 5, 0.2))