Equilibrium unemployment rate, as a percentage of labour force - NAIRU - EO
Data - OECD
François Geerolf
LOCATION
EO %>%
  left_join(EO_var$LOCATION, by = "LOCATION") %>%
  group_by(LOCATION, Location) %>%
  summarise(Nobs = n()) %>%
  arrange(-Nobs) %>%
  mutate(Flag = gsub(" ", "-", str_to_lower(Location)),
         Flag = paste0('<img src="../../icon/flag/vsmall/', Flag, '.png" alt="Flag">')) %>%
  select(Flag, everything()) %>%
  {if (is_html_output()) datatable(., filter = 'top', rownames = F, escape = F) else .}
France, Germany, Italy
All
EO %>%
  filter(LOCATION %in% c("FRA", "DEU", "ITA")) %>%
  left_join(EO_var$LOCATION, by = "LOCATION") %>%
  year_to_date %>%
  ggplot() + theme_minimal() + ylab("NAIRU, OECD (% of GDP)") + xlab("") +
  geom_line(aes(x = date, y = obsValue/100, color = Location)) +
  geom_image(data = . %>%
               filter(date == as.Date("2017-01-01")) %>%
               mutate(image = paste0("../../icon/flag/", str_to_lower(gsub(" ", "-", Location)), ".png")),
             aes(x = date, y = obsValue/100, image = image), asp = 1.5) +
  scale_color_manual(values = c("#0055a4", "#000000", "#008c45")) +
  scale_x_date(breaks = seq(1920, 2025, 5) %>% paste0("-01-01") %>% as.Date,
               labels = date_format("%y")) +
  theme(legend.position = c(0.15, 0.2),
        legend.title = element_blank()) +
  scale_y_continuous(breaks = 0.01*seq(-7, 60, 1),
                     labels = scales::percent_format(accuracy = 1))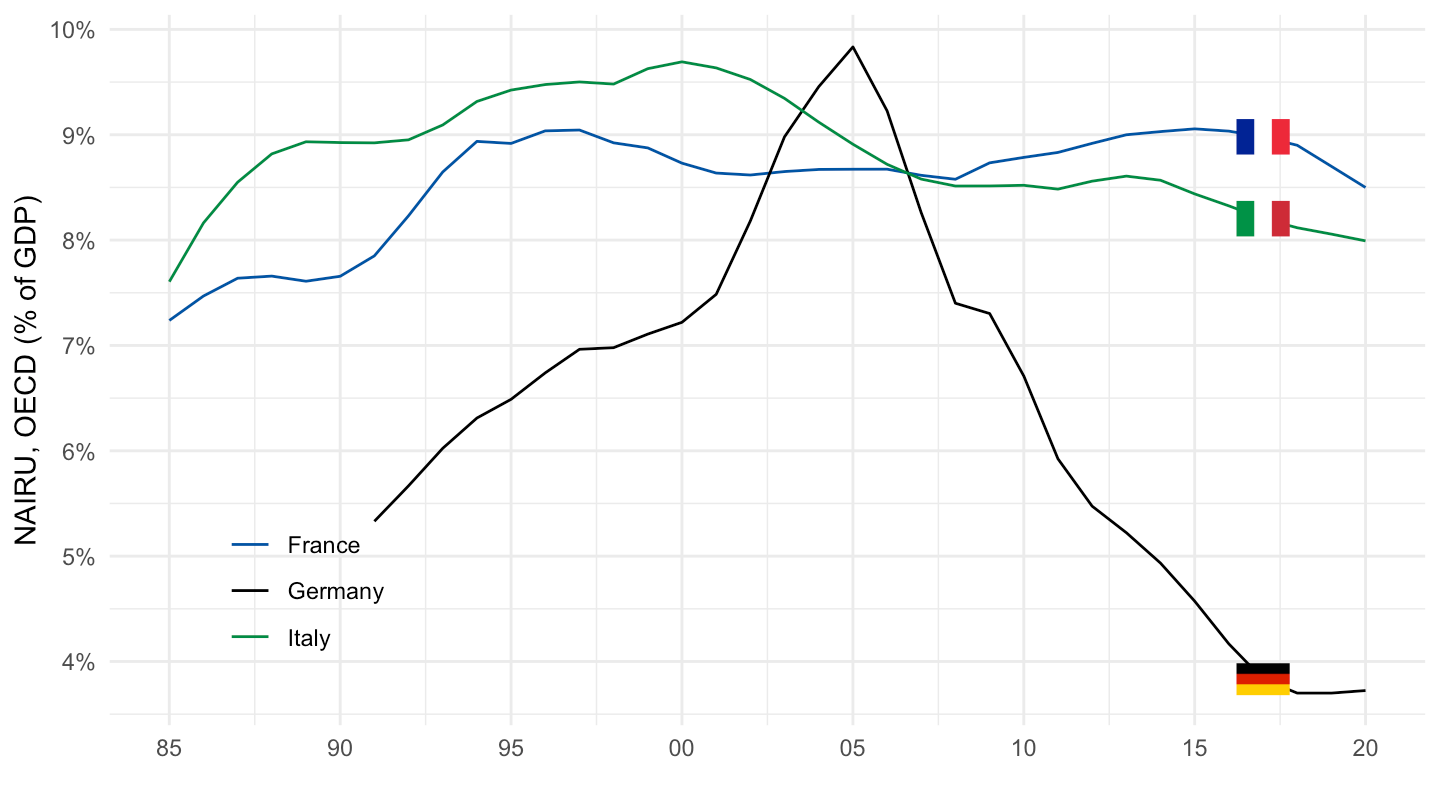
1995-
EO %>%
  filter(LOCATION %in% c("FRA", "DEU", "ITA")) %>%
  left_join(EO_var$LOCATION, by = "LOCATION") %>%
  year_to_date %>%
  filter(date >= as.Date("1995-01-01")) %>%
  ggplot() + theme_minimal() + ylab("NAIRU, OECD (% of GDP)") + xlab("") +
  geom_line(aes(x = date, y = obsValue/100, color = Location)) +
  geom_image(data = . %>%
               filter(date == as.Date("2017-01-01")) %>%
               mutate(image = paste0("../../icon/flag/", str_to_lower(gsub(" ", "-", Location)), ".png")),
             aes(x = date, y = obsValue/100, image = image), asp = 1.5) +
  scale_color_manual(values = c("#0055a4", "#000000", "#008c45")) +
  scale_x_date(breaks = seq(1920, 2025, 5) %>% paste0("-01-01") %>% as.Date,
               labels = date_format("%y")) +
  theme(legend.position = c(0.15, 0.2),
        legend.title = element_blank()) +
  scale_y_continuous(breaks = 0.01*seq(-7, 60, 1),
                     labels = scales::percent_format(accuracy = 1))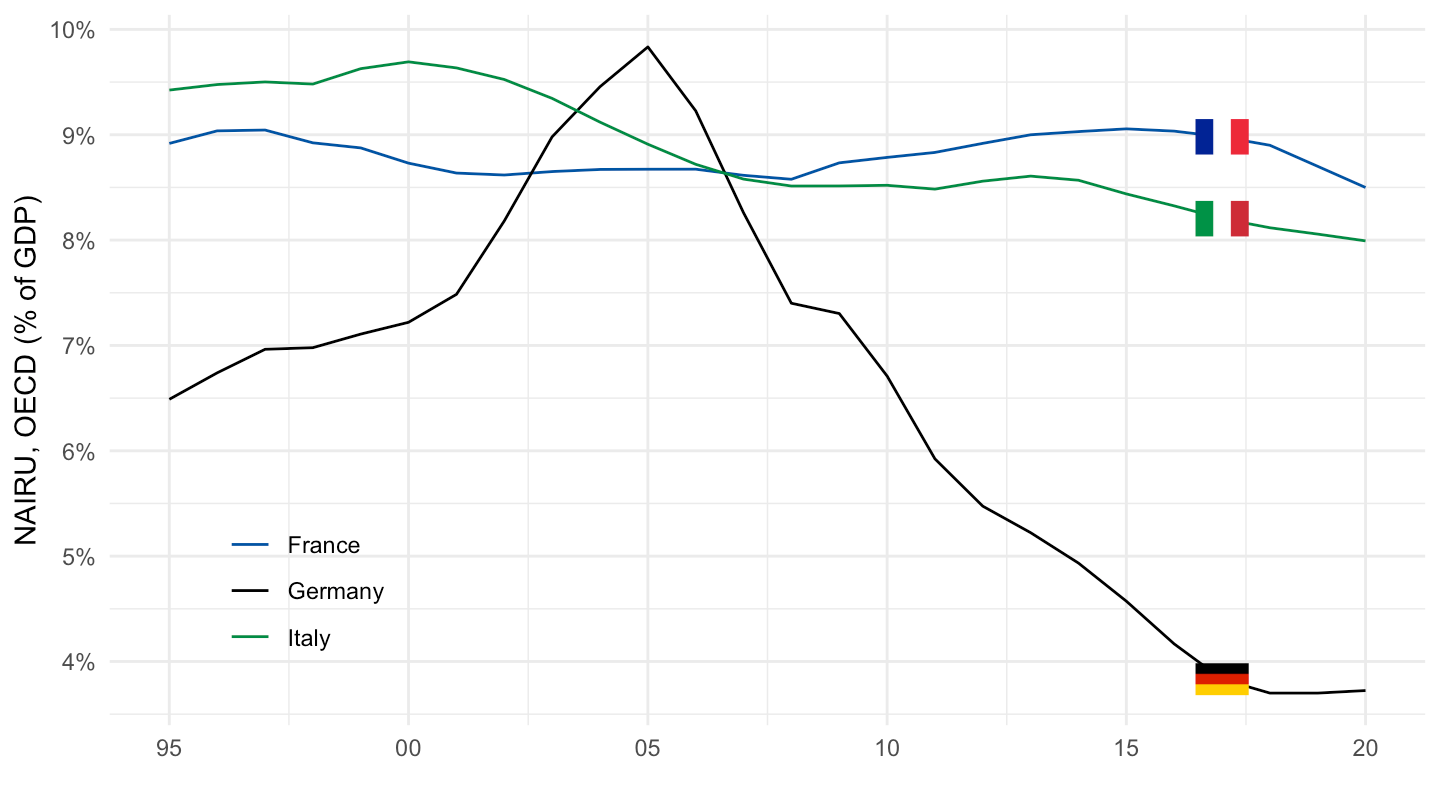
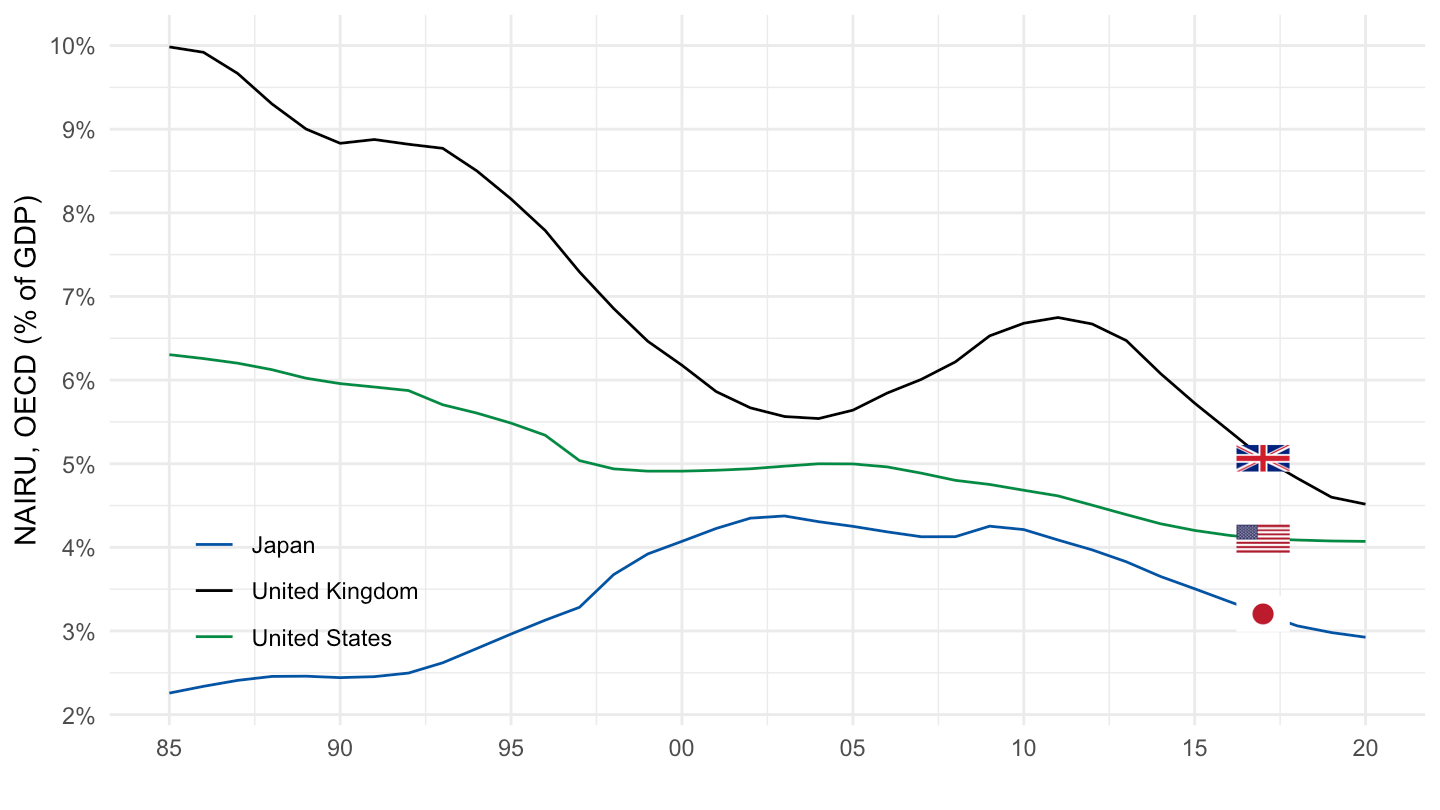
United States, United Kingdom, Japan
All
EO %>%
  filter(LOCATION %in% c("USA", "GBR", "JPN")) %>%
  left_join(EO_var$LOCATION, by = "LOCATION") %>%
  year_to_date %>%
  ggplot() + theme_minimal() + ylab("NAIRU, OECD (% of GDP)") + xlab("") +
  geom_line(aes(x = date, y = obsValue/100, color = Location)) +
  geom_image(data = . %>%
               filter(date == as.Date("2017-01-01")) %>%
               mutate(image = paste0("../../icon/flag/", str_to_lower(gsub(" ", "-", Location)), ".png")),
             aes(x = date, y = obsValue/100, image = image), asp = 1.5) +
  scale_color_manual(values = c("#0055a4", "#000000", "#008c45")) +
  scale_x_date(breaks = seq(1920, 2025, 5) %>% paste0("-01-01") %>% as.Date,
               labels = date_format("%y")) +
  theme(legend.position = c(0.15, 0.2),
        legend.title = element_blank()) +
  scale_y_continuous(breaks = 0.01*seq(-7, 60, 1),
                     labels = scales::percent_format(accuracy = 1))