Code
load_data("oecd/DUR_I_var.RData")
DUR_I <- read_parquet("DUR_I.parquet")load_data("oecd/DUR_I_var.RData")
DUR_I <- read_parquet("DUR_I.parquet")DUR_I |>
left_join(DUR_I_var |> pluck("DURATION"), by = c("DURATION" = "id")) |>
rename(`DURATION Description` = label) |>
group_by(DURATION, `DURATION Description`, SEX, AGE) |>
summarise(Nobs = n()) |>
arrange(-Nobs) %>%
{if (is_html_output()) datatable(., filter = 'top', rownames = F) else .}DUR_I_var |>
pluck("VAR_DESC") %>%
{if (is_html_output()) print_table(.) else .}| id | description |
|---|---|
| COUNTRY | Country |
| TIME | Time |
| SEX | Sex |
| AGE | Age |
| DURATION | Duration |
| FREQUENCY | Frequency |
| OBS_VALUE | Observation Value |
| TIME_FORMAT | Time Format |
| OBS_STATUS | Observation Status |
| UNIT | Unit |
| POWERCODE | Unit multiplier |
| REFERENCEPERIOD | Reference period |
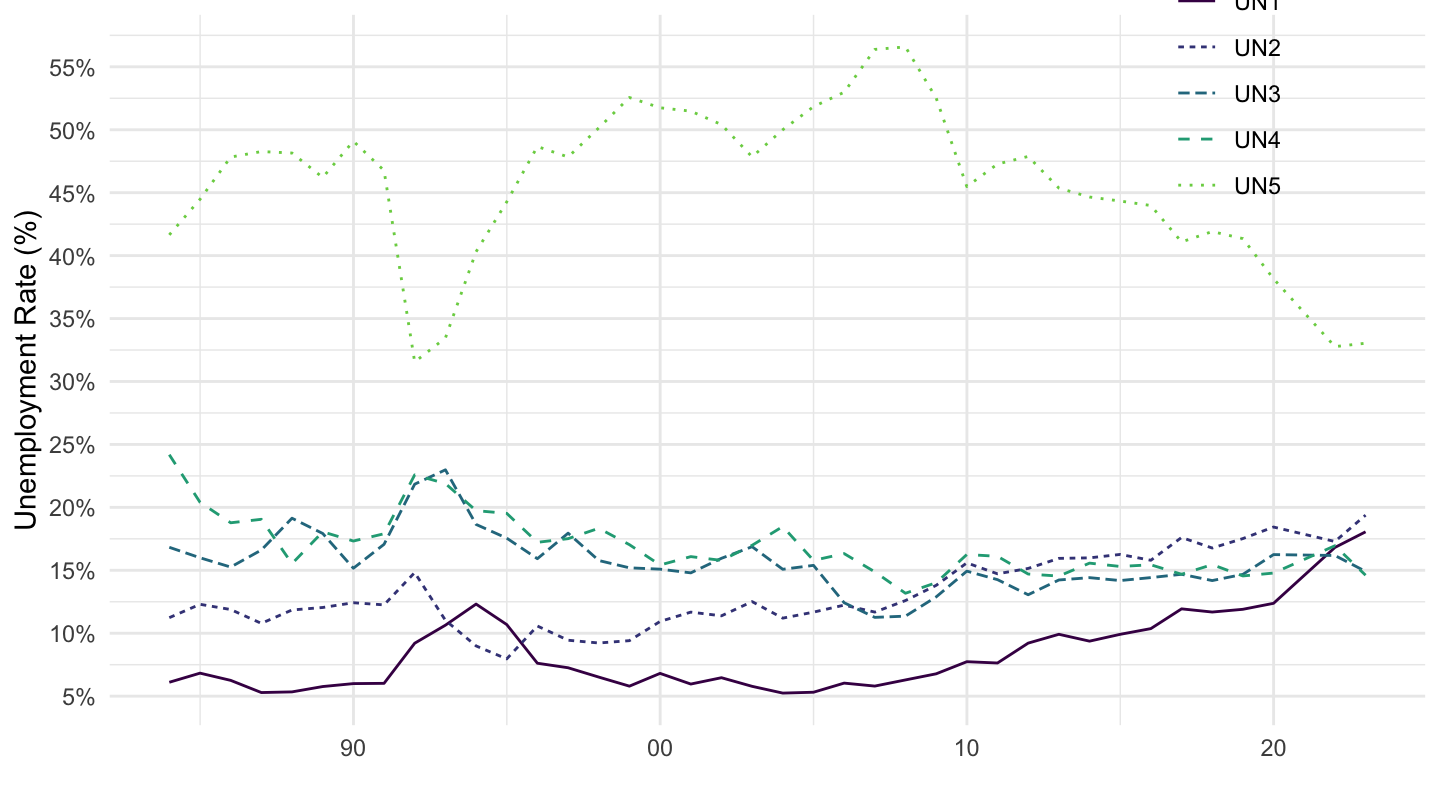
DUR_I |>
  filter(AGE == "900000",
         SEX == "MW",
         COUNTRY == "FRA") |>
  year_to_enddate() |>
  ggplot() + theme_minimal() +
  geom_line(aes(x = date, y = obsValue/100, color = DURATION, linetype = DURATION)) +
  scale_color_manual(values = viridis(6)[1:5]) +
  theme(legend.position = c(0.85, 0.9),
        legend.title = element_blank()) +
  xlab("") + ylab("Unemployment Rate (%)") +
  scale_x_date(breaks = seq(1920, 2100, 10) |> paste0("-01-01") |> as.Date(),
               labels = date_format("%Y")) +
  theme(legend.position = c(0.85, 0.9),
        legend.title = element_blank()) +
  scale_y_continuous(breaks = 0.01*seq(-10, 100, 5),
                     labels = scales::percent_format(accuracy = 1))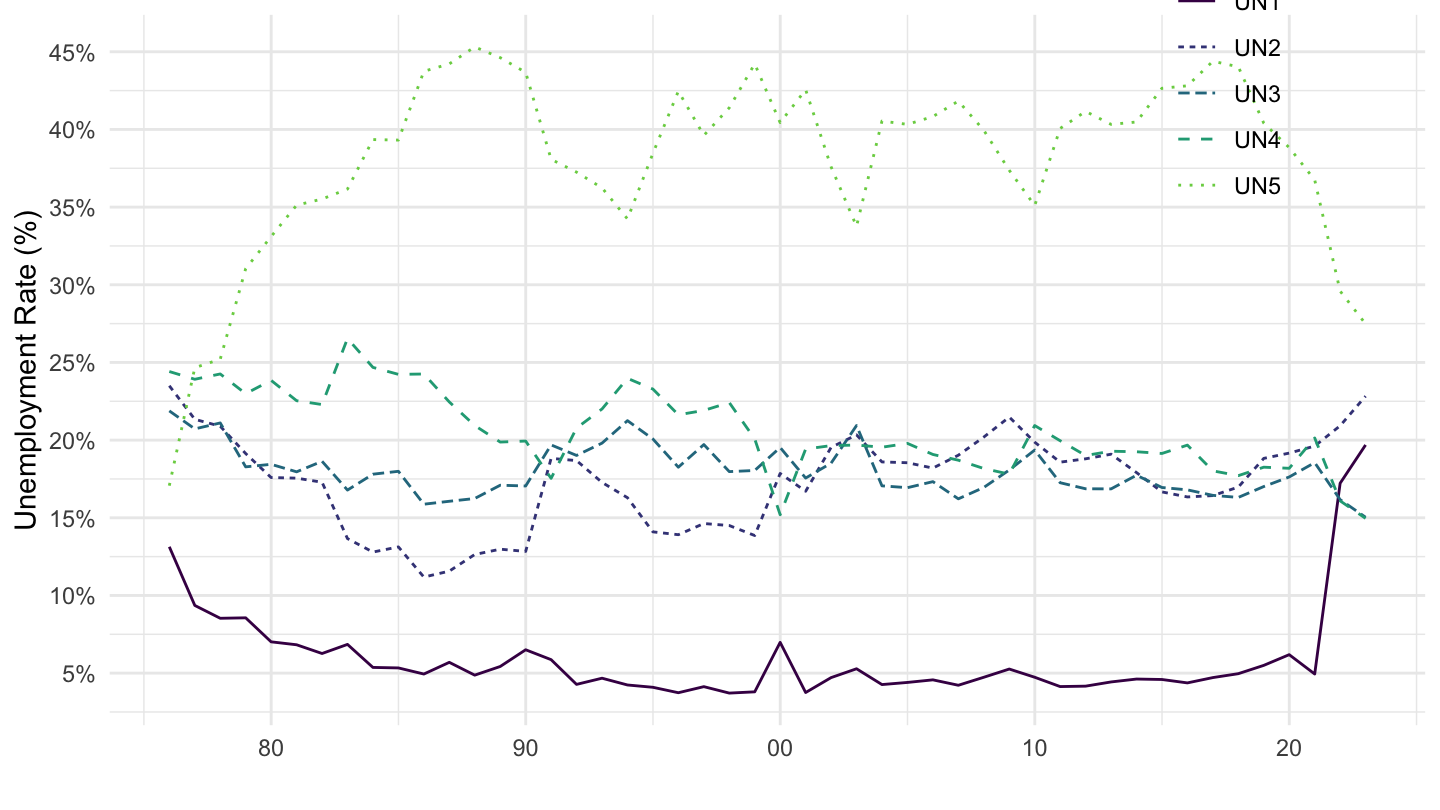
DUR_I |>
  filter(AGE == "900000",
         SEX == "MW",
         COUNTRY == "DEU") |>
  year_to_enddate() |>
  ggplot() + theme_minimal() +
  geom_line(aes(x = date, y = obsValue/100, color = DURATION, linetype = DURATION)) +
  scale_color_manual(values = viridis(6)[1:5]) +
  theme(legend.position = c(0.85, 0.9),
        legend.title = element_blank()) +
  xlab("") + ylab("Unemployment Rate (%)") +
  scale_x_date(breaks = seq(1920, 2100, 10) |> paste0("-01-01") |> as.Date(),
               labels = date_format("%Y")) +
  theme(legend.position = c(0.85, 0.9),
        legend.title = element_blank()) +
  scale_y_continuous(breaks = 0.01*seq(-10, 100, 5),
                     labels = scales::percent_format(accuracy = 1))