Unemployment by duration - DUR_D
Data - OECD
François Geerolf
Nobs - Javascript
DUR_D %>%
  left_join(DUR_D_var %>% pluck("DURATION"), by = c("DURATION" = "id")) %>%
  rename(`DURATION Description` = label) %>%
  group_by(DURATION, `DURATION Description`, SEX, AGE) %>%
  summarise(Nobs = n()) %>%
  arrange(-Nobs) %>%
  {if (is_html_output()) datatable(., filter = 'top', rownames = F) else .}
Data Structure
| id | description |
|---|---|
| COUNTRY | Country |
| TIME | Time |
| SEX | Sex |
| AGE | Age |
| DURATION | Duration |
| FREQUENCY | Frequency |
| OBS_VALUE | Observation Value |
| TIME_FORMAT | Time Format |
| OBS_STATUS | Observation Status |
| UNIT | Unit |
| POWERCODE | Unit multiplier |
| REFERENCEPERIOD | Reference period |
DURATION
DUR_D %>%
  left_join(DUR_D_var %>% pluck("DURATION"), by = c("DURATION" = "id")) %>%
  rename(`DURATION Description` = label) %>%
  group_by(DURATION, `DURATION Description`) %>%
  summarise(Nobs = n()) %>%
  arrange(-Nobs) %>%
{if (is_html_output()) print_table(.) else .}| DURATION | DURATION Description | Nobs |
|---|---|---|
| UN | Total | 35398 |
| UND | Total Declared | 35283 |
| UN5 | 1 year and over | 34381 |
| UN3 | > 3 month and < 6 months | 34156 |
| UN4 | > 6 month and < 1 year | 34118 |
| UN2 | > 1 month and < 3 months | 33867 |
| UN1 | < 1 month | 32231 |
| UNK | Unknown | 17798 |
SEX
DUR_D %>%
  left_join(DUR_D_var %>% pluck("SEX"), by = c("SEX" = "id")) %>%
  rename(`SEX Description` = label) %>%
  group_by(SEX, `SEX Description`) %>%
  summarise(Nobs = n()) %>%
  arrange(-Nobs) %>%
{if (is_html_output()) print_table(.) else .}| SEX | SEX Description | Nobs |
|---|---|---|
| MW | All persons | 86884 |
| MEN | Men | 85807 |
| WOMEN | Women | 84541 |
AGE
DUR_D %>%
  left_join(DUR_D_var %>% pluck("AGE"), by = c("AGE" = "id")) %>%
  rename(`AGE Description` = label) %>%
  group_by(AGE, `AGE Description`) %>%
  summarise(Nobs = n()) %>%
  arrange(-Nobs) %>%
{if (is_html_output()) print_table(.) else .}| AGE | AGE Description | Nobs |
|---|---|---|
| 900000 | Total | 41145 |
| 2554 | 25 to 54 | 39793 |
| 1524 | 15 to 24 | 39631 |
| 5564 | 55 to 64 | 37998 |
| 2024 | 20 to 24 | 35048 |
| 1519 | 15 to 19 | 34841 |
| 6599 | 65+ | 28776 |
All persons, All ages
France
DUR_D %>%
  filter(AGE == "900000",
         SEX == "MW",
         COUNTRY == "FRA") %>%
  year_to_enddate %>%
  left_join(DUR_D_var %>% pluck("DURATION"), by = c("DURATION" = "id")) %>%
  rename(DURATION_desc = label) %>%
  ggplot() + theme_minimal() +
  geom_line(aes(x = date, y = obsValue/1000, color = DURATION_desc, linetype = DURATION_desc)) +
  scale_color_manual(values = viridis(9)[1:8]) +
  theme(legend.position = c(0.85, 0.9),
        legend.title = element_blank()) +
  xlab("") + ylab("Unemployed (Millions)") +
  scale_x_date(breaks = seq(1920, 2025, 5) %>% paste0("-01-01") %>% as.Date,
               labels = date_format("%y")) +
  theme(legend.position = c(0.47, 0.9),
        legend.title = element_blank(),
        legend.direction = "horizontal") +
  scale_y_continuous(breaks = seq(0, 1000, 0.5),
                     limits = c(0, 4))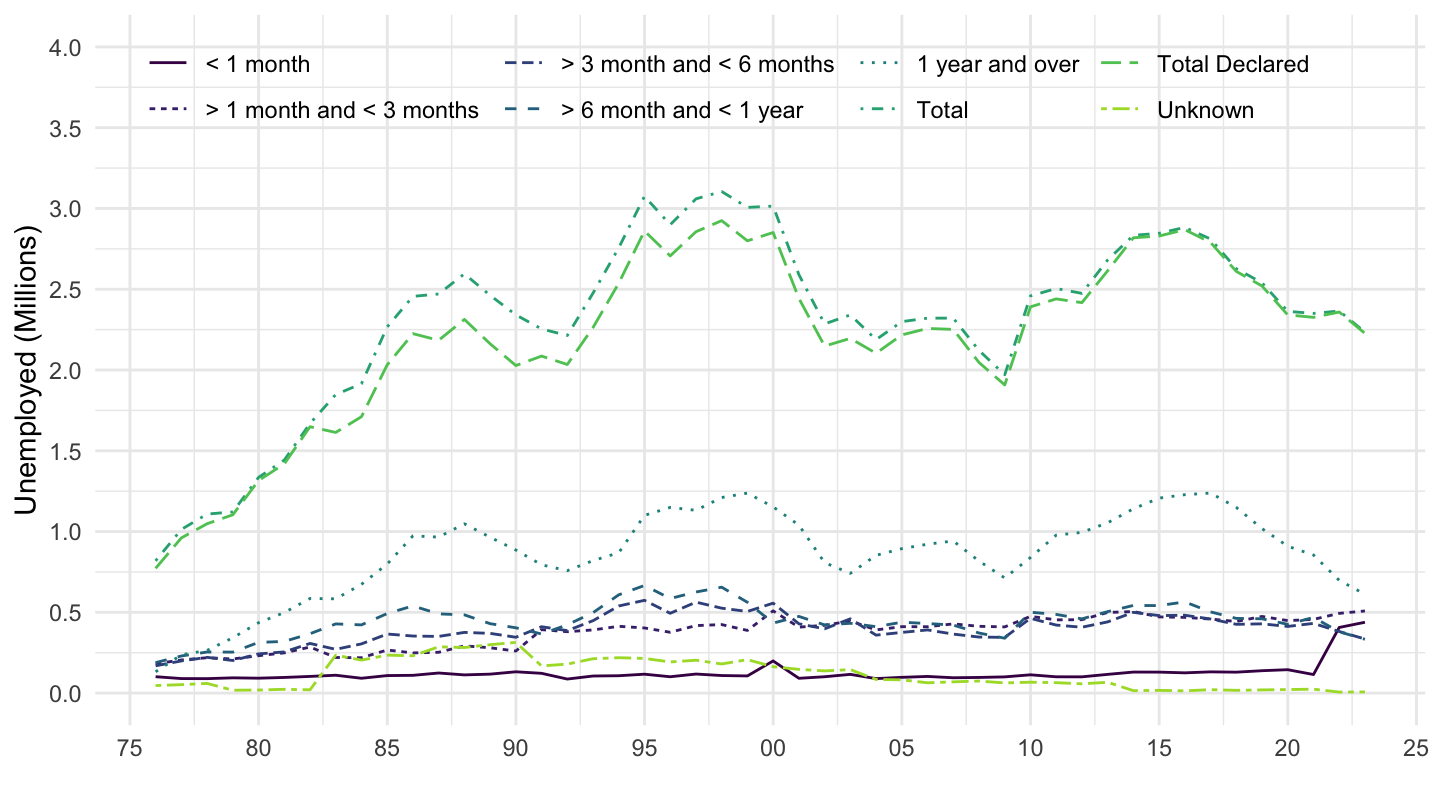
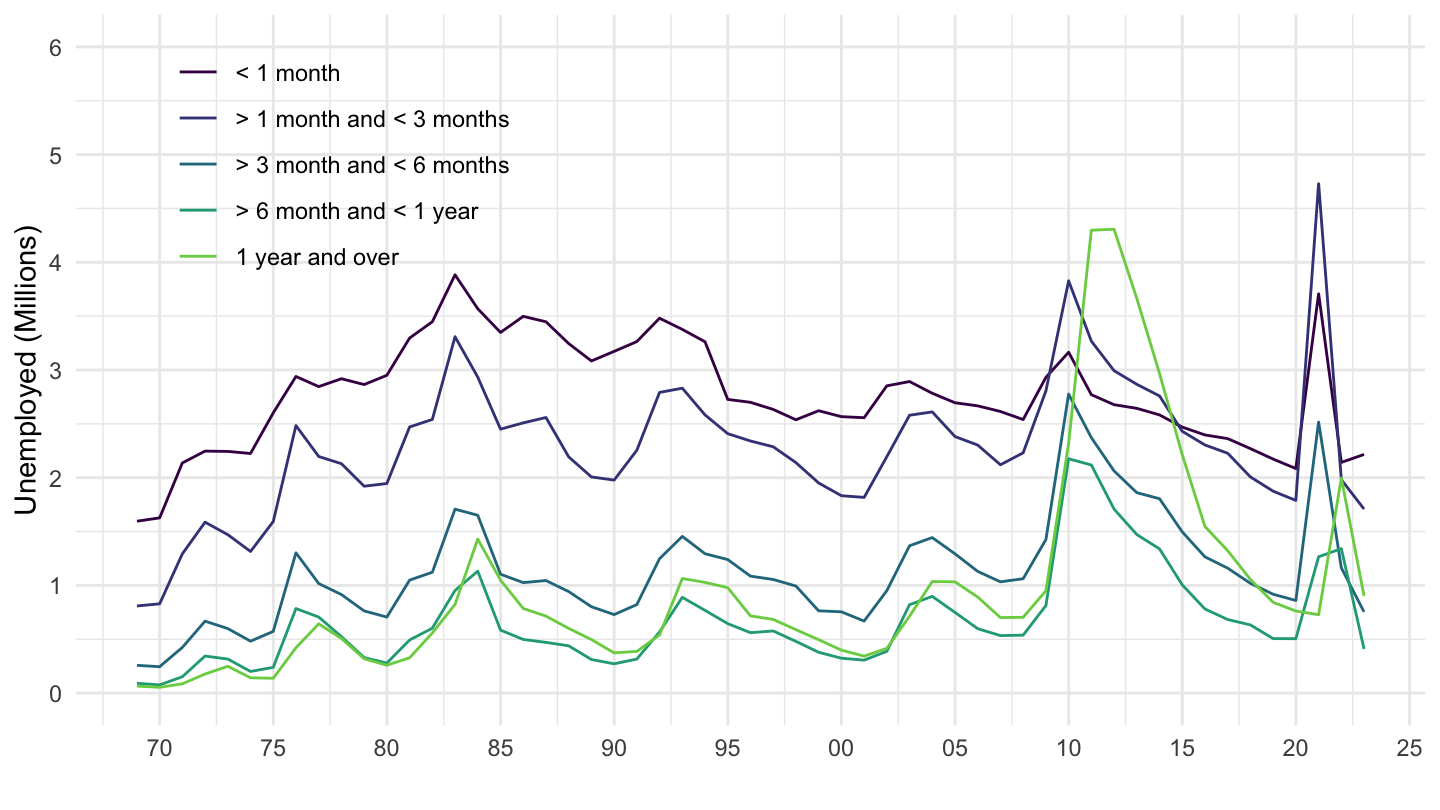
DUR_D %>%
  filter(AGE == "900000",
         SEX == "MW",
         COUNTRY == "FRA",
         DURATION %in% c("UN1", "UN2", "UN3", "UN4", "UN5")) %>%
  year_to_enddate %>%
  left_join(DUR_D_var %>% pluck("DURATION"), by = c("DURATION" = "id")) %>%
  rename(DURATION_desc = label) %>%
  ggplot() + theme_minimal() +
  geom_line(aes(x = date, y = obsValue/1000, color = DURATION_desc)) +
  scale_color_manual(values = viridis(6)[1:5]) +
  theme(legend.position = c(0.85, 0.9),
        legend.title = element_blank()) +
  xlab("") + ylab("Unemployed (Millions)") +
  scale_x_date(breaks = seq(1920, 2025, 5) %>% paste0("-01-01") %>% as.Date,
               labels = date_format("%y")) +
  theme(legend.position = c(0.2, 0.8),
        legend.title = element_blank(),
        legend.direction = "vertical") +
  scale_y_continuous(breaks = seq(0, 1000, 0.5),
                     limits = c(0, 2))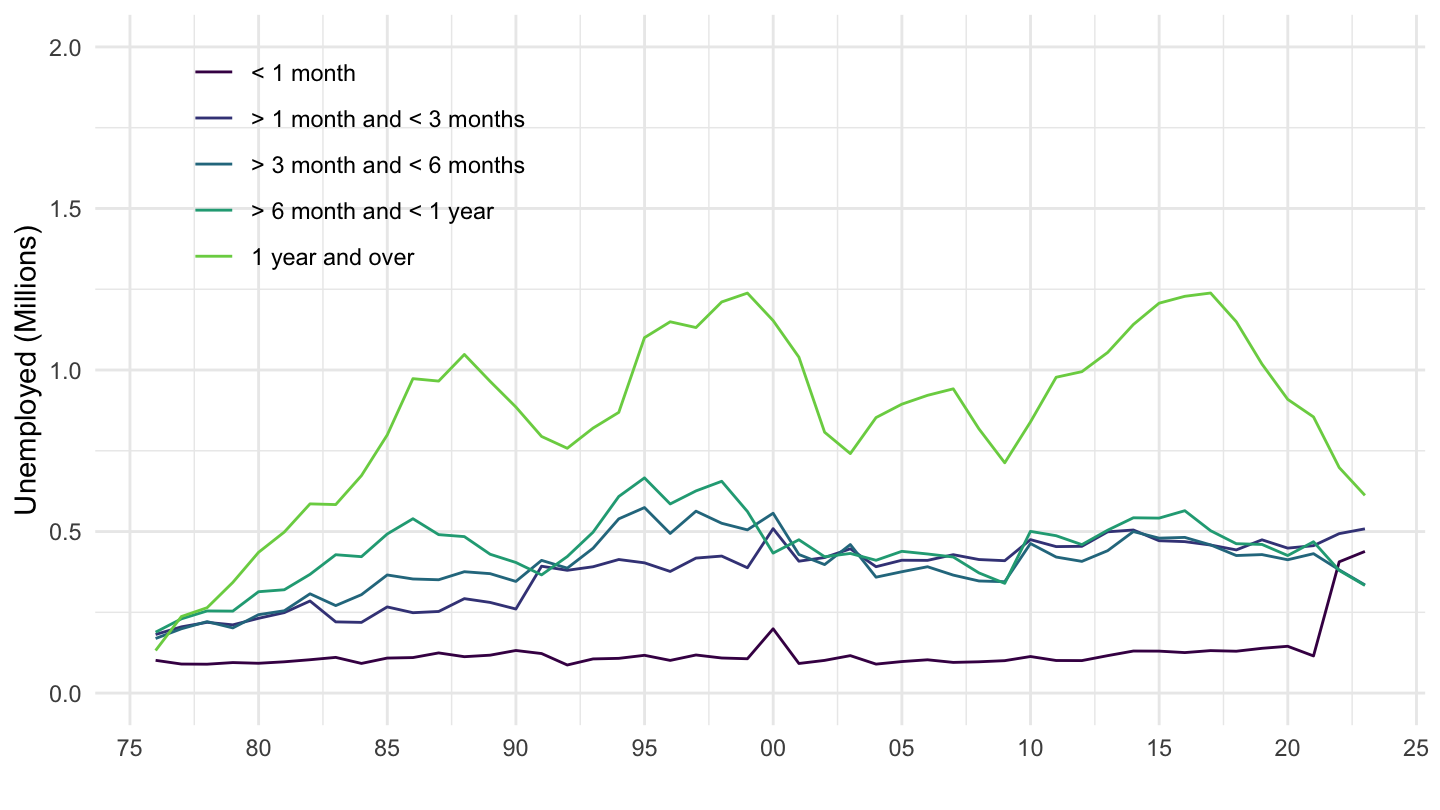
Germany
DUR_D %>%
  filter(AGE == "900000",
         SEX == "MW",
         COUNTRY == "DEU") %>%
  year_to_enddate %>%
  left_join(DUR_D_var %>% pluck("DURATION"), by = c("DURATION" = "id")) %>%
  rename(DURATION_desc = label) %>%
  ggplot() + theme_minimal() +
  geom_line(aes(x = date, y = obsValue/1000, color = DURATION_desc, linetype = DURATION_desc)) +
  scale_color_manual(values = viridis(9)[1:8]) +
  theme(legend.position = c(0.85, 0.9),
        legend.title = element_blank()) +
  xlab("") + ylab("Unemployed (Millions)") +
  scale_x_date(breaks = seq(1920, 2025, 5) %>% paste0("-01-01") %>% as.Date,
               labels = date_format("%y")) +
  theme(legend.position = c(0.47, 0.9),
        legend.title = element_blank(),
        legend.direction = "horizontal") +
  scale_y_continuous(breaks = seq(0, 1000, 0.5),
                     limits = c(0, 6))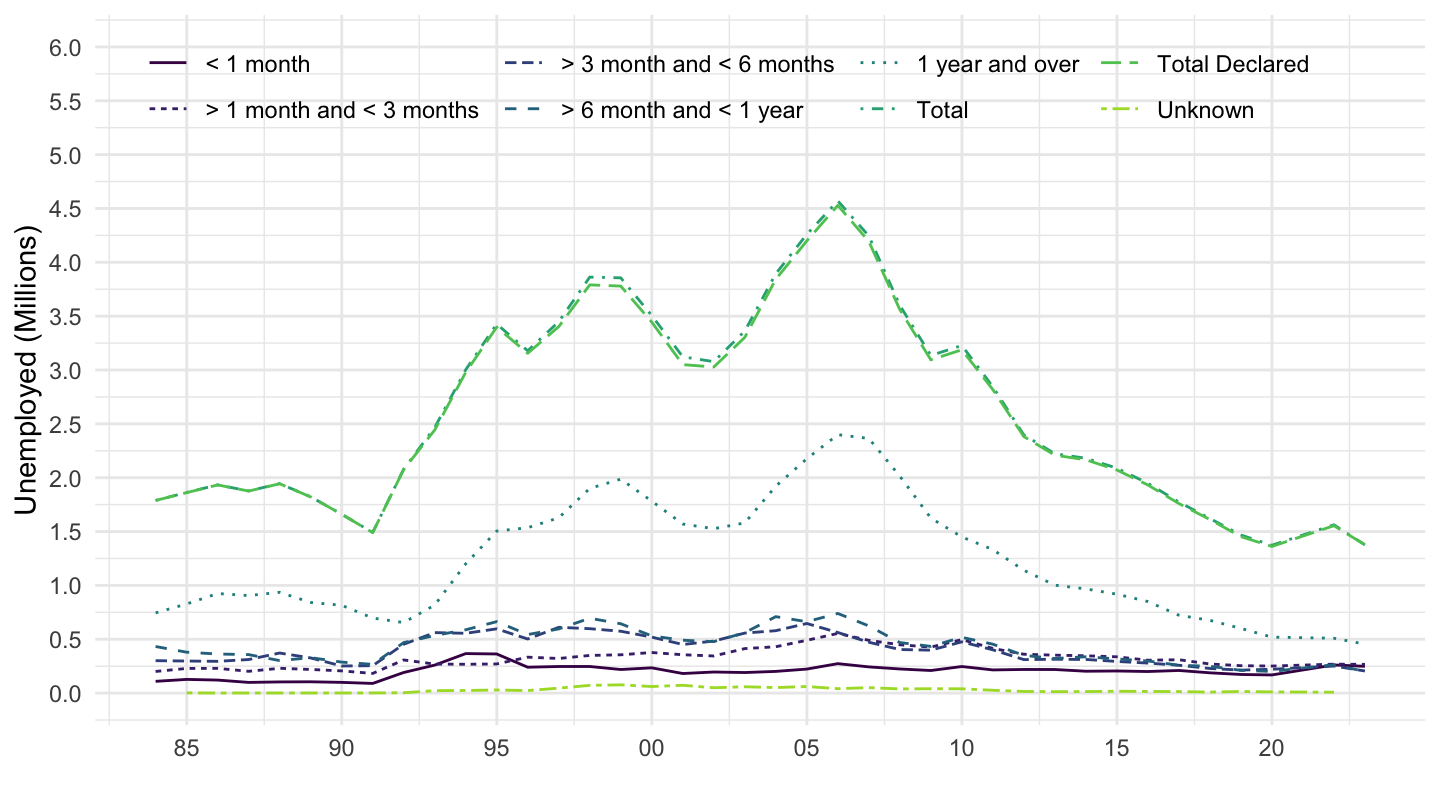
DUR_D %>%
  filter(AGE == "900000",
         SEX == "MW",
         COUNTRY == "DEU",
         DURATION %in% c("UN1", "UN2", "UN3", "UN4", "UN5")) %>%
  year_to_enddate %>%
  left_join(DUR_D_var %>% pluck("DURATION"), by = c("DURATION" = "id")) %>%
  rename(DURATION_desc = label) %>%
  ggplot() + theme_minimal() +
  geom_line(aes(x = date, y = obsValue/1000, color = DURATION_desc)) +
  scale_color_manual(values = viridis(6)[1:5]) +
  theme(legend.position = c(0.85, 0.9),
        legend.title = element_blank()) +
  xlab("") + ylab("Unemployed (Millions)") +
  scale_x_date(breaks = seq(1920, 2025, 5) %>% paste0("-01-01") %>% as.Date,
               labels = date_format("%y")) +
  theme(legend.position = c(0.2, 0.8),
        legend.title = element_blank(),
        legend.direction = "vertical") +
  scale_y_continuous(breaks = seq(0, 1000, 0.5),
                     limits = c(0, 3))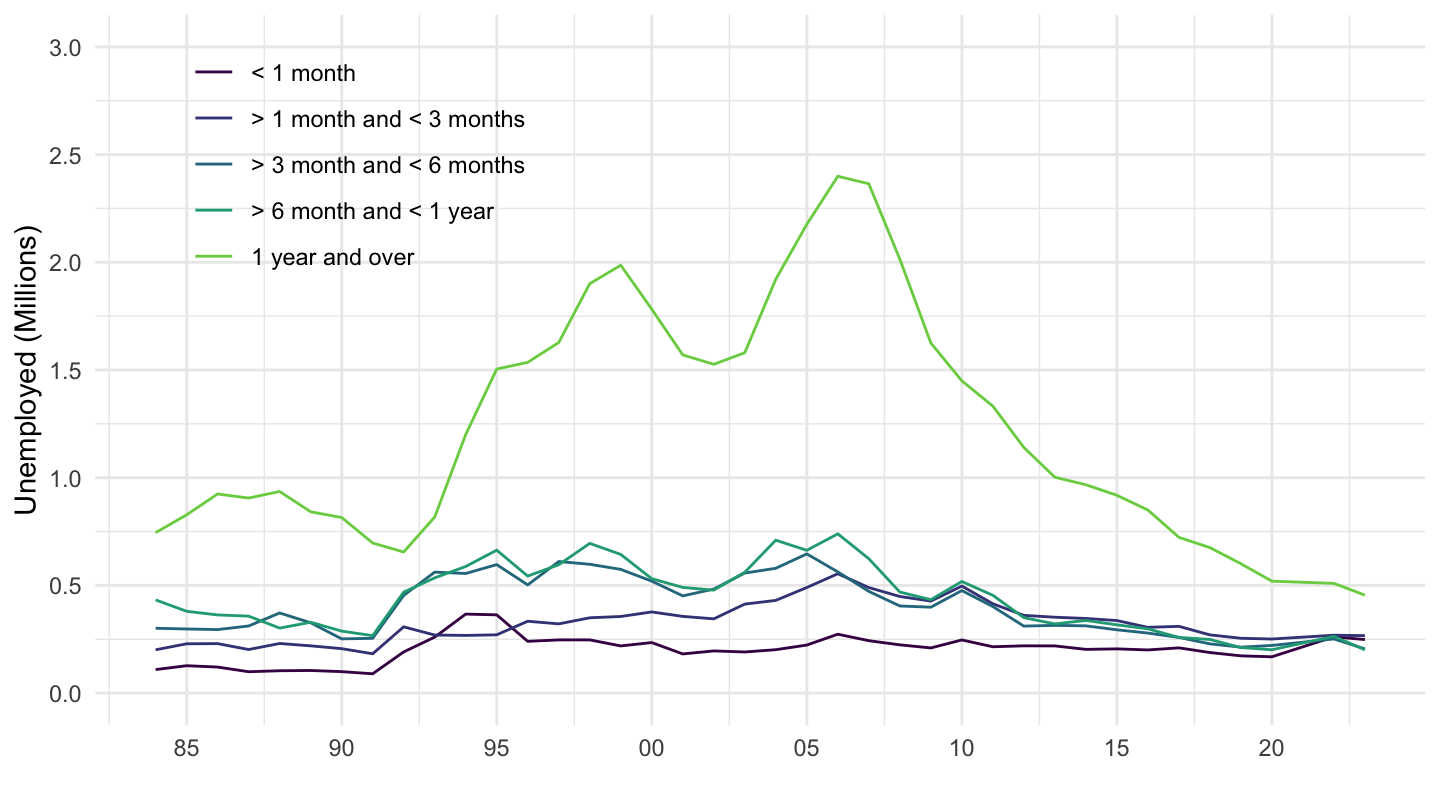
Spain
DUR_D %>%
  filter(AGE == "900000",
         SEX == "MW",
         COUNTRY == "ESP") %>%
  year_to_enddate %>%
  left_join(DUR_D_var %>% pluck("DURATION"), by = c("DURATION" = "id")) %>%
  rename(DURATION_desc = label) %>%
  ggplot() + theme_minimal() +
  geom_line(aes(x = date, y = obsValue/1000, color = DURATION_desc, linetype = DURATION_desc)) +
  scale_color_manual(values = viridis(9)[1:8]) +
  theme(legend.position = c(0.85, 0.9),
        legend.title = element_blank()) +
  xlab("") + ylab("Unemployed (Millions)") +
  scale_x_date(breaks = seq(1920, 2025, 5) %>% paste0("-01-01") %>% as.Date,
               labels = date_format("%y")) +
  theme(legend.position = c(0.47, 0.9),
        legend.title = element_blank(),
        legend.direction = "horizontal") +
  scale_y_continuous(breaks = seq(0, 1000, 0.5),
                     limits = c(0, 7))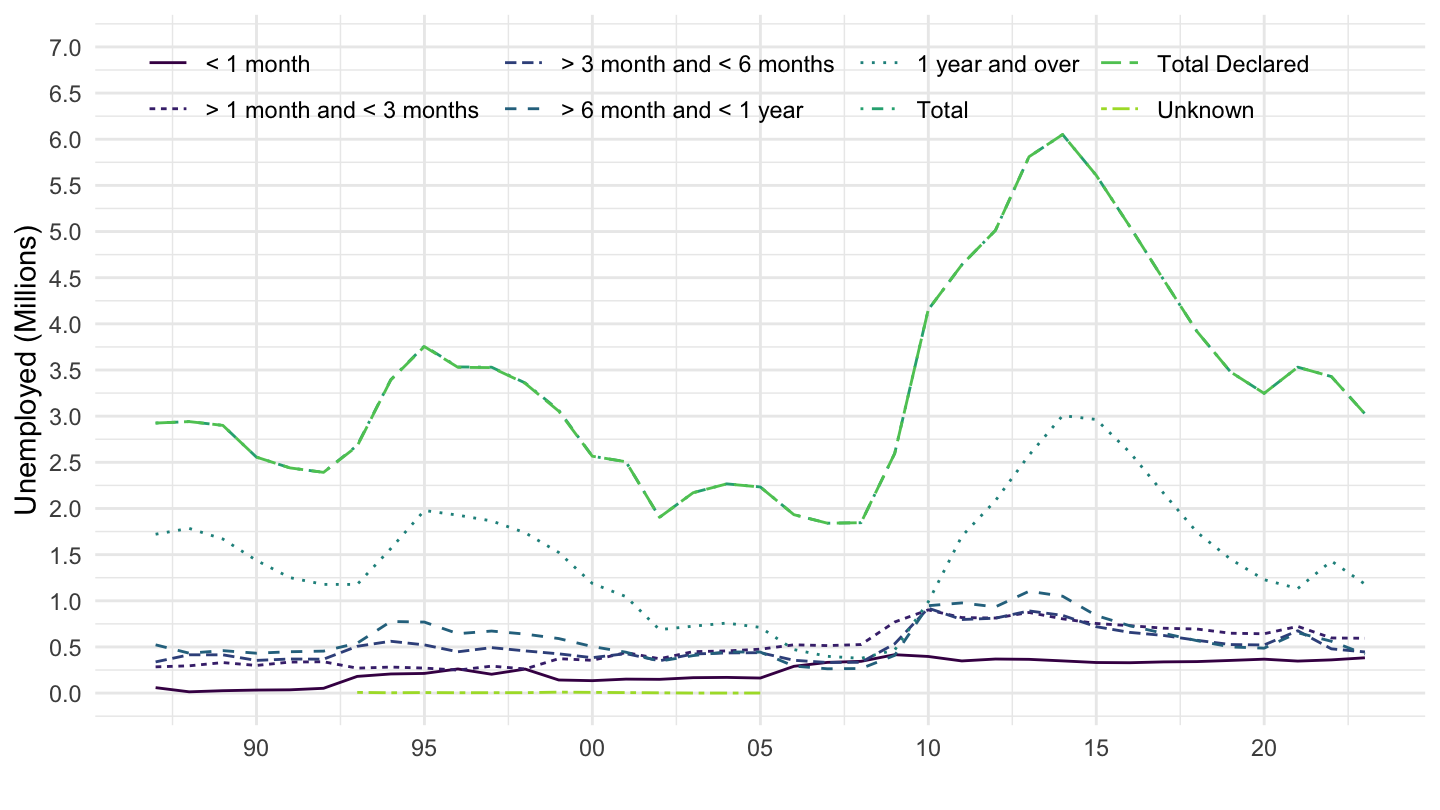
DUR_D %>%
  filter(AGE == "900000",
         SEX == "MW",
         COUNTRY == "ESP",
         DURATION %in% c("UN1", "UN2", "UN3", "UN4", "UN5")) %>%
  year_to_enddate %>%
  left_join(DUR_D_var %>% pluck("DURATION"), by = c("DURATION" = "id")) %>%
  rename(DURATION_desc = label) %>%
  ggplot() + theme_minimal() +
  geom_line(aes(x = date, y = obsValue/1000, color = DURATION_desc)) +
  scale_color_manual(values = viridis(6)[1:5]) +
  theme(legend.position = c(0.85, 0.9),
        legend.title = element_blank()) +
  xlab("") + ylab("Unemployed (Millions)") +
  scale_x_date(breaks = seq(1920, 2025, 5) %>% paste0("-01-01") %>% as.Date,
               labels = date_format("%y")) +
  theme(legend.position = c(0.2, 0.8),
        legend.title = element_blank(),
        legend.direction = "vertical") +
  scale_y_continuous(breaks = seq(0, 1000, 0.5),
                     limits = c(0, 3.5))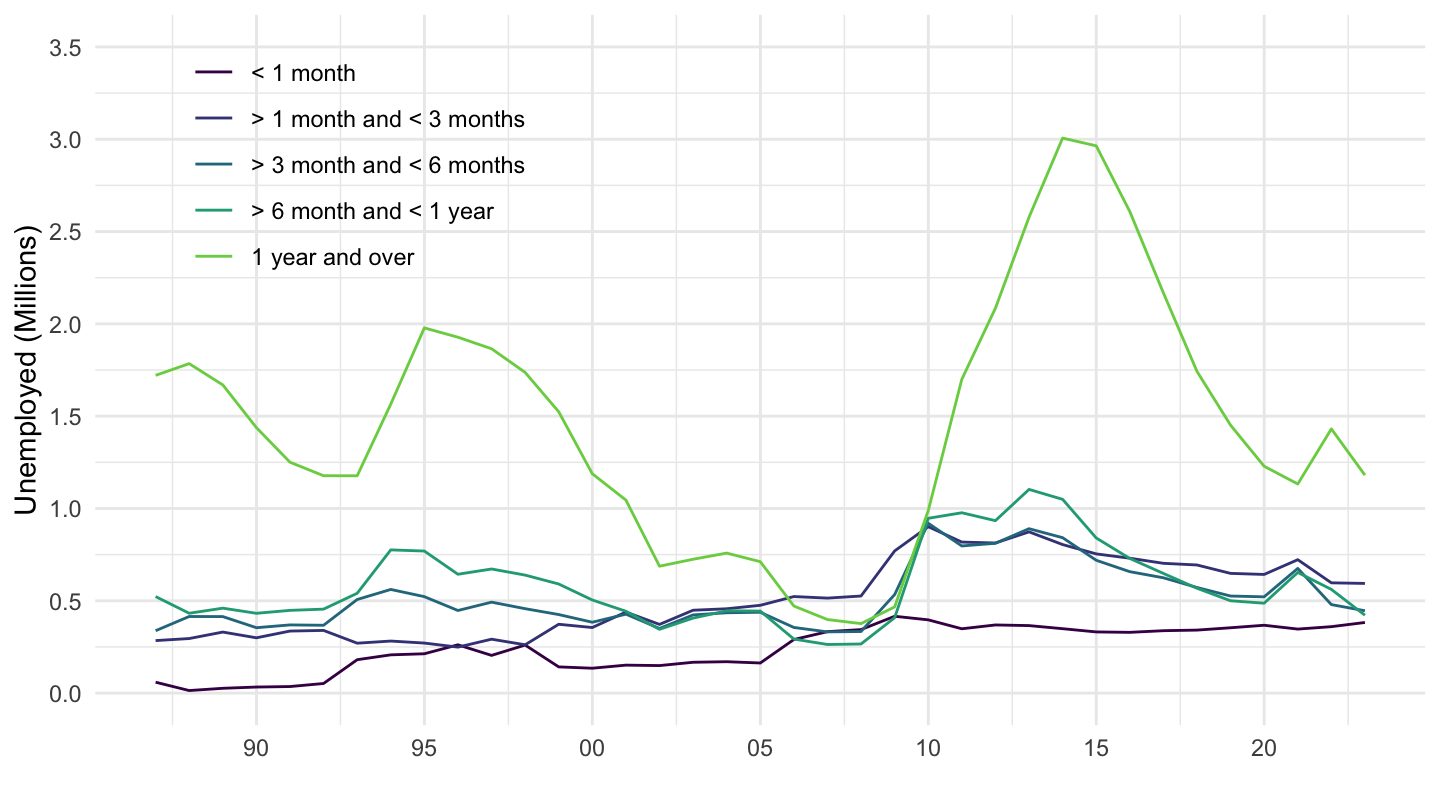
Portugal
DUR_D %>%
  filter(AGE == "900000",
         SEX == "MW",
         COUNTRY == "PRT") %>%
  year_to_enddate %>%
  left_join(DUR_D_var %>% pluck("DURATION"), by = c("DURATION" = "id")) %>%
  rename(DURATION_desc = label) %>%
  ggplot() + theme_minimal() +
  geom_line(aes(x = date, y = obsValue/1000, color = DURATION_desc, linetype = DURATION_desc)) +
  scale_color_manual(values = viridis(9)[1:8]) +
  theme(legend.position = c(0.85, 0.9),
        legend.title = element_blank()) +
  xlab("") + ylab("Unemployed (Millions)") +
  scale_x_date(breaks = seq(1920, 2025, 5) %>% paste0("-01-01") %>% as.Date,
               labels = date_format("%y")) +
  theme(legend.position = c(0.47, 0.9),
        legend.title = element_blank(),
        legend.direction = "horizontal") +
  scale_y_continuous(breaks = seq(0, 1000, 0.1),
                     limits = c(0, 1))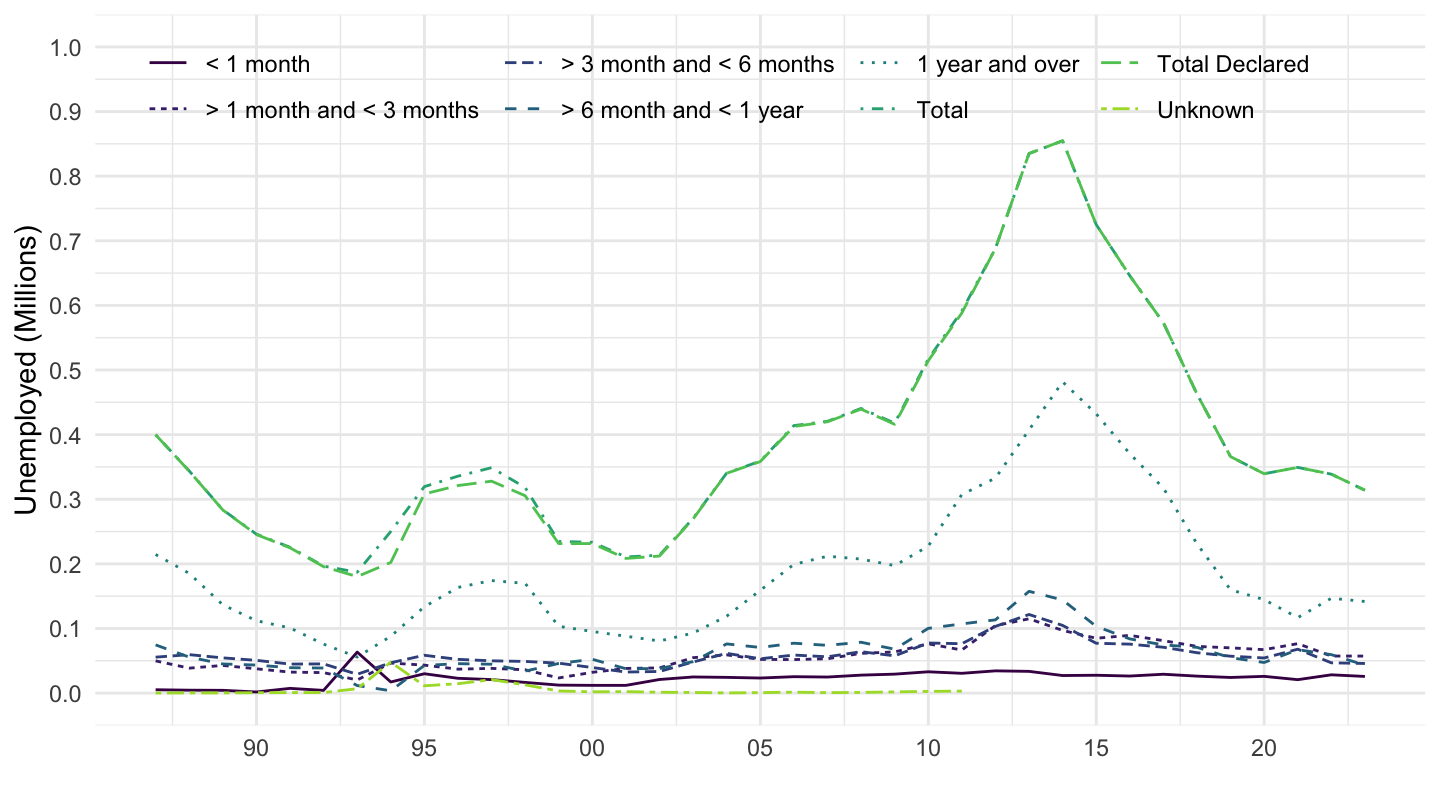
DUR_D %>%
  filter(AGE == "900000",
         SEX == "MW",
         COUNTRY == "PRT",
         DURATION %in% c("UN1", "UN2", "UN3", "UN4", "UN5")) %>%
  year_to_enddate %>%
  left_join(DUR_D_var %>% pluck("DURATION"), by = c("DURATION" = "id")) %>%
  rename(DURATION_desc = label) %>%
  ggplot() + theme_minimal() +
  geom_line(aes(x = date, y = obsValue/1000, color = DURATION_desc)) +
  scale_color_manual(values = viridis(6)[1:5]) +
  theme(legend.position = c(0.85, 0.9),
        legend.title = element_blank()) +
  xlab("") + ylab("Unemployed (Millions)") +
  scale_x_date(breaks = seq(1920, 2025, 5) %>% paste0("-01-01") %>% as.Date,
               labels = date_format("%y")) +
  theme(legend.position = c(0.2, 0.8),
        legend.title = element_blank(),
        legend.direction = "vertical") +
  scale_y_continuous(breaks = seq(0, 1000, 0.1),
                     limits = c(0, 0.6))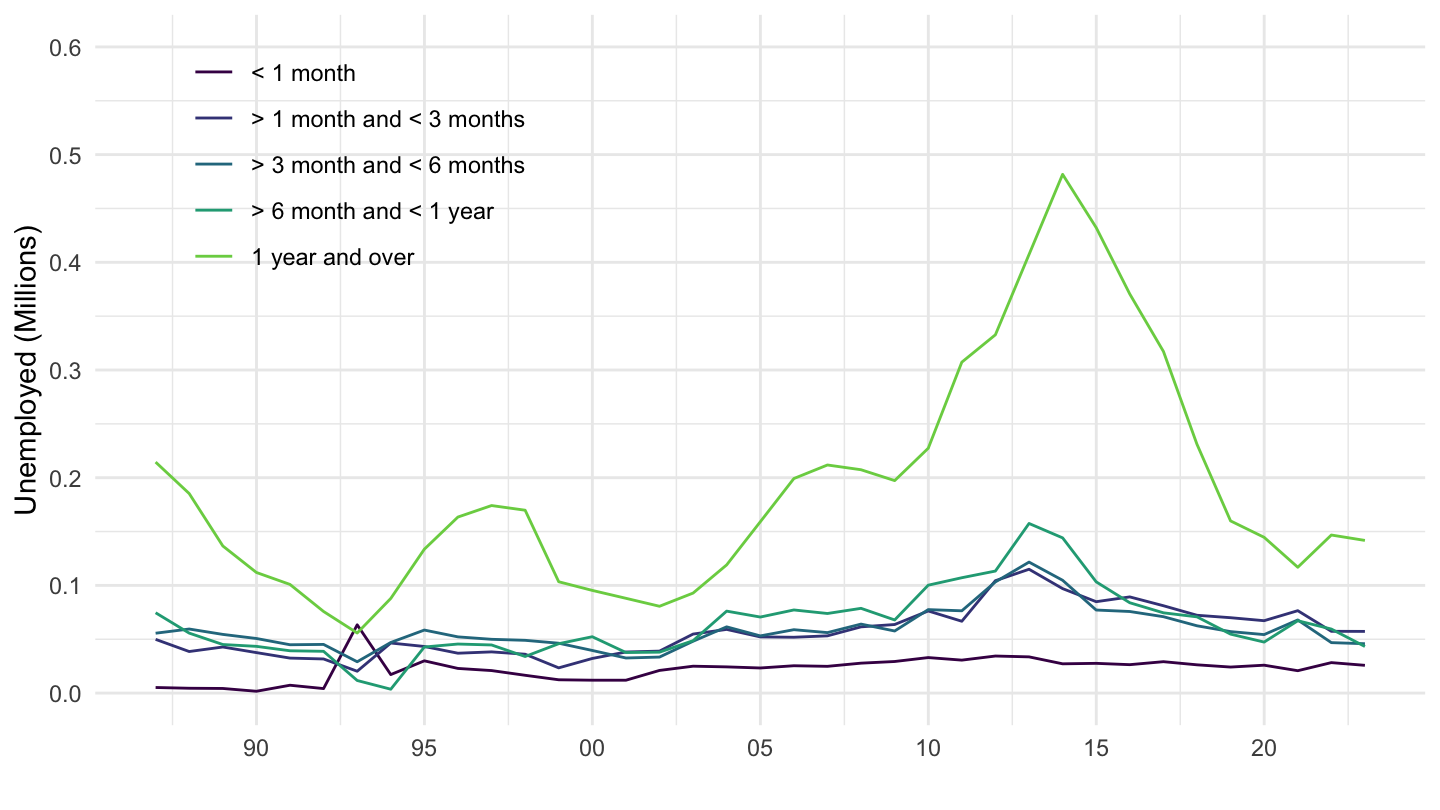
United States
DUR_D %>%
  filter(AGE == "900000",
         SEX == "MW",
         COUNTRY == "USA") %>%
  year_to_enddate %>%
  left_join(DUR_D_var %>% pluck("DURATION"), by = c("DURATION" = "id")) %>%
  rename(DURATION_desc = label) %>%
  ggplot() + theme_minimal() +
  geom_line(aes(x = date, y = obsValue/1000, color = DURATION_desc, linetype = DURATION_desc)) +
  scale_color_manual(values = viridis(9)[1:8]) +
  theme(legend.position = c(0.85, 0.9),
        legend.title = element_blank()) +
  xlab("") + ylab("Unemployed (Millions)") +
  scale_x_date(breaks = seq(1920, 2025, 5) %>% paste0("-01-01") %>% as.Date,
               labels = date_format("%y")) +
  theme(legend.position = c(0.47, 0.9),
        legend.title = element_blank(),
        legend.direction = "horizontal") +
  scale_y_continuous(breaks = seq(0, 1000, 2),
                     limits = c(0, 16))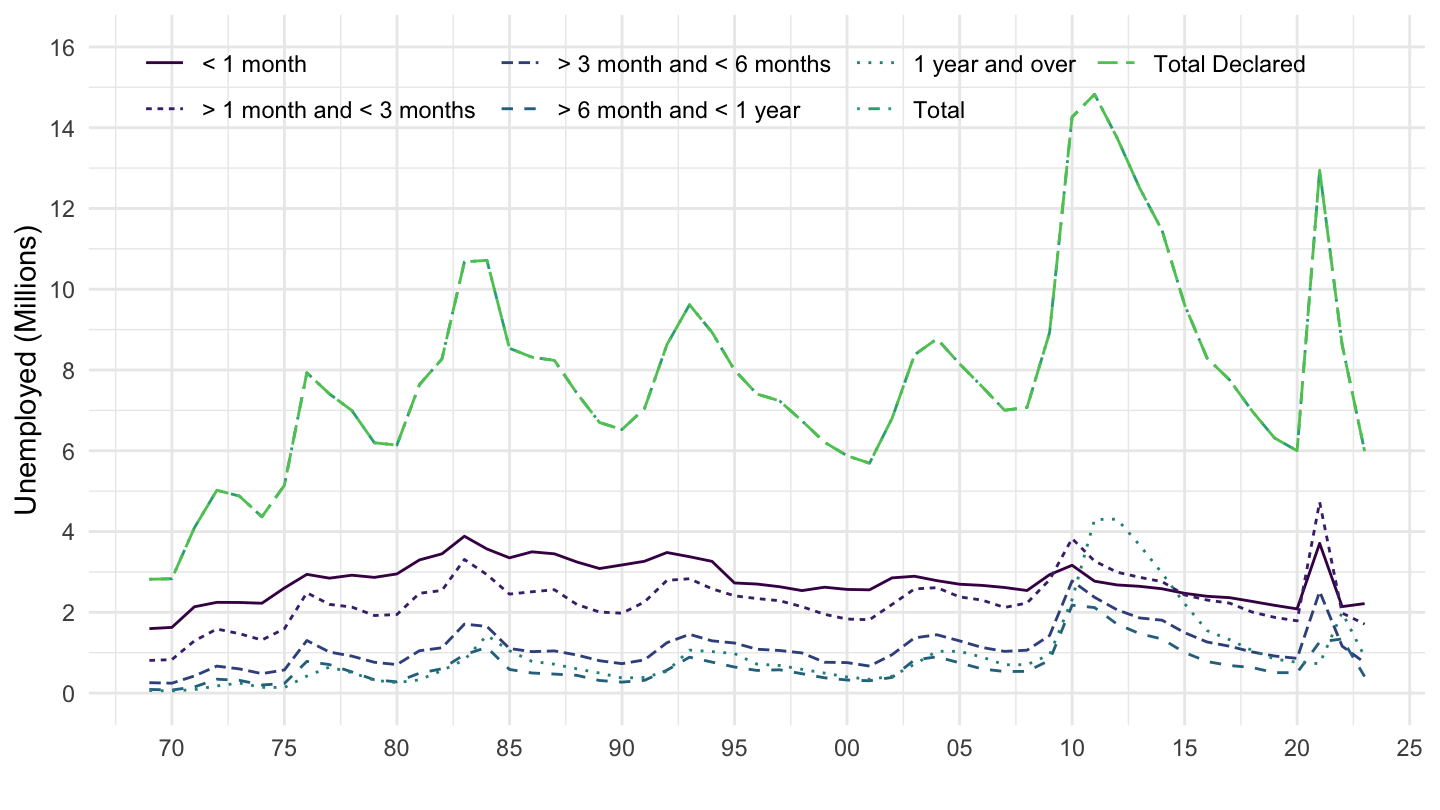
DUR_D %>%
  filter(AGE == "900000",
         SEX == "MW",
         COUNTRY == "USA",
         DURATION %in% c("UN1", "UN2", "UN3", "UN4", "UN5")) %>%
  year_to_enddate %>%
  left_join(DUR_D_var %>% pluck("DURATION"), by = c("DURATION" = "id")) %>%
  rename(DURATION_desc = label) %>%
  ggplot() + theme_minimal() +
  geom_line(aes(x = date, y = obsValue/1000, color = DURATION_desc)) +
  scale_color_manual(values = viridis(6)[1:5]) +
  theme(legend.position = c(0.85, 0.9),
        legend.title = element_blank()) +
  xlab("") + ylab("Unemployed (Millions)") +
  scale_x_date(breaks = seq(1920, 2025, 5) %>% paste0("-01-01") %>% as.Date,
               labels = date_format("%y")) +
  theme(legend.position = c(0.2, 0.8),
        legend.title = element_blank(),
        legend.direction = "vertical") +
  scale_y_continuous(breaks = seq(0, 1000, 1),
                     limits = c(0, 6))