Marché du travail
Data - IPP
François Geerolf
Info
Sources
Valeur du point d’indice s’élève à 4.68602 €. (mensuel) Indice 100 = 468.602€/mois
Annualisé: 100 = 5 623,23 €. html
Exemple: MCF 559, Professeur des écoles 444.
Indice Fonction Publique Réel
1970-
Journalier
indicefp %>%
  select(date, point_indice_en_euros) %>%
  add_row(date = as.Date("2022-01-01"), point_indice_en_euros = 56.23230) %>%
  arrange(desc(date)) %>%
  gather(variable, value, -date) %>%
  group_by(variable) %>%
  complete(date = seq.Date(min(date), max(date), by = "day")) %>%
  fill(value) %>%
  left_join(cpi, by = "date") %>%
  mutate(cpi_sm = spline(x = date, y = cpi, xout = date)$y) %>%
  mutate(value = value/cpi_sm,
         value = 100*value/value[1]) %>%
  ggplot() + geom_line(aes(x = date, y = value)) + theme_minimal() +
  scale_x_date(breaks = seq(1920, 2025, 2) %>% paste0("-01-01") %>% as.Date,
               labels = date_format("%y")) +
  scale_y_log10(breaks = seq(0, 200, 2)) +
  ylab("Point Indice Fonction Publique (euros constants)") + xlab("")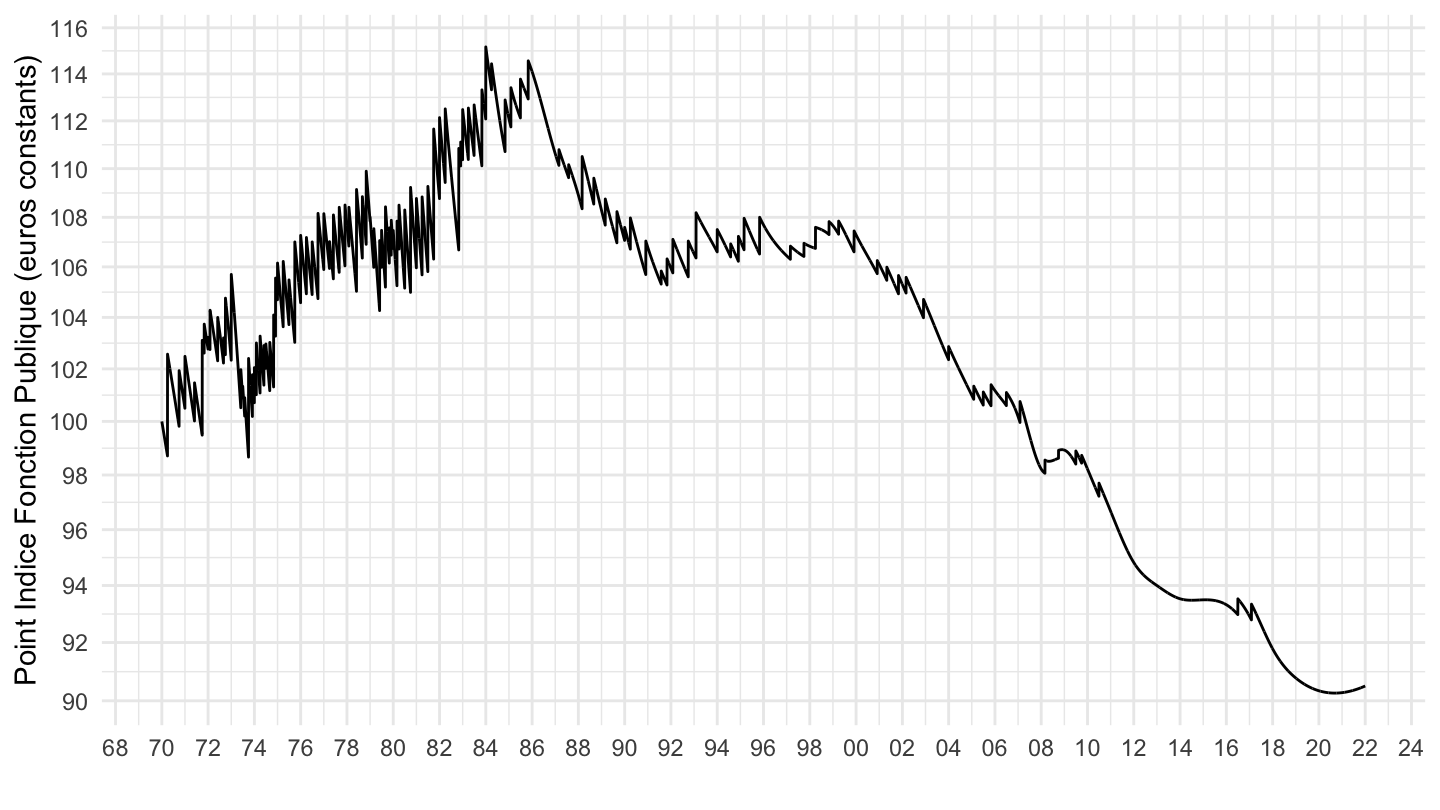
Annuel
indicefp %>%
  select(date, point_indice_en_euros) %>%
  add_row(date = as.Date("2022-01-01"), point_indice_en_euros = 56.23230) %>%
  arrange(desc(date)) %>%
  gather(variable, value, -date) %>%
  group_by(variable) %>%
  complete(date = seq.Date(min(date), max(date), by = "day")) %>%
  fill(value) %>%
  filter(month(date) == 1,
         day(date) == 1) %>%
  left_join(cpi, by = "date") %>%
  mutate(value = value/cpi,
         value = 100*value/value[1]) %>%
  ggplot() + geom_line(aes(x = date, y = value)) + theme_minimal() +
  scale_x_date(breaks = seq(1920, 2025, 2) %>% paste0("-01-01") %>% as.Date,
               labels = date_format("%y")) +
  scale_y_log10(breaks = seq(0, 200, 2)) +
  ylab("Point Indice Fonction Publique (euros constants)") + xlab("")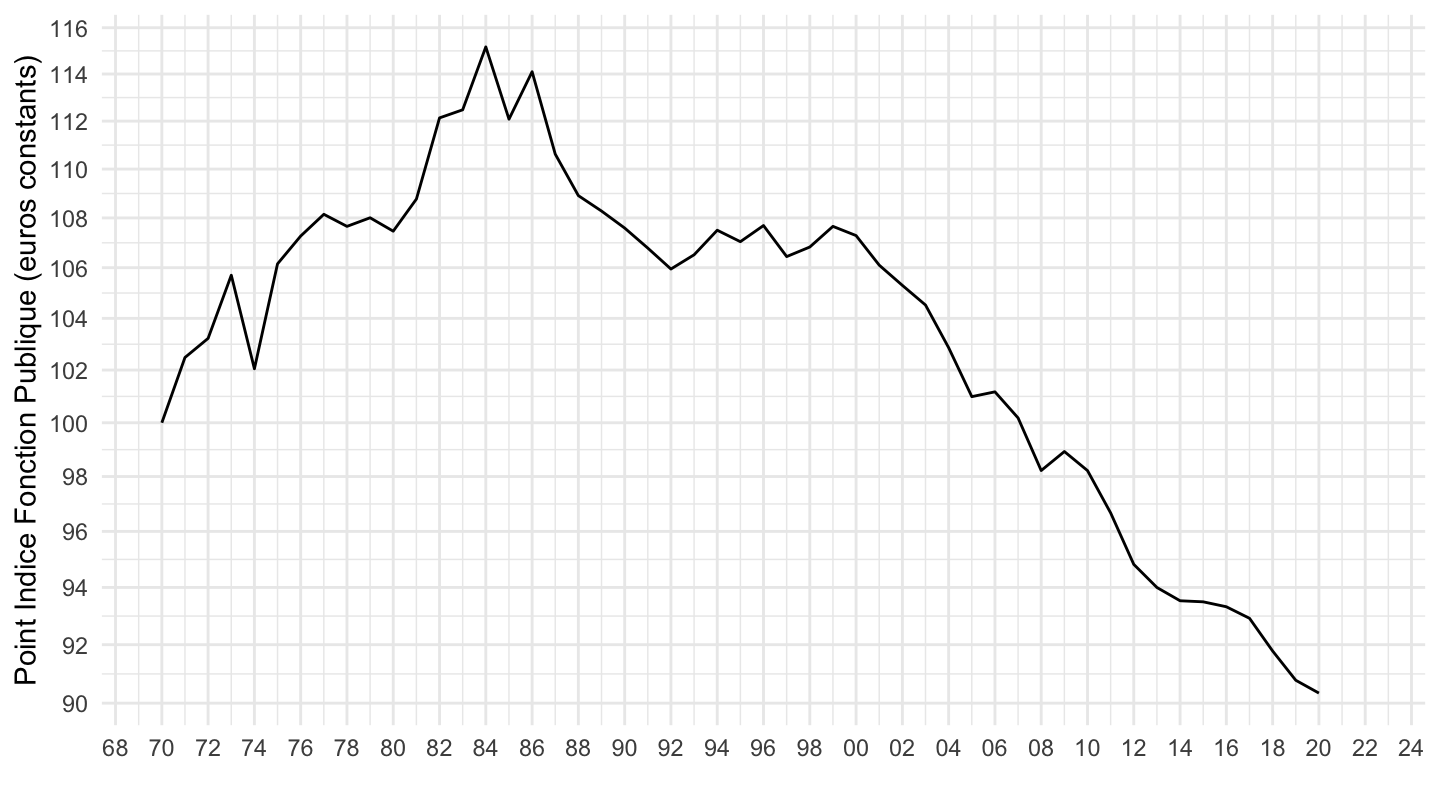
1981-
Journalier
indicefp %>%
  select(date, point_indice_en_euros) %>%
  add_row(date = as.Date("2022-01-01"), point_indice_en_euros = 56.23230) %>%
  gather(variable, value, -date) %>%
  group_by(variable) %>%
  complete(date = seq.Date(min(date), max(date), by = "day")) %>%
  fill(value) %>%
  left_join(cpi, by = "date") %>%
  mutate(cpi_sm = spline(x = date, y = cpi, xout = date)$y) %>%
  filter(date >= as.Date("1981-01-01")) %>%
  mutate(value = value/cpi_sm,
         value = 100*value/value[1]) %>%
  ggplot() + geom_line(aes(x = date, y = value)) + theme_minimal() +
  scale_x_date(breaks = seq(1920, 2025, 2) %>% paste0("-01-01") %>% as.Date,
               labels = date_format("%y")) +
  scale_y_log10(breaks = seq(0, 200, 2)) +
  ylab("Point Indice Fonction Publique (euros constants)") + xlab("")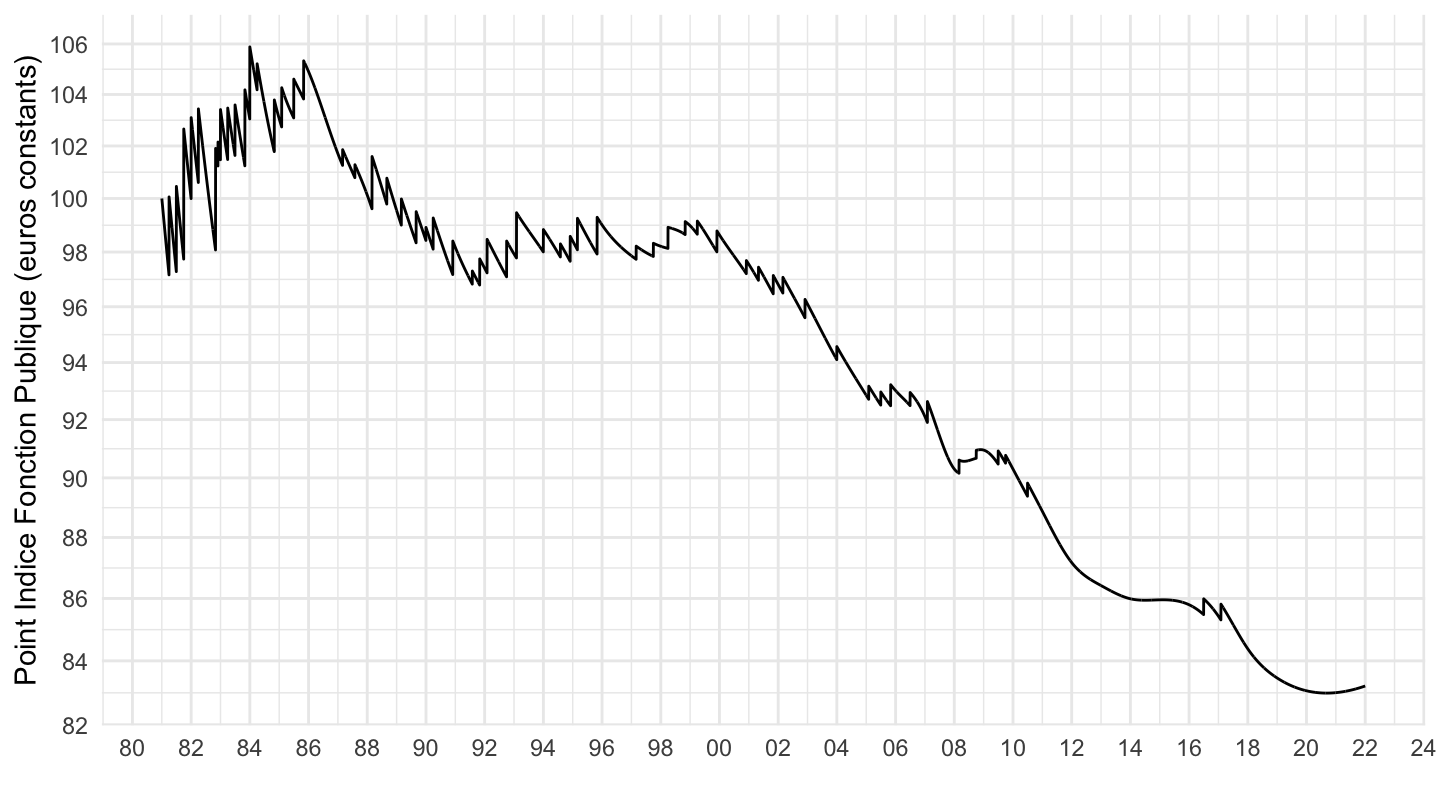
Annuel
indicefp %>%
  select(date, point_indice_en_euros) %>%
  add_row(date = as.Date("2022-01-01"), point_indice_en_euros = 56.23230) %>%
  gather(variable, value, -date) %>%
  group_by(variable) %>%
  complete(date = seq.Date(min(date), max(date), by = "day")) %>%
  fill(value) %>%
  filter(month(date) == 1,
         day(date) == 1) %>%
  left_join(cpi, by = "date") %>%
  mutate(cpi_sm = spline(x = date, y = cpi, xout = date)$y) %>%
  filter(date >= as.Date("1981-01-01")) %>%
  mutate(value = value/cpi_sm,
         value = 100*value/value[1]) %>%
  ggplot() + geom_line(aes(x = date, y = value)) + theme_minimal() +
  scale_x_date(breaks = seq(1920, 2025, 2) %>% paste0("-01-01") %>% as.Date,
               labels = date_format("%y")) +
  scale_y_log10(breaks = seq(0, 200, 2)) +
  ylab("Point Indice Fonction Publique (euros constants)") + xlab("")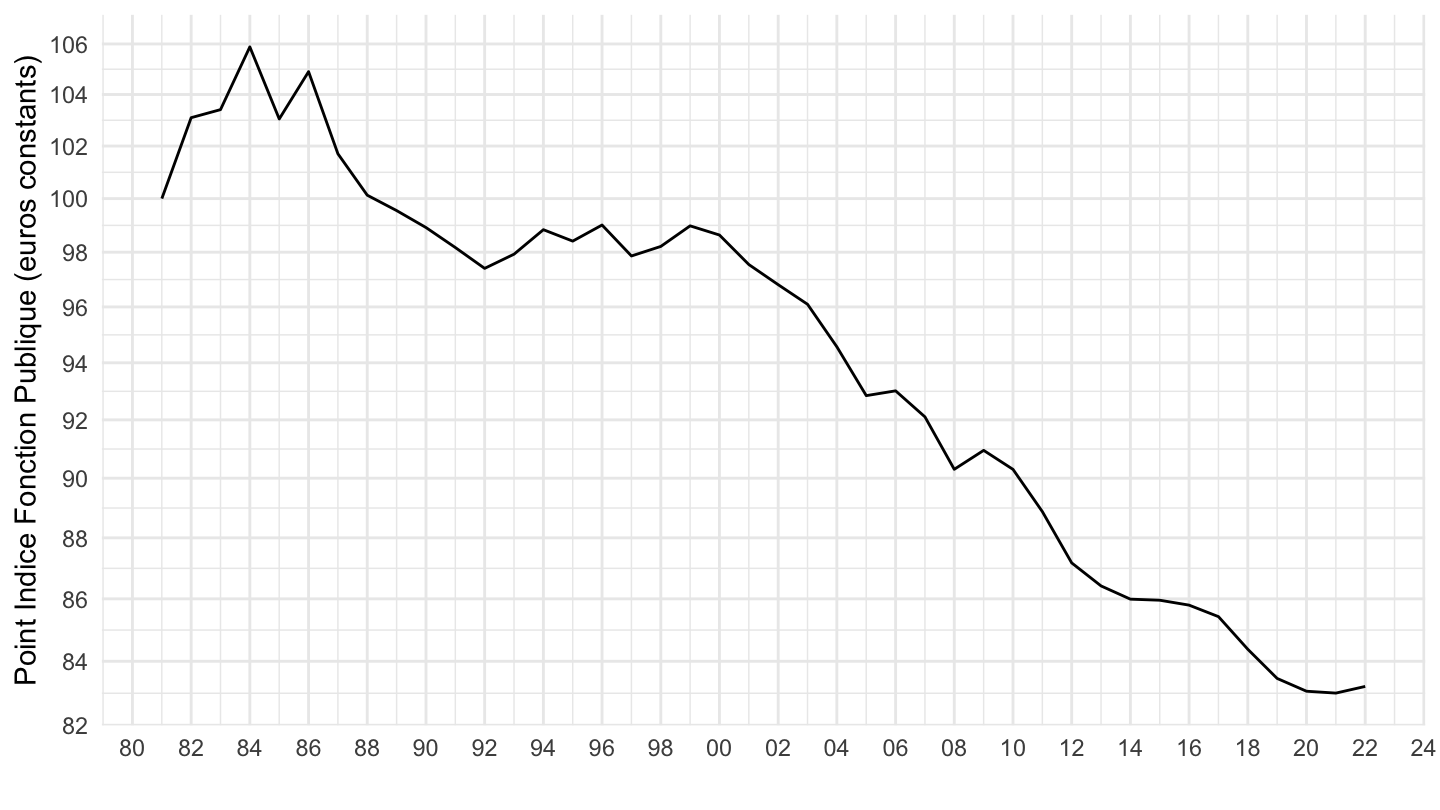
1984-
Journalier
indicefp %>%
  select(date, point_indice_en_euros) %>%
  add_row(date = as.Date("2022-01-01"), point_indice_en_euros = 56.23230) %>%
  gather(variable, value, -date) %>%
  group_by(variable) %>%
  complete(date = seq.Date(min(date), max(date), by = "day")) %>%
  fill(value) %>%
  left_join(cpi, by = "date") %>%
  mutate(cpi_sm = spline(x = date, y = cpi, xout = date)$y) %>%
  filter(date >= as.Date("1984-01-01")) %>%
  mutate(value = value/cpi_sm,
         value = 100*value/value[1]) %>%
  ggplot() + geom_line(aes(x = date, y = value)) + theme_minimal() +
  scale_x_date(breaks = seq(1920, 2025, 2) %>% paste0("-01-01") %>% as.Date,
               labels = date_format("%y")) +
  scale_y_log10(breaks = seq(0, 200, 2)) +
  ylab("Point Indice Fonction Publique (euros constants)") + xlab("")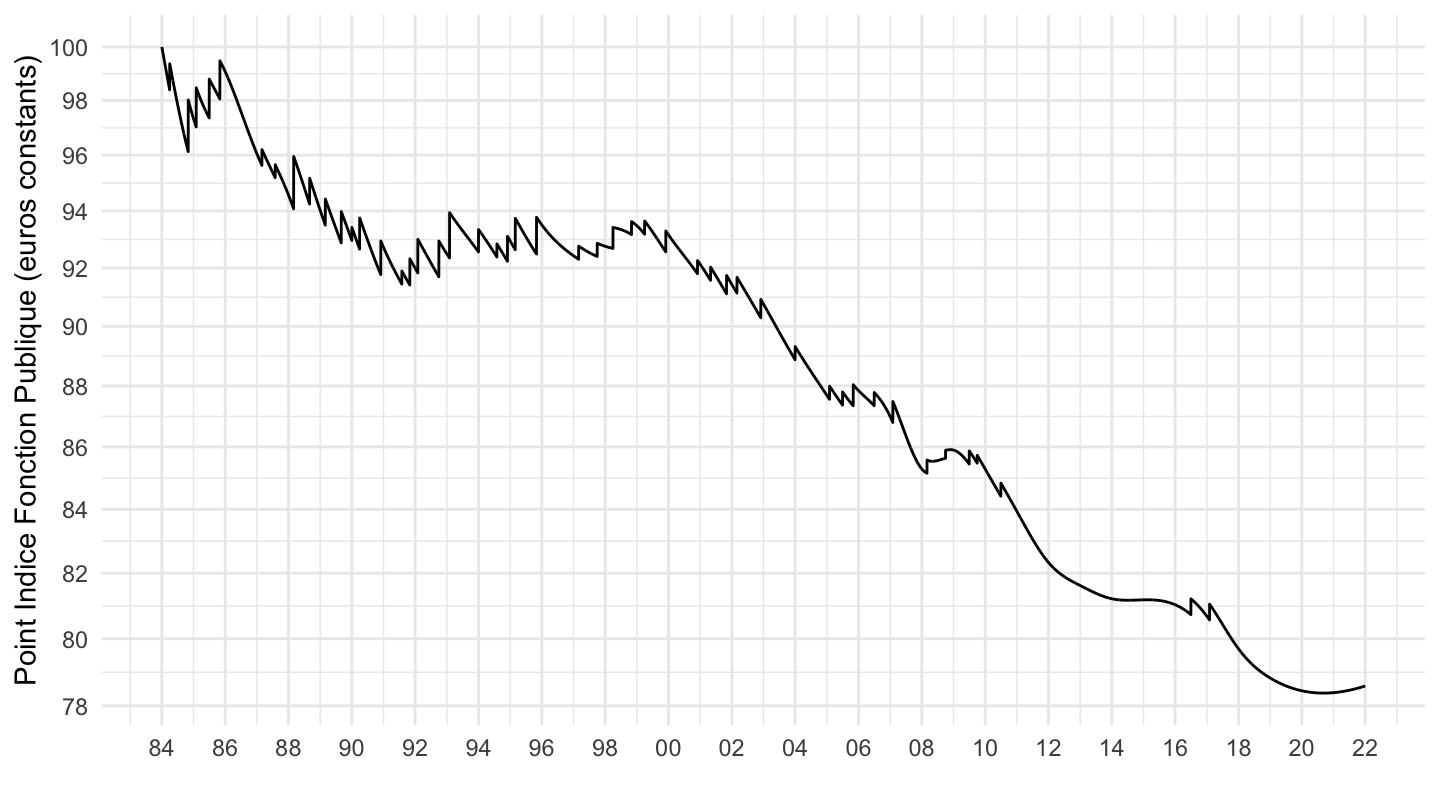
Annuel
indicefp %>%
  select(date, point_indice_en_euros) %>%
  add_row(date = as.Date("2022-01-01"), point_indice_en_euros = 56.23230) %>%
  gather(variable, value, -date) %>%
  group_by(variable) %>%
  complete(date = seq.Date(min(date), max(date), by = "day")) %>%
  fill(value) %>%
  filter(month(date) == 1,
         day(date) == 1) %>%
  left_join(cpi, by = "date") %>%
  mutate(cpi_sm = spline(x = date, y = cpi, xout = date)$y) %>%
  filter(date >= as.Date("1984-01-01")) %>%
  mutate(value = value/cpi_sm,
         value = 100*value/value[1]) %>%
  ggplot() + geom_line(aes(x = date, y = value)) + theme_minimal() +
  scale_x_date(breaks = seq(1920, 2025, 5) %>% paste0("-01-01") %>% as.Date,
               labels = date_format("%Y")) +
  scale_y_log10(breaks = seq(0, 200, 2)) +
  ylab("Point Indice Fonction Publique (euros constants)") + xlab("")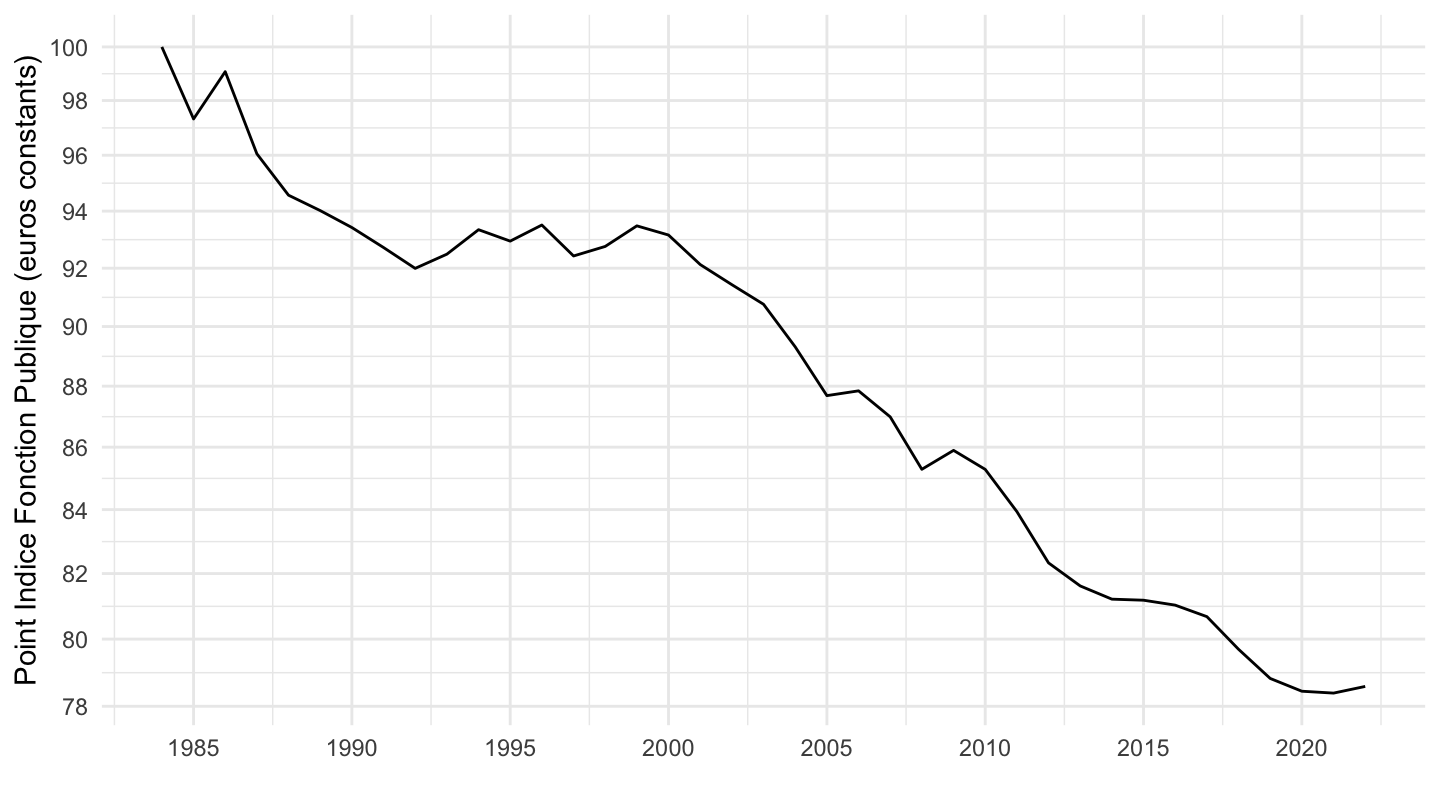
1986-
Journalier
indicefp %>%
  select(date, point_indice_en_euros) %>%
  add_row(date = as.Date("2022-01-01"), point_indice_en_euros = 56.23230) %>%
  gather(variable, value, -date) %>%
  group_by(variable) %>%
  complete(date = seq.Date(min(date), max(date), by = "day")) %>%
  fill(value) %>%
  left_join(cpi, by = "date") %>%
  mutate(cpi_sm = spline(x = date, y = cpi, xout = date)$y) %>%
  filter(date >= as.Date("1986-01-01")) %>%
  mutate(value = value/cpi_sm,
         value = 100*value/value[1]) %>%
  ggplot() + geom_line(aes(x = date, y = value)) + theme_minimal() +
  scale_x_date(breaks = seq(1920, 2025, 2) %>% paste0("-01-01") %>% as.Date,
               labels = date_format("%y")) +
  scale_y_log10(breaks = seq(0, 200, 2)) +
  ylab("Point Indice Fonction Publique (euros constants)") + xlab("")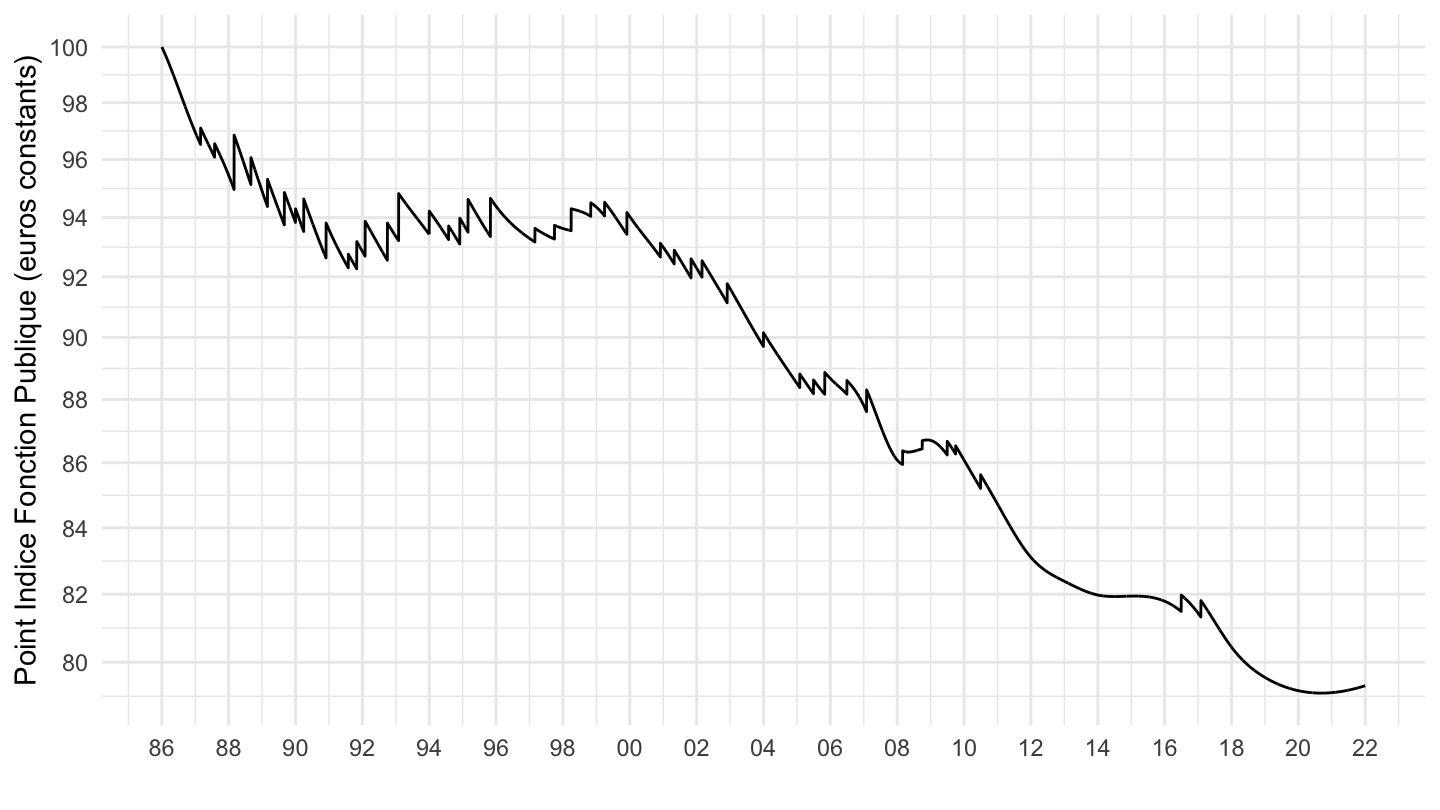
Annuel
indicefp %>%
  select(date, point_indice_en_euros) %>%
  add_row(date = as.Date("2022-01-01"), point_indice_en_euros = 56.23230) %>%
  gather(variable, value, -date) %>%
  group_by(variable) %>%
  complete(date = seq.Date(min(date), max(date), by = "day")) %>%
  fill(value) %>%
  filter(month(date) == 1,
         day(date) == 1) %>%
  left_join(cpi, by = "date") %>%
  mutate(cpi_sm = spline(x = date, y = cpi, xout = date)$y) %>%
  filter(date >= as.Date("1986-01-01")) %>%
  mutate(value = value/cpi_sm,
         value = 100*value/value[1]) %>%
  ggplot() + geom_line(aes(x = date, y = value)) + theme_minimal() +
  scale_x_date(breaks = seq(1920, 2025, 5) %>% paste0("-01-01") %>% as.Date,
               labels = date_format("%Y")) +
  scale_y_log10(breaks = seq(0, 200, 2)) +
  ylab("Point Indice Fonction Publique (euros constants)") + xlab("")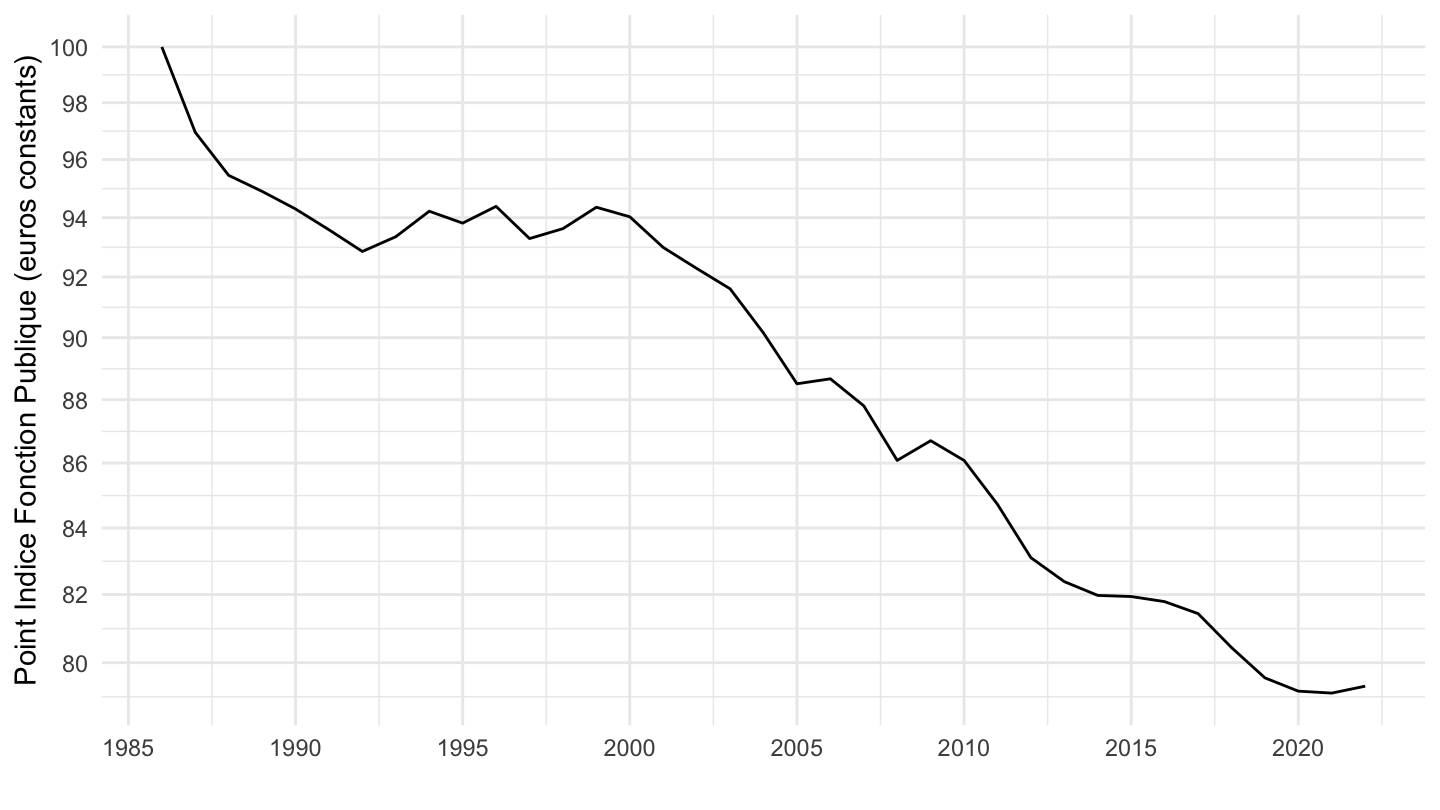
1990-
indicefp %>%
  select(date, point_indice_en_euros) %>%
  add_row(date = as.Date("2022-01-01"), point_indice_en_euros = 56.23230) %>%
  gather(variable, value, -date) %>%
  group_by(variable) %>%
  complete(date = seq.Date(min(date), max(date), by = "day")) %>%
  fill(value) %>%
  left_join(cpi, by = "date") %>%
  mutate(cpi_sm = spline(x = date, y = cpi, xout = date)$y) %>%
  filter(date >= as.Date("1990-01-01")) %>%
  mutate(value = value/cpi_sm,
         value = 100*value/value[1]) %>%
  ggplot() + geom_line(aes(x = date, y = value)) + theme_minimal() +
  scale_x_date(breaks = seq(1920, 2025, 2) %>% paste0("-01-01") %>% as.Date,
               labels = date_format("%y")) +
  scale_y_log10(breaks = seq(0, 200, 2)) +
  ylab("Point Indice Fonction Publique (euros constants)") + xlab("")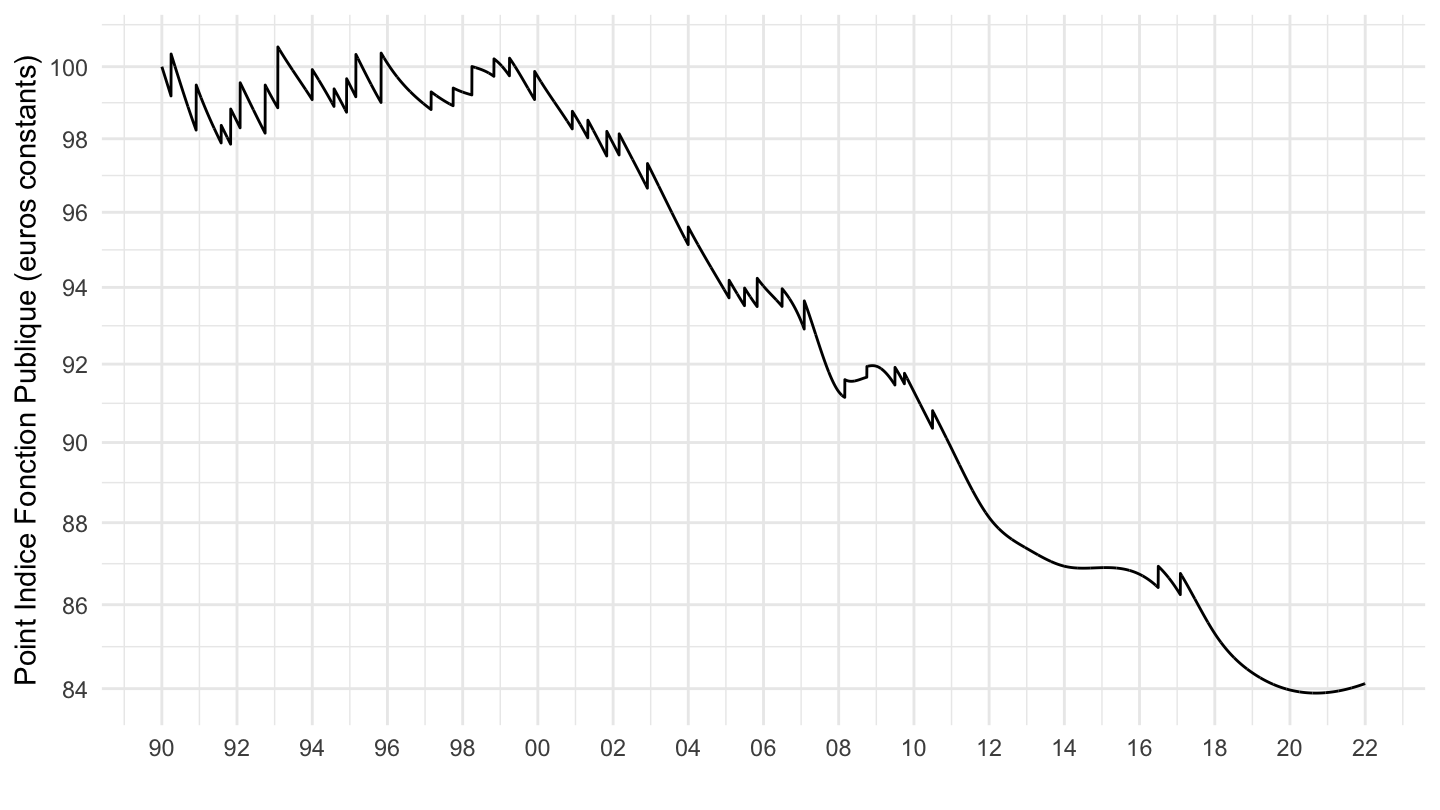
1992-
indicefp %>%
  select(date, point_indice_en_euros) %>%
  add_row(date = as.Date("2022-01-01"), point_indice_en_euros = 56.23230) %>%
  gather(variable, value, -date) %>%
  group_by(variable) %>%
  complete(date = seq.Date(min(date), max(date), by = "day")) %>%
  fill(value) %>%
  left_join(cpi, by = "date") %>%
  mutate(cpi_sm = spline(x = date, y = cpi, xout = date)$y) %>%
  filter(date >= as.Date("1992-01-01")) %>%
  mutate(value = value/cpi_sm,
         value = 100*value/value[1]) %>%
  ggplot() + geom_line(aes(x = date, y = value)) + theme_minimal() +
  scale_x_date(breaks = seq(1920, 2025, 2) %>% paste0("-01-01") %>% as.Date,
               labels = date_format("%y")) +
  scale_y_log10(breaks = seq(0, 200, 2)) +
  ylab("Point Indice Fonction Publique (euros constants)") + xlab("")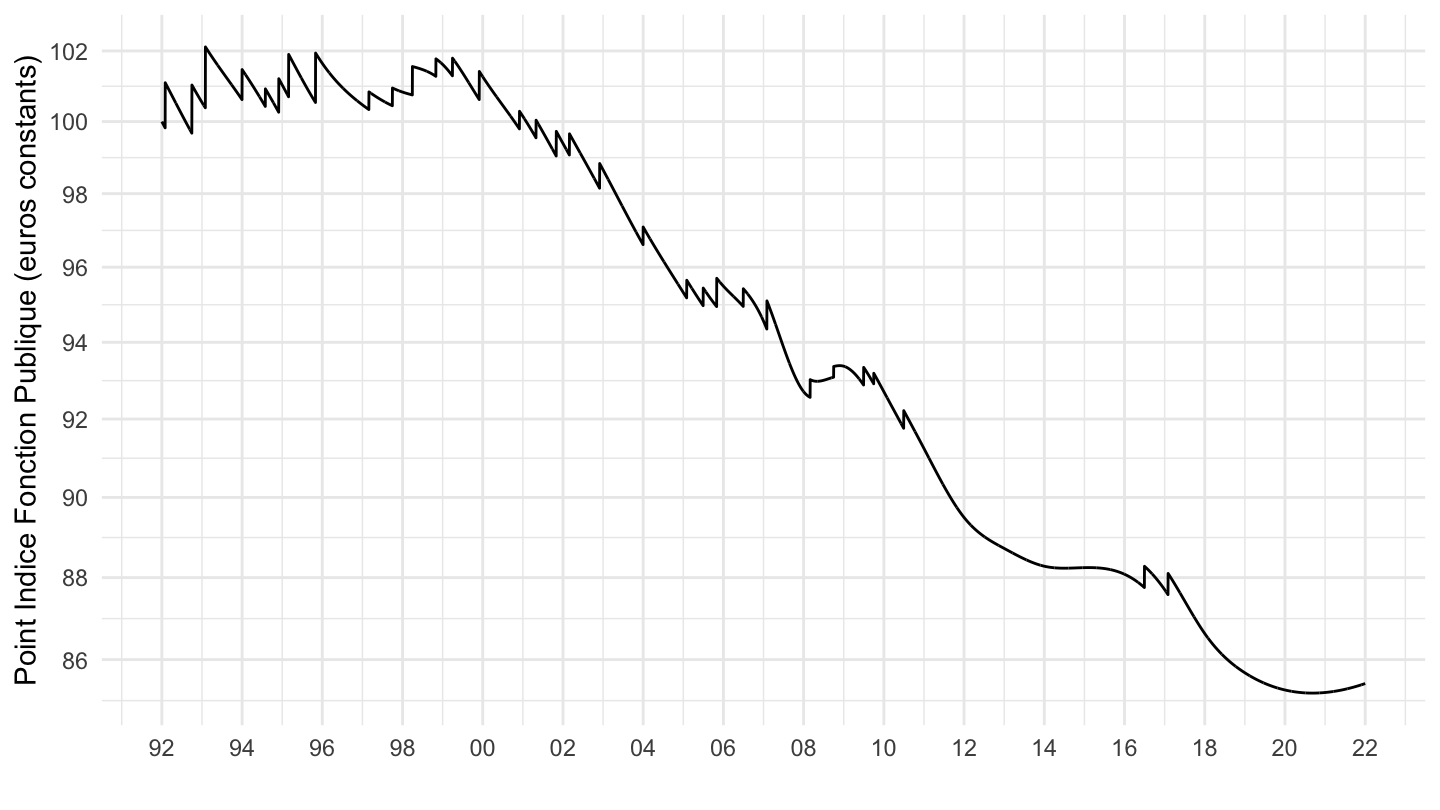
1996-
Journalier
indicefp %>%
  select(date, point_indice_en_euros) %>%
  add_row(date = as.Date("2022-01-01"), point_indice_en_euros = 56.23230) %>%
  gather(variable, value, -date) %>%
  group_by(variable) %>%
  complete(date = seq.Date(min(date), max(date), by = "day")) %>%
  fill(value) %>%
  left_join(cpi, by = "date") %>%
  mutate(cpi_sm = spline(x = date, y = cpi, xout = date)$y) %>%
  filter(date >= as.Date("1996-01-01")) %>%
  mutate(value = value/cpi_sm,
         value = 100*value/value[1]) %>%
  ggplot() + geom_line(aes(x = date, y = value)) + theme_minimal() +
  scale_x_date(breaks = seq(1920, 2025, 5) %>% paste0("-01-01") %>% as.Date,
               labels = date_format("%y")) +
  scale_y_log10(breaks = seq(0, 200, 2)) +
  ylab("Point Indice Fonction Publique (euros constants)") + xlab("")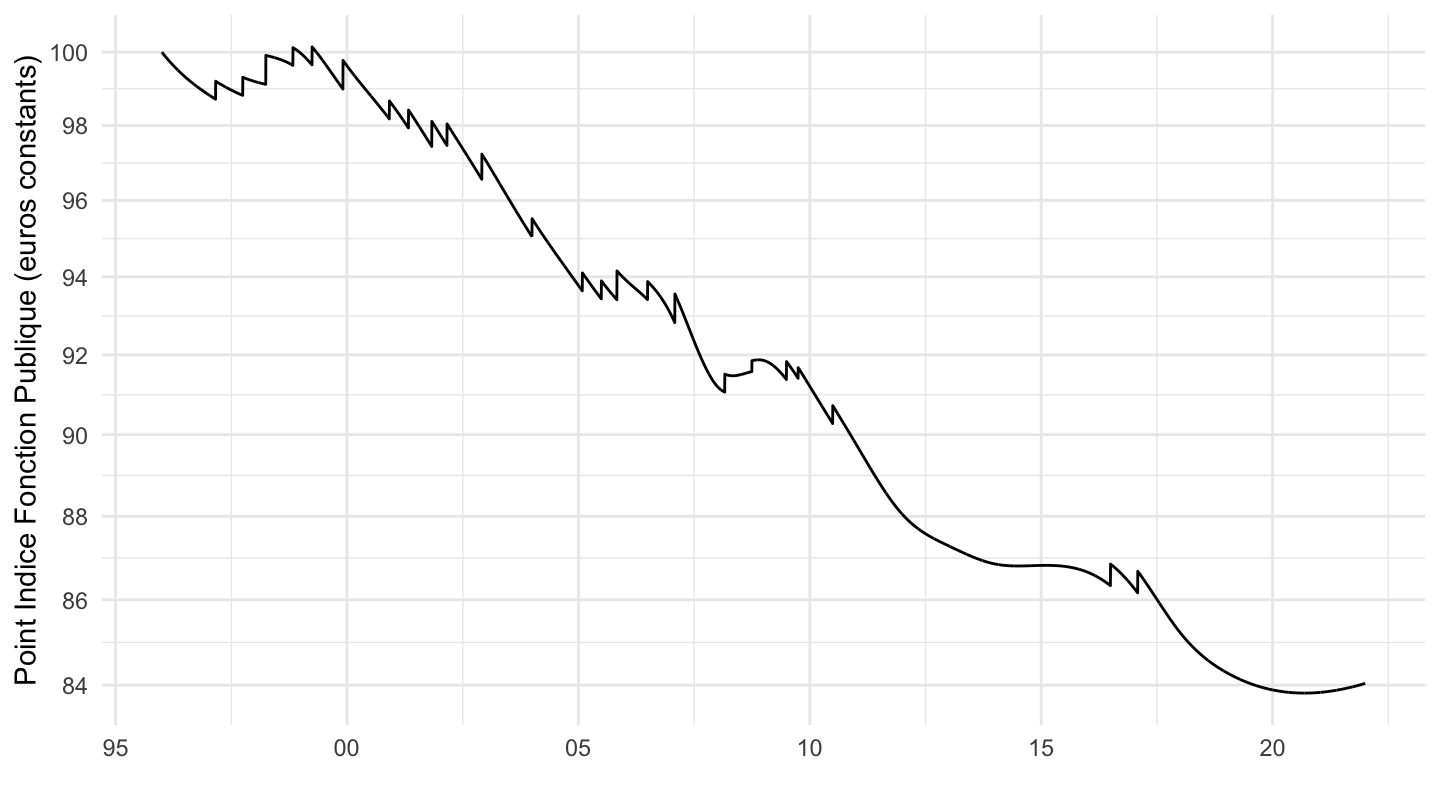
Annuel
indicefp %>%
  select(date, point_indice_en_euros) %>%
  add_row(date = as.Date("2022-01-01"), point_indice_en_euros = 56.23230) %>%
  arrange(desc(date)) %>%
  gather(variable, value, -date) %>%
  group_by(variable) %>%
  complete(date = seq.Date(min(date), max(date), by = "day")) %>%
  fill(value) %>%
  filter(month(date) == 1,
         day(date) == 1) %>%
  left_join(cpi, by = "date") %>%
  filter(date >= as.Date("1996-01-01")) %>%
  mutate(value = value/cpi,
         value = 100*value/value[1]) %>%
  ggplot() + geom_line(aes(x = date, y = value)) + theme_minimal() +
  scale_x_date(breaks = seq(1920, 2025, 2) %>% paste0("-01-01") %>% as.Date,
               labels = date_format("%y")) +
  scale_y_log10(breaks = seq(0, 200, 2)) +
  ylab("Point Indice Fonction Publique (euros constants)") + xlab("")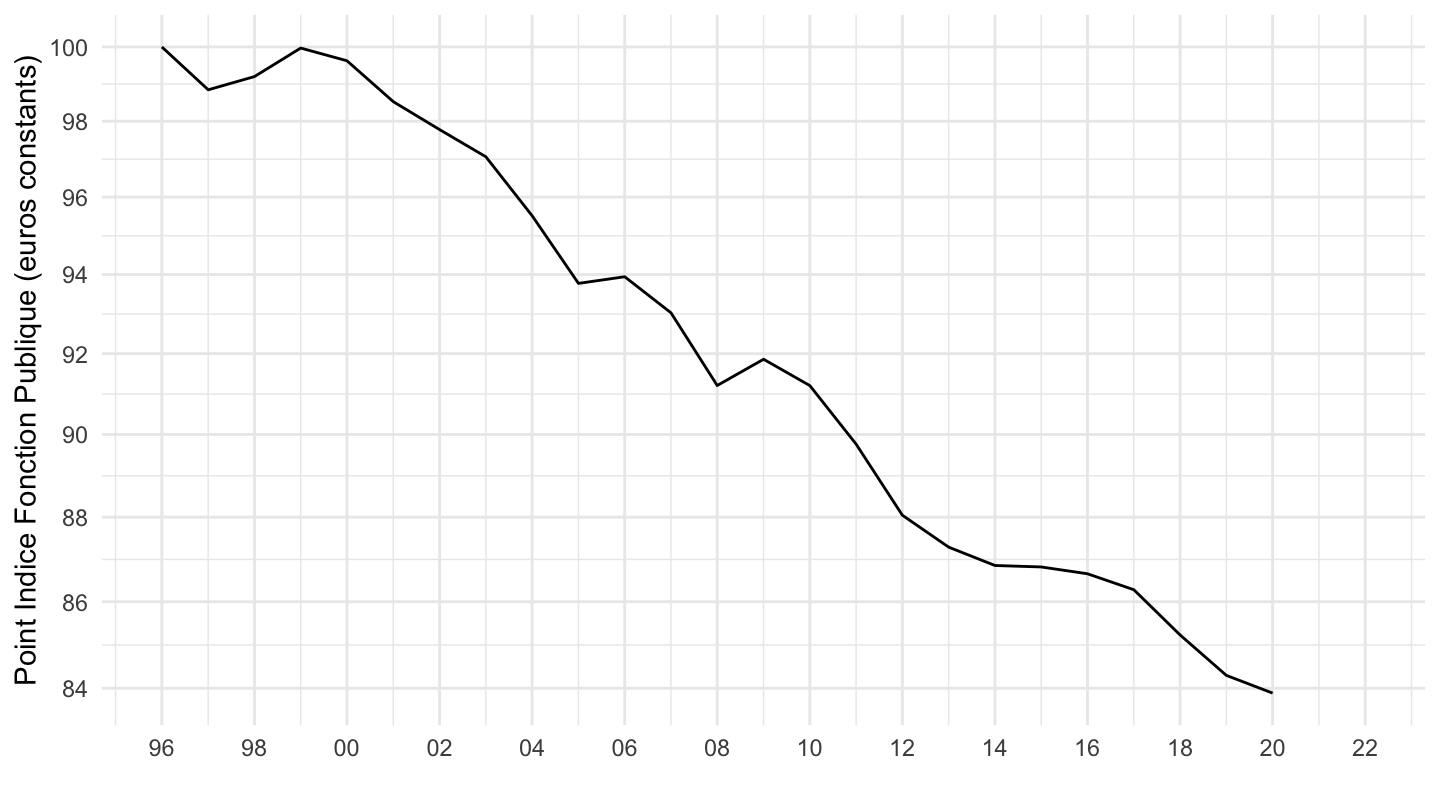
CPI
indicefp %>%
  select(date, point_indice_en_euros) %>%
  add_row(date = as.Date("2022-01-01"), point_indice_en_euros = 56.23230) %>%
  arrange(desc(date)) %>%
  gather(variable, value, -date) %>%
  group_by(variable) %>%
  complete(date = seq.Date(min(date), max(date), by = "day")) %>%
  fill(value) %>%
  filter(month(date) == 1,
         day(date) == 1) %>%
  left_join(cpi2, by = "date") %>%
  filter(date >= as.Date("1996-01-01")) %>%
  mutate(value = value/cpi,
         value = 100*value/value[1]) %>%
  ggplot() + geom_line(aes(x = date, y = value)) + theme_minimal() +
  scale_x_date(breaks = seq(1920, 2025, 2) %>% paste0("-01-01") %>% as.Date,
               labels = date_format("%y")) +
  scale_y_log10(breaks = seq(0, 200, 2)) +
  ylab("Point Indice Fonction Publique (€ constants)") + xlab("")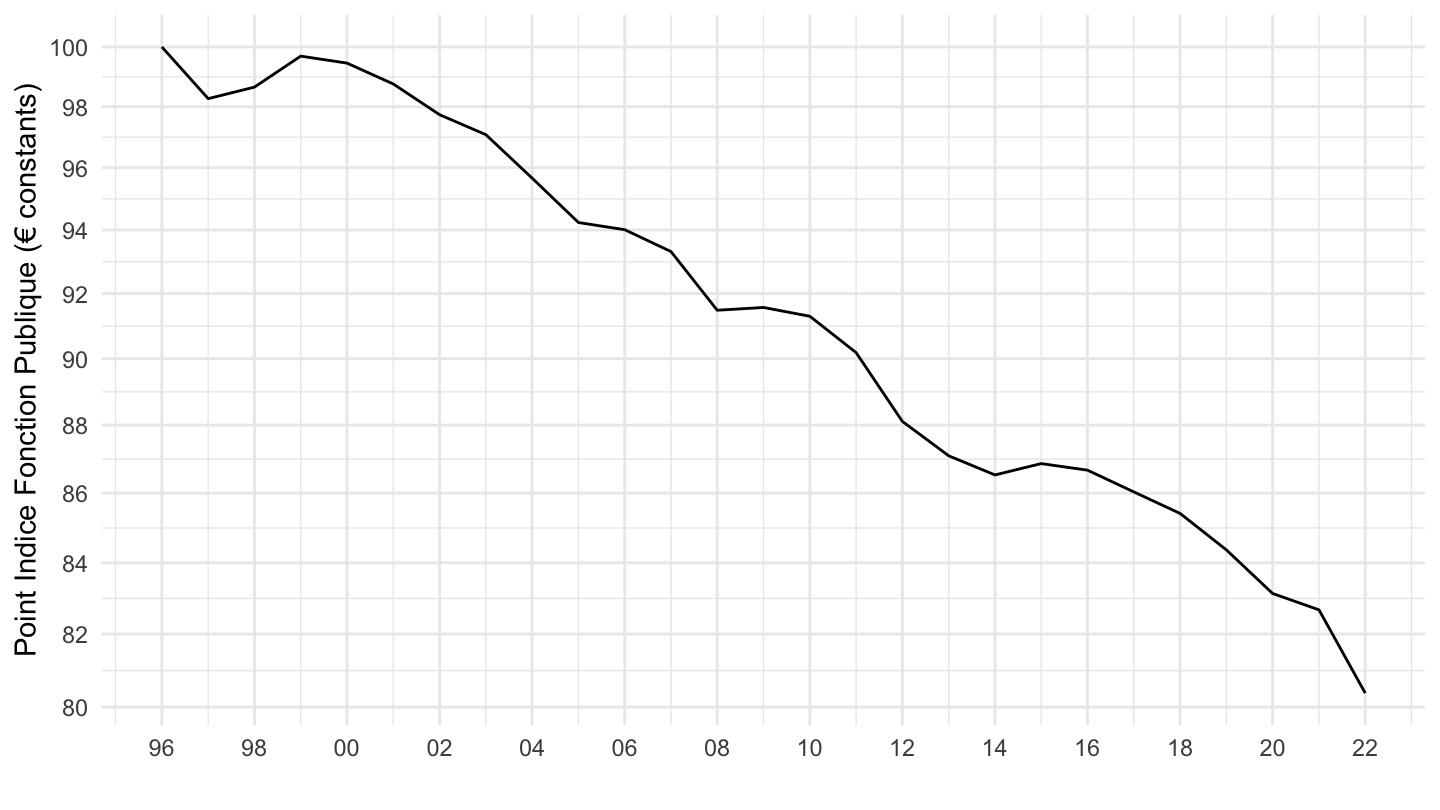
CPIH
All
indicefp %>%
  select(date, point_indice_en_euros) %>%
  add_row(date = as.Date("2022-01-01"), point_indice_en_euros = 56.23230) %>%
  arrange(desc(date)) %>%
  gather(variable, value, -date) %>%
  group_by(variable) %>%
  complete(date = seq.Date(min(date), max(date), by = "day")) %>%
  fill(value) %>%
  filter(month(date) == 1,
         day(date) == 1) %>%
  left_join(cpi2, by = "date") %>%
  filter(date >= as.Date("1996-01-01")) %>%
  mutate(value = value/cpih,
         value = 100*value/value[1]) %>%
  ggplot() + geom_line(aes(x = date, y = value)) + theme_minimal() +
  scale_x_date(breaks = seq(1920, 2025, 2) %>% paste0("-01-01") %>% as.Date,
               labels = date_format("%y")) +
  scale_y_log10(breaks = seq(0, 200, 2)) +
  ylab("Point Indice Fonction Publique (€ constants)") + xlab("")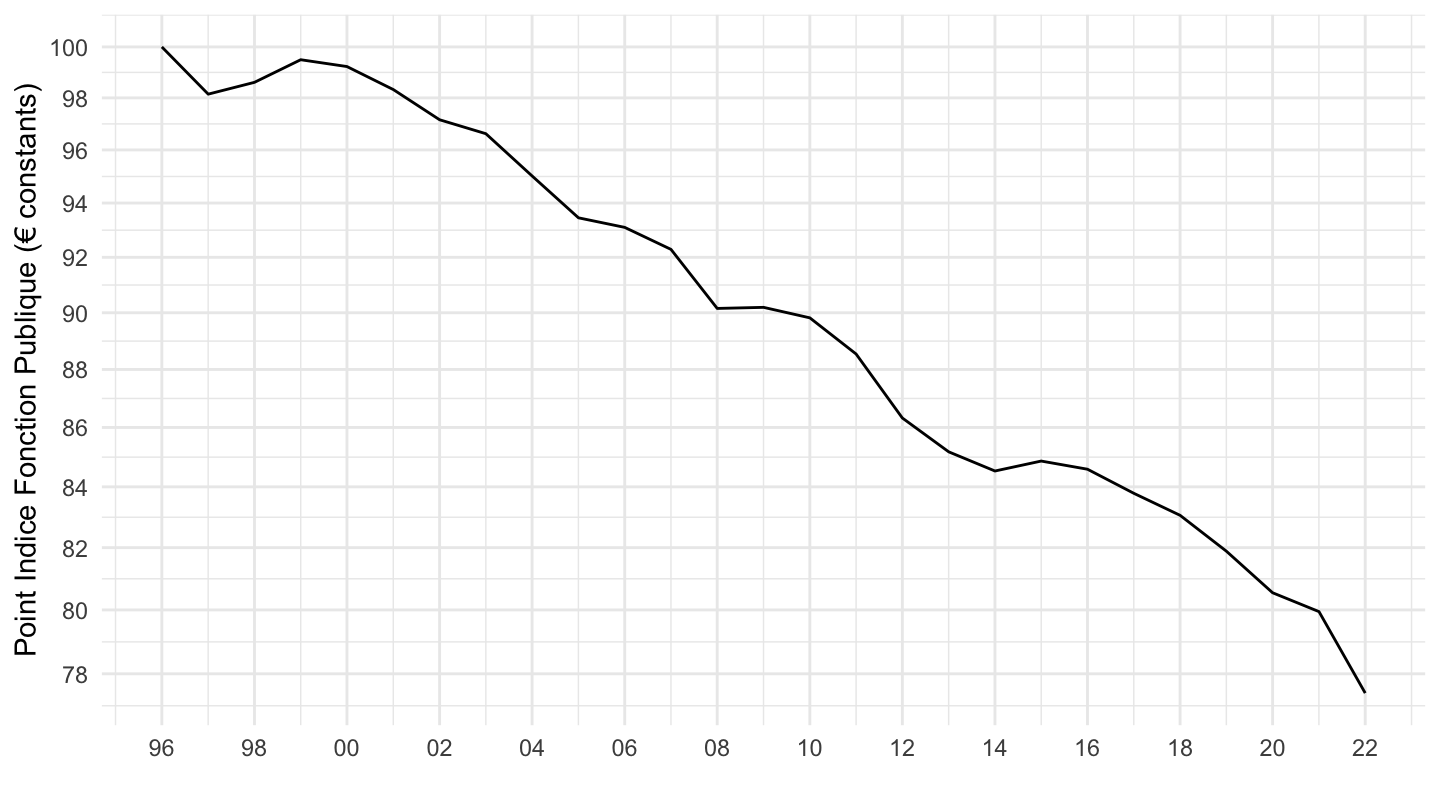
in %
data_alter_eco <- indicefp %>%
  select(date, point_indice_en_euros) %>%
  add_row(date = as.Date("2022-01-01"), point_indice_en_euros = 56.23230) %>%
  arrange(desc(date)) %>%
  gather(variable, value, -date) %>%
  group_by(variable) %>%
  complete(date = seq.Date(min(date), max(date), by = "day")) %>%
  fill(value) %>%
  ungroup %>%
  filter(month(date) == 1,
         day(date) == 1) %>%
  left_join(cpi2, by = "date") %>%
  filter(date >= as.Date("1996-01-01")) %>%
  transmute(date,
            value_cpih = value/cpih,
            value_cpi = value/cpi) %>%
  transmute(date,
            `Valeur du Point d'Indice de la Fonction Publique par rapport à 1996 (IPCH, Eurostat)` = value_cpih/value_cpih[1]-1,
            `Valeur du Point d'Indice de la Fonction Publique par rapport à 1996 (IPC, INSEE)` = value_cpi/value_cpi[1]-1)

write_csv(data_alter_eco, file = "data_alter_eco.csv")

data_alter_eco %>%
  gather(variable, value, -date) %>%
  ggplot() + geom_line(aes(x = date, y = value, color = variable)) + theme_minimal() +
  scale_x_date(breaks = seq(1920, 2025, 2) %>% paste0("-01-01") %>% as.Date,
               labels = date_format("%Y")) +
  scale_color_manual(values = viridis(3)[1:2]) +
  theme(legend.position = c(0.43, 0.1),
        legend.title = element_blank()) +
  scale_y_continuous(breaks = 0.01*seq(-200, 200, 2),
                     labels = percent_format(acc = 1)) +
  ylab("Valeur du Point Indice Fonction Publique vs. 1996") + xlab("")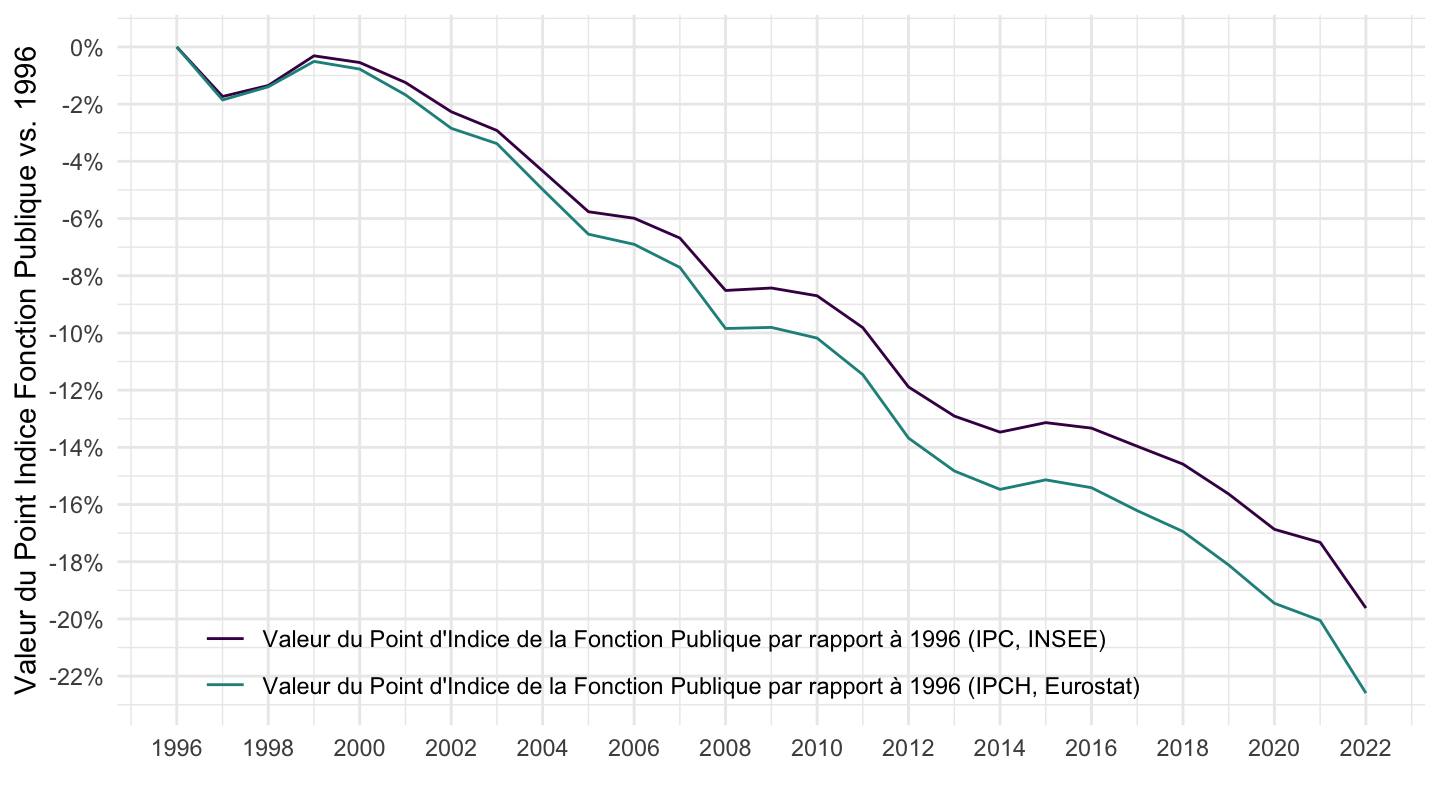
in %
indicefp %>%
  select(date, point_indice_en_euros) %>%
  add_row(date = as.Date("2022-01-01"), point_indice_en_euros = 56.23230) %>%
  arrange(desc(date)) %>%
  gather(variable, value, -date) %>%
  group_by(variable) %>%
  complete(date = seq.Date(min(date), max(date), by = "day")) %>%
  fill(value) %>%
  ungroup %>%
  filter(month(date) == 1,
         day(date) == 1) %>%
  left_join(cpi2, by = "date") %>%
  filter(date >= as.Date("1996-01-01")) %>%
  transmute(date,
            value_cpih = value/cpih,
            value_cpi = value/cpi) %>%
  transmute(date,
            `Valeur réelle du Point d'Indice par rapport à 1996` = value_cpih/value_cpih[1]-1) %>%
  gather(variable, value, -date) %>%
  ggplot() + geom_line(aes(x = date, y = value)) + theme_minimal() +
  scale_x_date(breaks = seq(1920, 2025, 2) %>% paste0("-01-01") %>% as.Date,
               labels = date_format("%Y")) +
  scale_color_manual(values = viridis(3)[1:2]) +
  theme(legend.position = c(0.43, 0.1),
        legend.title = element_blank()) +
  scale_y_continuous(breaks = 0.01*seq(-200, 200, 2),
                     labels = percent_format(acc = 1)) +
  ylab("Valeur du Point Indice vs. 1996") + xlab("") +
  labs(title = "Valeur réelle du Point Indice de la Fonction Publique par rapport à 1996",
              subtitle = "(Indice des prix utilisé: Indice des Prix à la Consommation Harmonisé (IPCH))")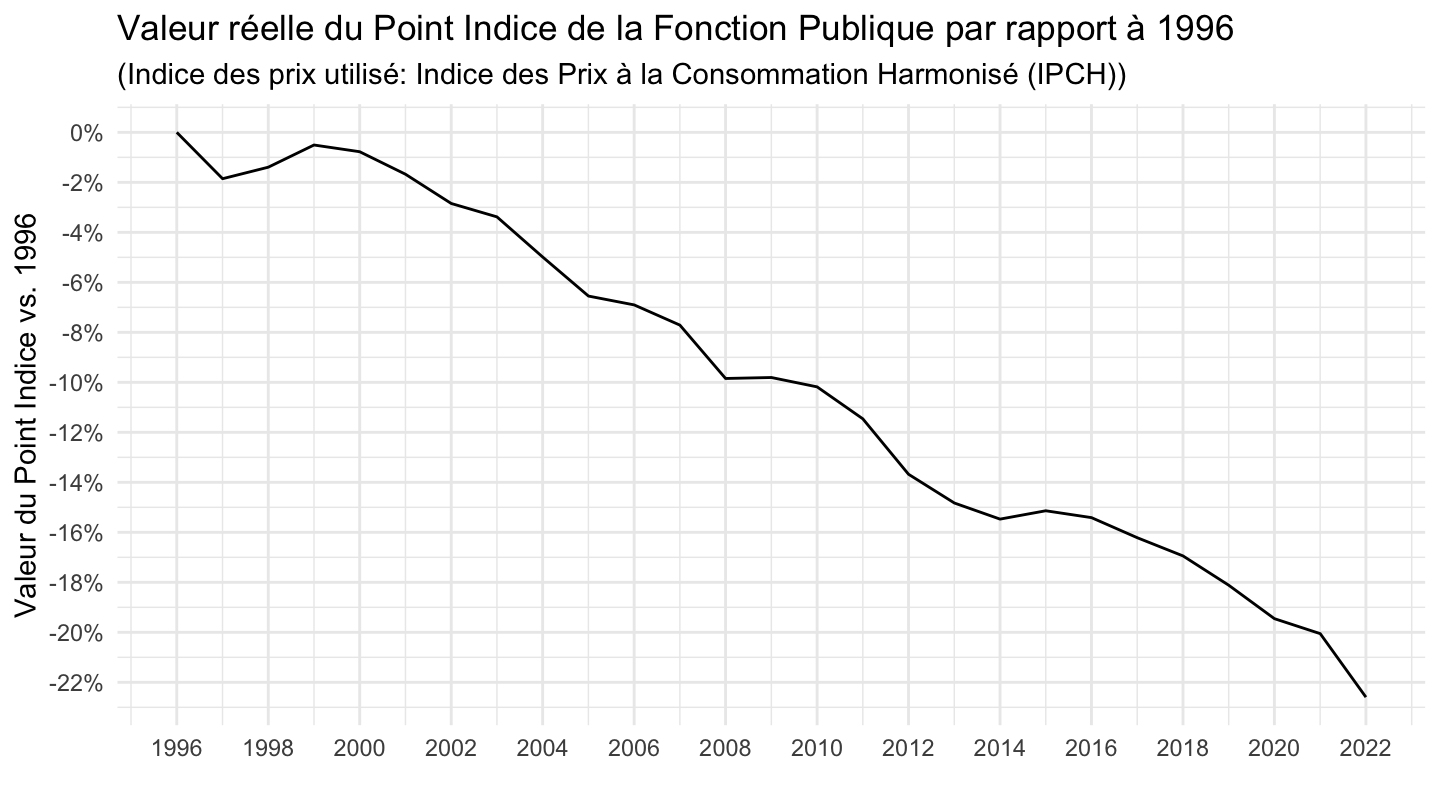
2010-2018
Annuel
indicefp %>%
  select(date, point_indice_en_euros) %>%
  add_row(date = as.Date("2022-01-01"), point_indice_en_euros = 56.23230) %>%
  arrange(desc(date)) %>%
  gather(variable, value, -date) %>%
  group_by(variable) %>%
  complete(date = seq.Date(min(date), max(date), by = "day")) %>%
  fill(value) %>%
  filter(month(date) == 1,
         day(date) == 1) %>%
  left_join(cpi, by = "date") %>%
  filter(date >= as.Date("2010-01-01"),
         date <= as.Date("2018-01-01")) %>%
  mutate(value = value/cpi,
         value = 100*value/value[1]) %>%
  ggplot() + geom_line(aes(x = date, y = value)) + theme_minimal() +
  scale_x_date(breaks = seq(1920, 2025, 1) %>% paste0("-01-01") %>% as.Date,
               labels = date_format("%Y")) +
  scale_y_log10(breaks = seq(0, 200, 1)) +
  ylab("Point Indice Fonction Publique (euros constants)") + xlab("")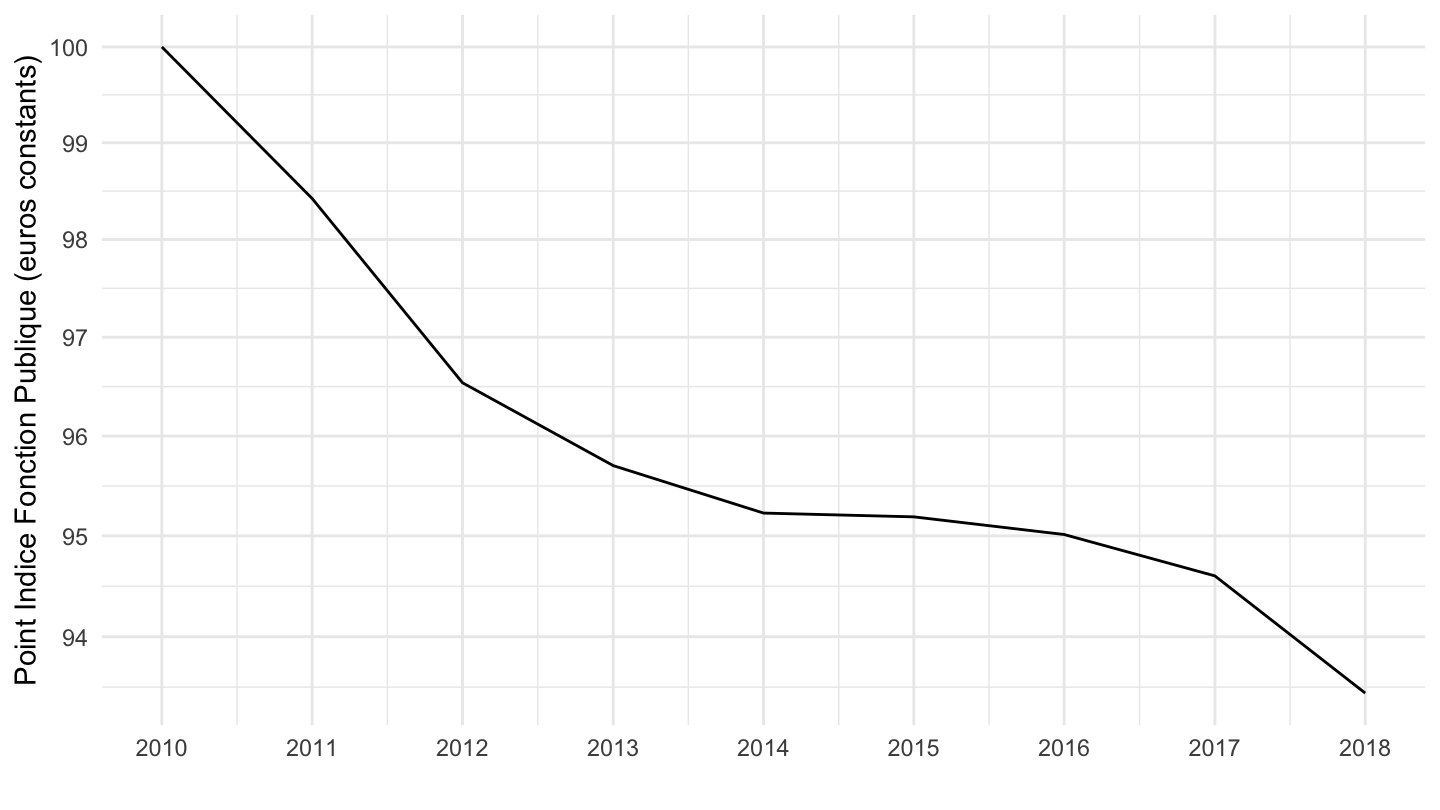
Indice Fonction Publique
All
Valeur
indicefp %>%
  select(date, point_indice_en_euros) %>%
  gather(variable, value, -date) %>%
  group_by(variable) %>%
  complete(date = seq.Date(min(date), max(date), by = "day")) %>%
  fill(value) %>%
  ggplot() + geom_line(aes(x = date, y = value)) +
  scale_color_manual(values = viridis(8)[1:7]) +
  theme_minimal() +
  scale_x_date(breaks = seq(1920, 2025, 5) %>% paste0("-01-01") %>% as.Date,
               labels = date_format("%y")) +
  theme(legend.position = c(0.3, 0.8),
        legend.title = element_blank()) +
  scale_y_log10(breaks = seq(0, 200, 5),
                     labels = dollar_format(accuracy = 1, suffix = " € / point", prefix = "")) +
  ylab("Point Indice Fonction Publique (euros)") + xlab("")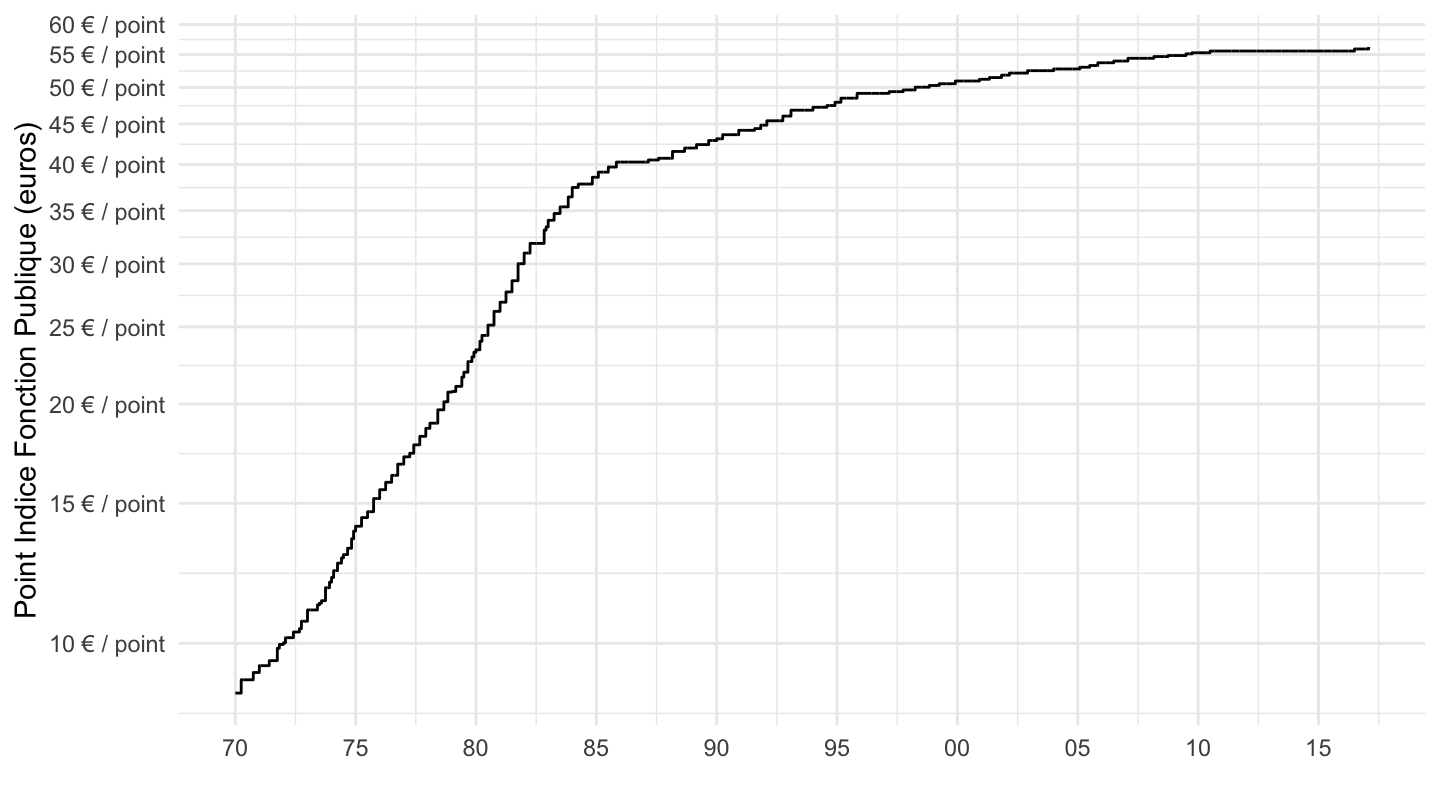
Base 100
indicefp %>%
  select(date, point_indice_en_euros) %>%
  gather(variable, value, -date) %>%
  group_by(variable) %>%
  complete(date = seq.Date(min(date), max(date), by = "day")) %>%
  fill(value) %>%
  mutate(value = 100*value/value[1]) %>%
  ggplot() + geom_line(aes(x = date, y = value)) +
  theme_minimal() +
  scale_x_date(breaks = seq(1920, 2025, 5) %>% paste0("-01-01") %>% as.Date,
               labels = date_format("%y")) +
  theme(legend.position = c(0.3, 0.8),
        legend.title = element_blank()) +
  scale_y_log10(breaks = seq(0, 1000, 50)) +
  ylab("Point Indice Fonction Publique") + xlab("")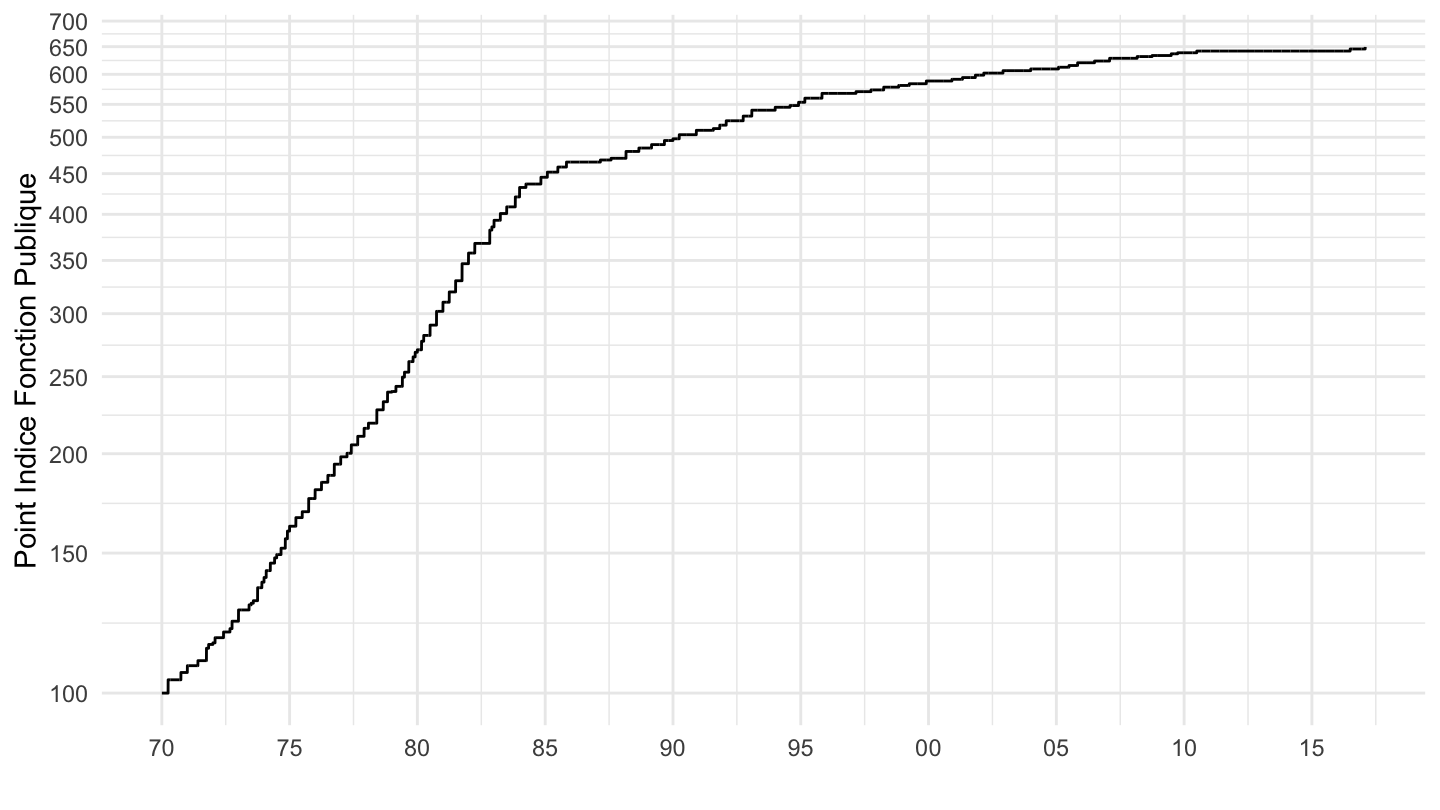
1970-1990
Valeur
indicefp %>%
  select(date, point_indice_en_euros) %>%
  gather(variable, value, -date) %>%
  group_by(variable) %>%
  complete(date = seq.Date(min(date), max(date), by = "day")) %>%
  fill(value) %>%
  filter(date >= as.Date("1970-01-01"),
         date <= as.Date("1990-01-01")) %>%
  ggplot() + geom_line(aes(x = date, y = value)) +
  theme_minimal() + ylab("Point Indice Fonction Publique (euros)") + xlab("") +
  scale_x_date(breaks = seq(1920, 2025, 2) %>% paste0("-01-01") %>% as.Date,
               labels = date_format("%y")) +
  scale_y_log10(breaks = seq(0, 200, 4),
                     labels = dollar_format(accuracy = 1, suffix = " € / point", prefix = ""))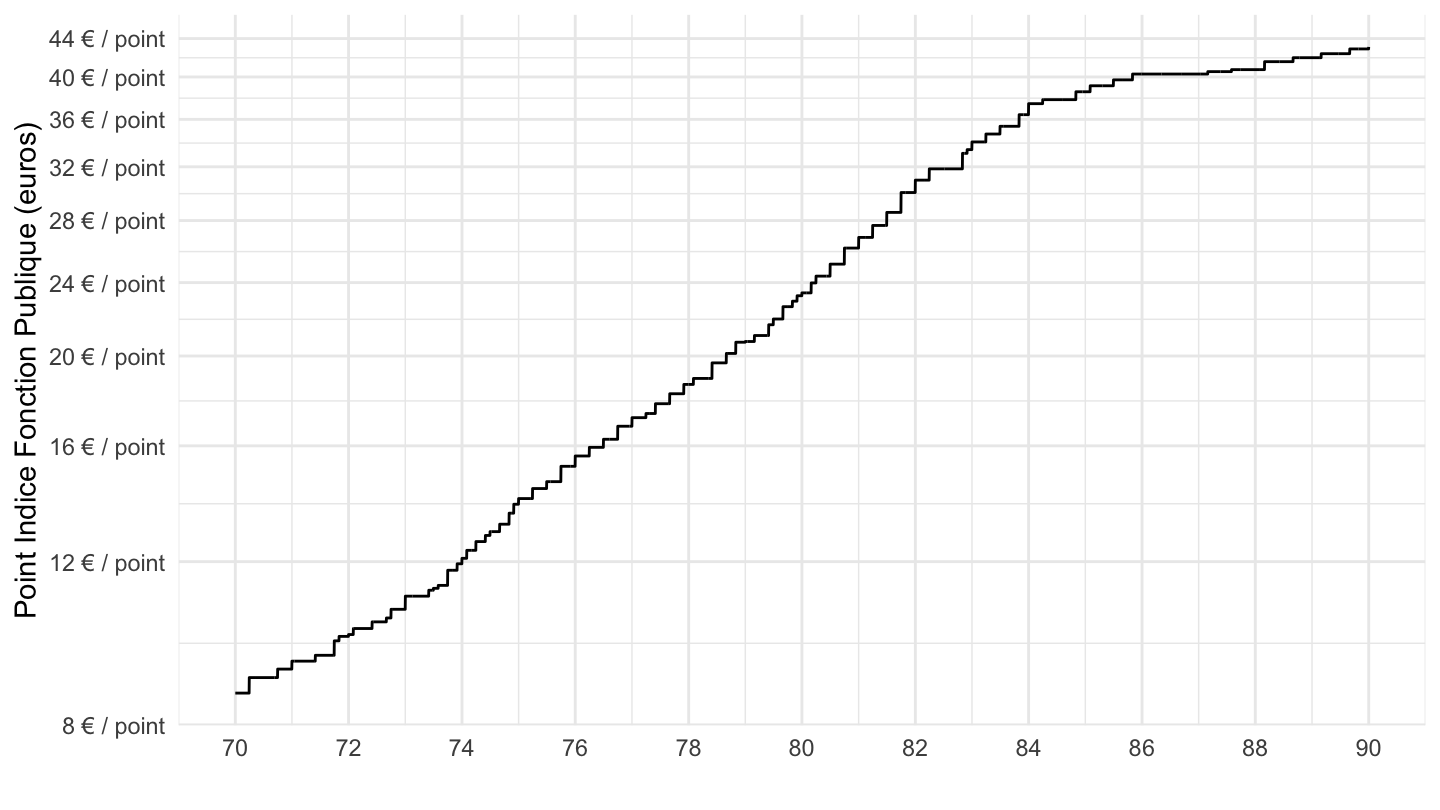
Base 100
indicefp %>%
  select(date, point_indice_en_euros) %>%
  gather(variable, value, -date) %>%
  group_by(variable) %>%
  complete(date = seq.Date(min(date), max(date), by = "day")) %>%
  fill(value) %>%
  filter(date >= as.Date("1970-01-01"),
         date <= as.Date("1990-01-01")) %>%
  mutate(value = 100*value/value[1]) %>%
  ggplot() + geom_line(aes(x = date, y = value)) +
  theme_minimal() + ylab("Point Indice Fonction Publique") + xlab("") +
  scale_x_date(breaks = seq(1920, 2025, 2) %>% paste0("-01-01") %>% as.Date,
               labels = date_format("%y")) +
  scale_y_log10(breaks = seq(0, 1000, 20))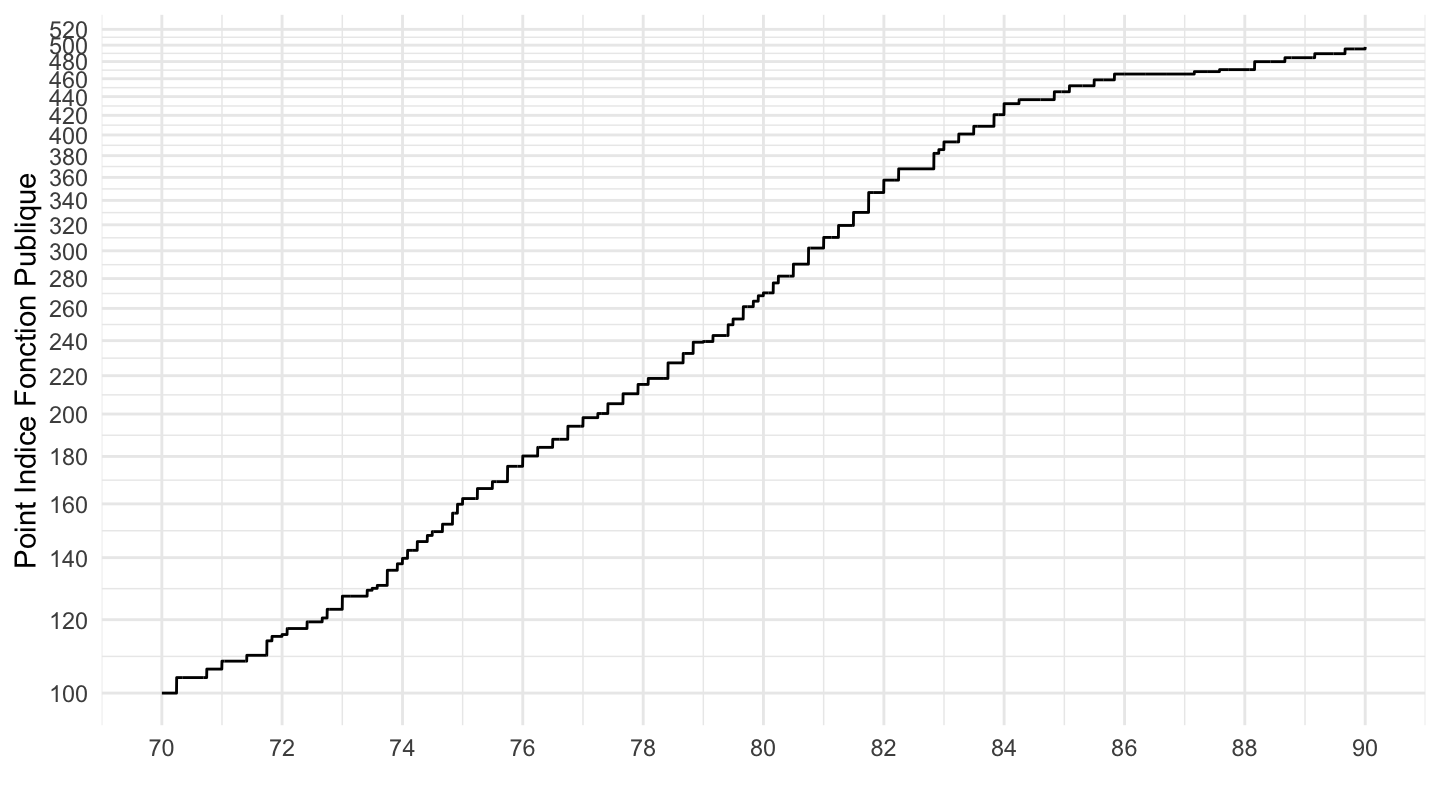
1990-
Valeur
indicefp %>%
  select(date, point_indice_en_euros) %>%
  gather(variable, value, -date) %>%
  group_by(variable) %>%
  complete(date = seq.Date(min(date), max(date), by = "day")) %>%
  fill(value) %>%
  filter(date >= as.Date("1990-01-01")) %>%
  ggplot() + geom_line(aes(x = date, y = value)) +
  theme_minimal() + ylab("Point Indice Fonction Publique (euros)") + xlab("") +
  scale_x_date(breaks = seq(1920, 2025, 2) %>% paste0("-01-01") %>% as.Date,
               labels = date_format("%y")) +
  scale_y_log10(breaks = seq(0, 200, 1),
                     labels = dollar_format(accuracy = 1, suffix = " € / point", prefix = ""))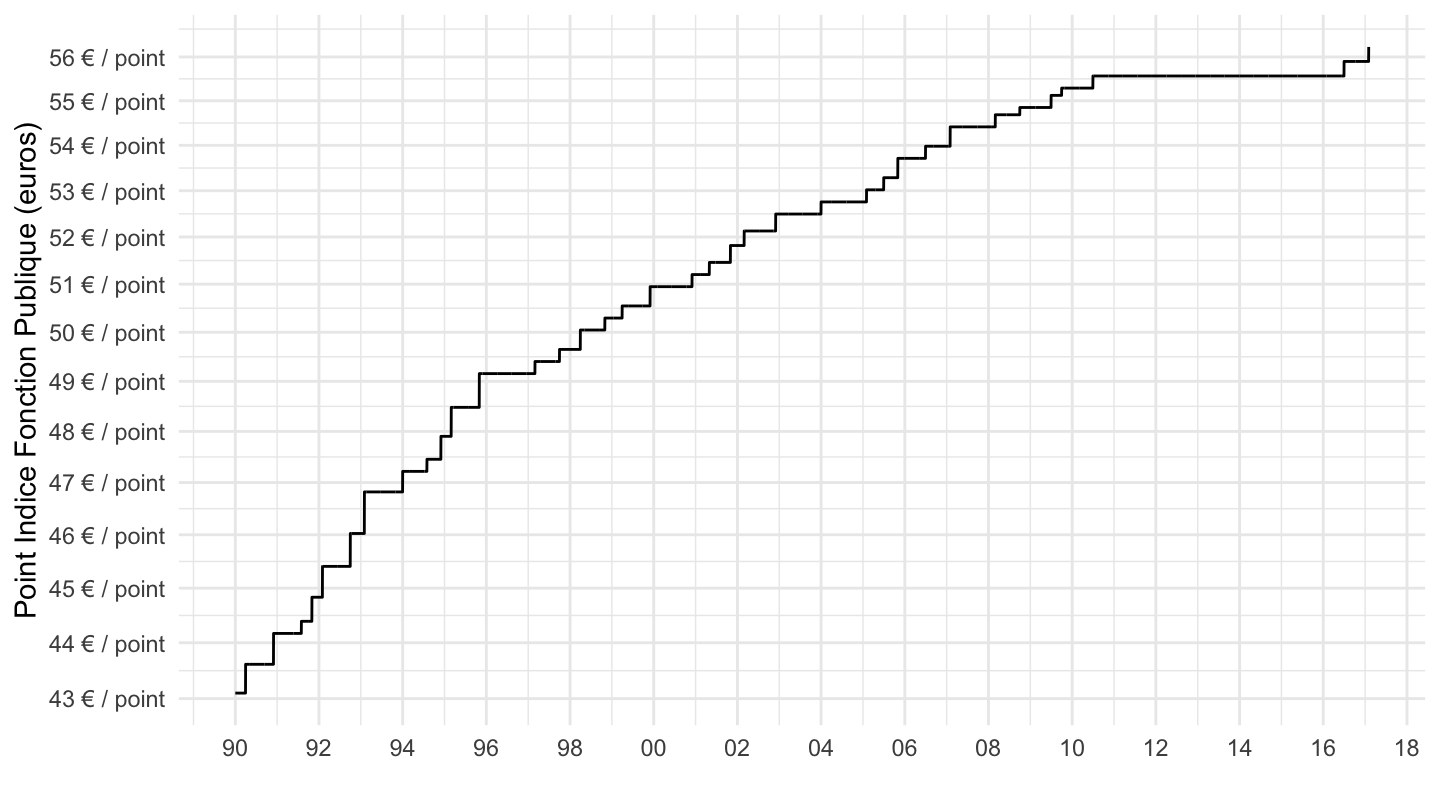
Base 100
indicefp %>%
  select(date, point_indice_en_euros) %>%
  gather(variable, value, -date) %>%
  group_by(variable) %>%
  complete(date = seq.Date(min(date), max(date), by = "day")) %>%
  fill(value) %>%
  filter(date >= as.Date("1990-01-01")) %>%
  mutate(value = 100*value/value[1]) %>%
  ggplot() + geom_line(aes(x = date, y = value)) +
  theme_minimal() + ylab("Point Indice Fonction Publique") + xlab("") +
  scale_x_date(breaks = seq(1920, 2025, 2) %>% paste0("-01-01") %>% as.Date,
               labels = date_format("%y")) +
  scale_y_log10(breaks = seq(0, 200, 5))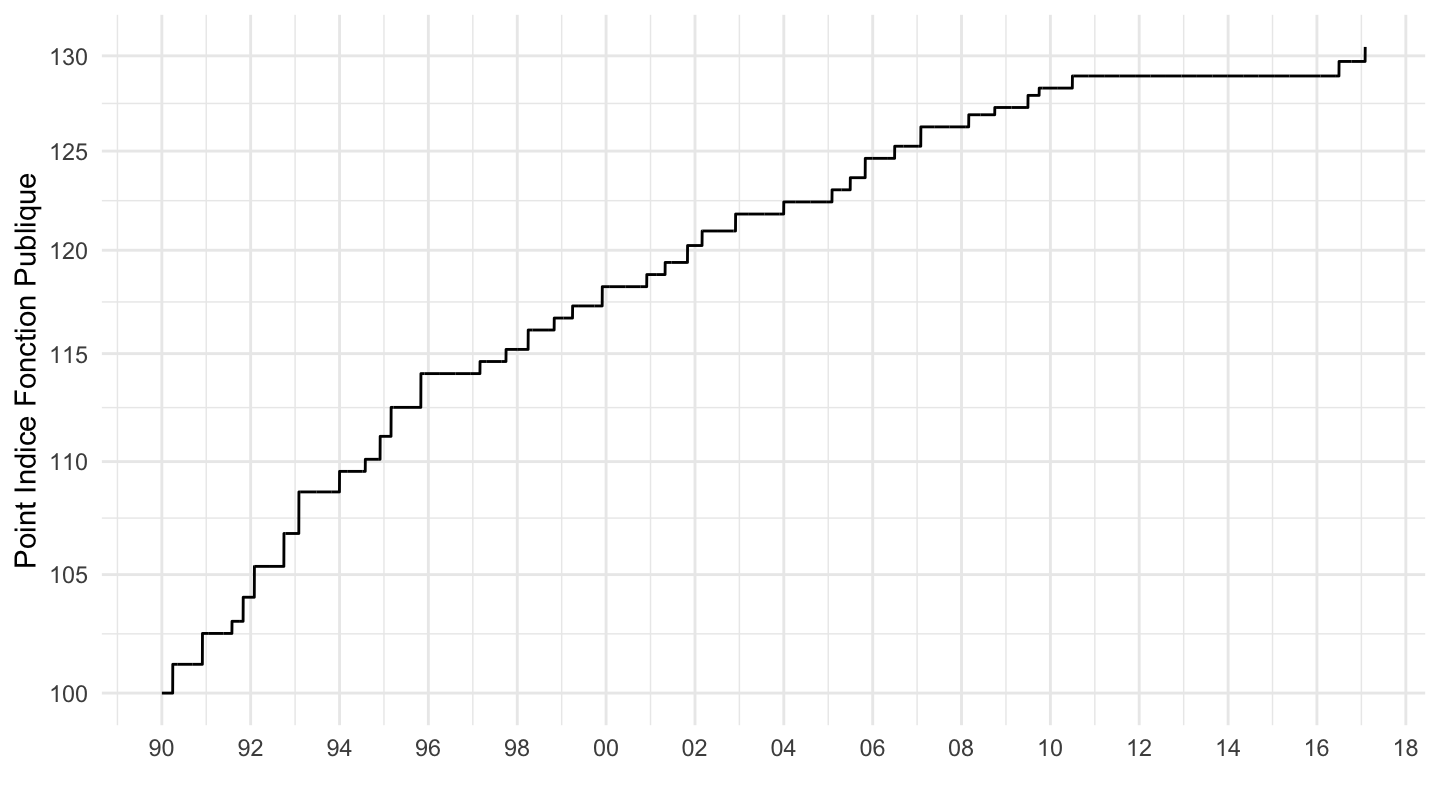
1992-
Valeur
indicefp %>%
  select(date, point_indice_en_euros) %>%
  gather(variable, value, -date) %>%
  group_by(variable) %>%
  complete(date = seq.Date(min(date), max(date), by = "day")) %>%
  fill(value) %>%
  filter(date >= as.Date("1992-01-01")) %>%
  ggplot() + geom_line(aes(x = date, y = value)) +
  theme_minimal() + ylab("Point Indice Fonction Publique (euros)") + xlab("") +
  scale_x_date(breaks = seq(1920, 2025, 2) %>% paste0("-01-01") %>% as.Date,
               labels = date_format("%y")) +
  scale_y_log10(breaks = seq(0, 200, 1),
                     labels = dollar_format(accuracy = 1, suffix = " € / point", prefix = ""))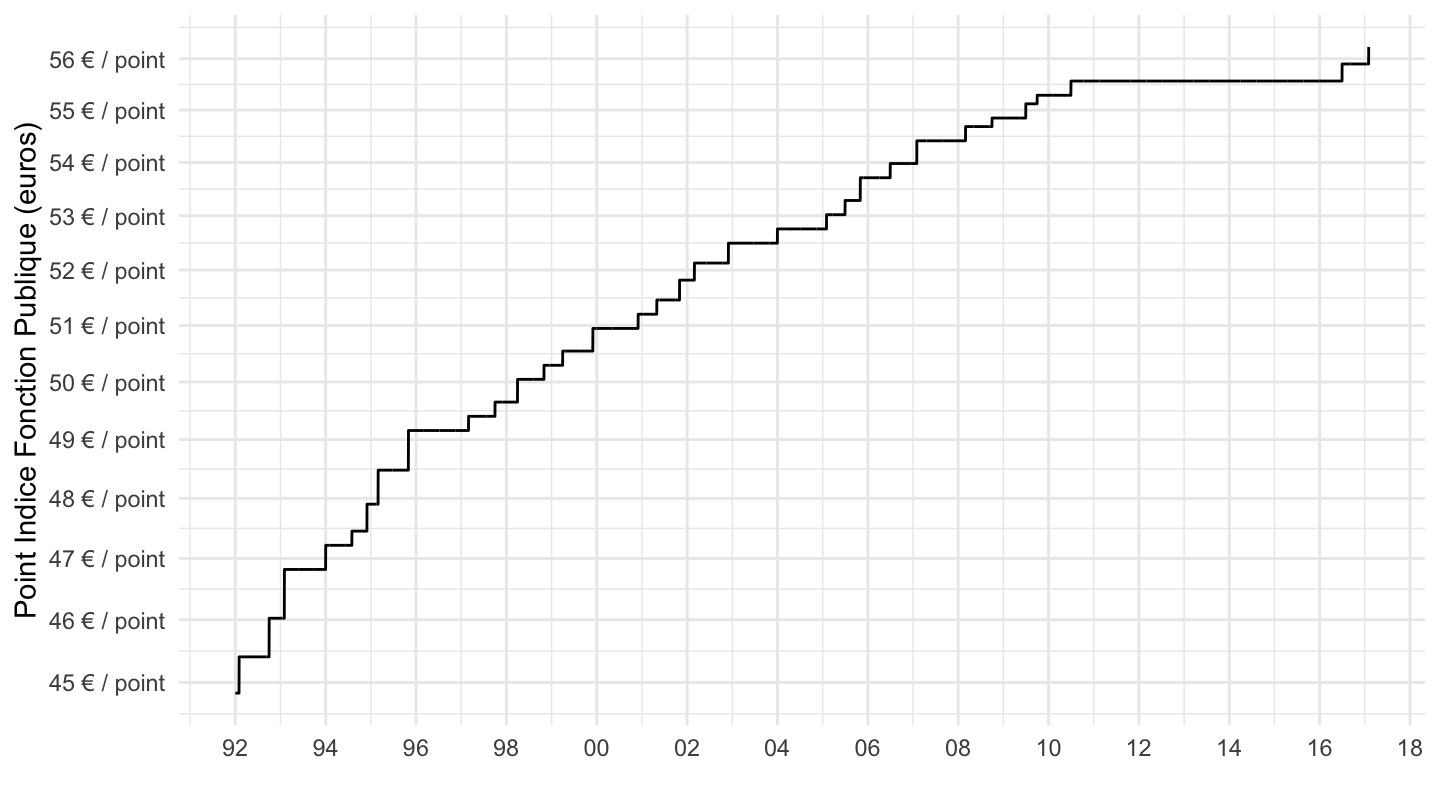
Base 100
indicefp %>%
  select(date, point_indice_en_euros) %>%
  gather(variable, value, -date) %>%
  group_by(variable) %>%
  complete(date = seq.Date(min(date), max(date), by = "day")) %>%
  fill(value) %>%
  filter(date >= as.Date("1992-01-01")) %>%
  mutate(value = 100*value/value[1]) %>%
  ggplot() + geom_line(aes(x = date, y = value)) +
  theme_minimal() + ylab("Point Indice Fonction Publique (euros)") + xlab("") +
  scale_x_date(breaks = seq(1920, 2025, 2) %>% paste0("-01-01") %>% as.Date,
               labels = date_format("%y")) +
  scale_y_log10(breaks = seq(0, 200, 5))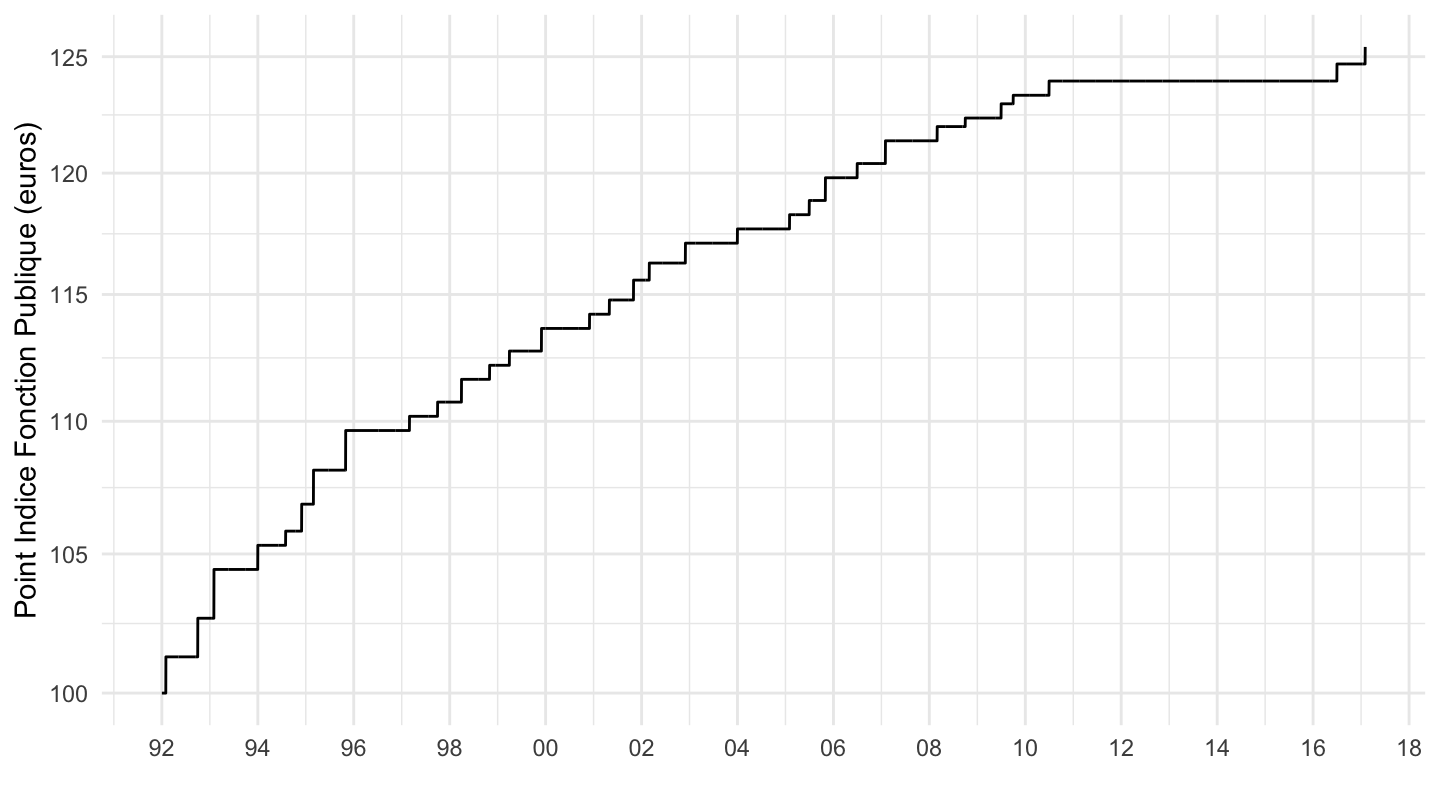
1996-
Valeur
indicefp %>%
  select(date, point_indice_en_euros) %>%
  gather(variable, value, -date) %>%
  group_by(variable) %>%
  complete(date = seq.Date(min(date), max(date), by = "day")) %>%
  fill(value) %>%
  filter(date >= as.Date("1996-01-01")) %>%
  ggplot() + geom_line(aes(x = date, y = value)) +
  theme_minimal() + ylab("Point Indice Fonction Publique (euros)") + xlab("") +
  scale_x_date(breaks = seq(1920, 2025, 2) %>% paste0("-01-01") %>% as.Date,
               labels = date_format("%y")) +
  scale_y_log10(breaks = seq(0, 200, 1),
                     labels = dollar_format(accuracy = 1, suffix = " € / point", prefix = ""))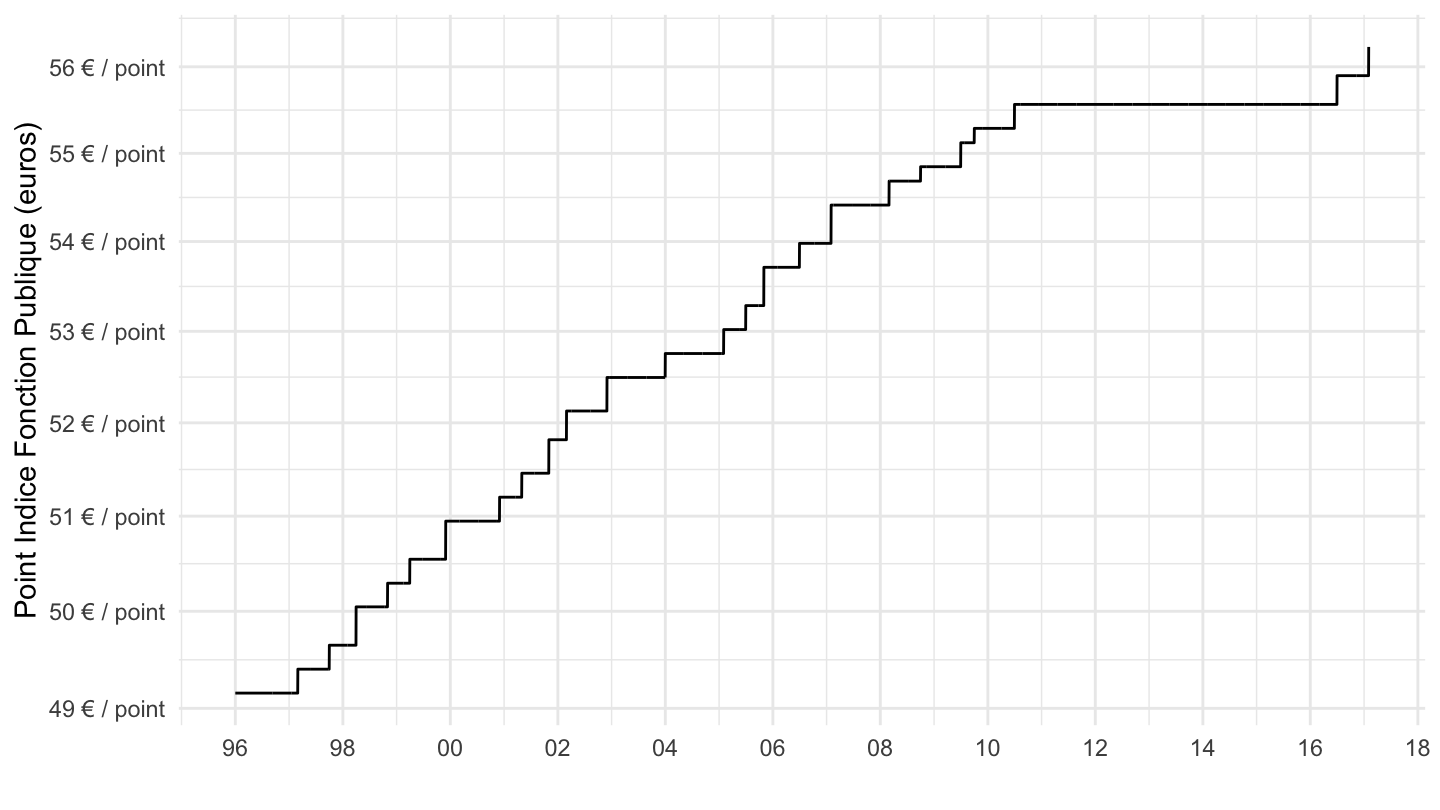
Base 100
indicefp %>%
  select(date, point_indice_en_euros) %>%
  gather(variable, value, -date) %>%
  group_by(variable) %>%
  complete(date = seq.Date(min(date), max(date), by = "day")) %>%
  fill(value) %>%
  filter(date >= as.Date("1996-01-01")) %>%
  mutate(value = 100*value/value[1]) %>%
  ggplot() + geom_line(aes(x = date, y = value)) +
  theme_minimal() + ylab("Point Indice Fonction Publique (euros)") + xlab("") +
  scale_x_date(breaks = seq(1920, 2025, 2) %>% paste0("-01-01") %>% as.Date,
               labels = date_format("%y")) +
  scale_y_log10(breaks = seq(0, 200, 5))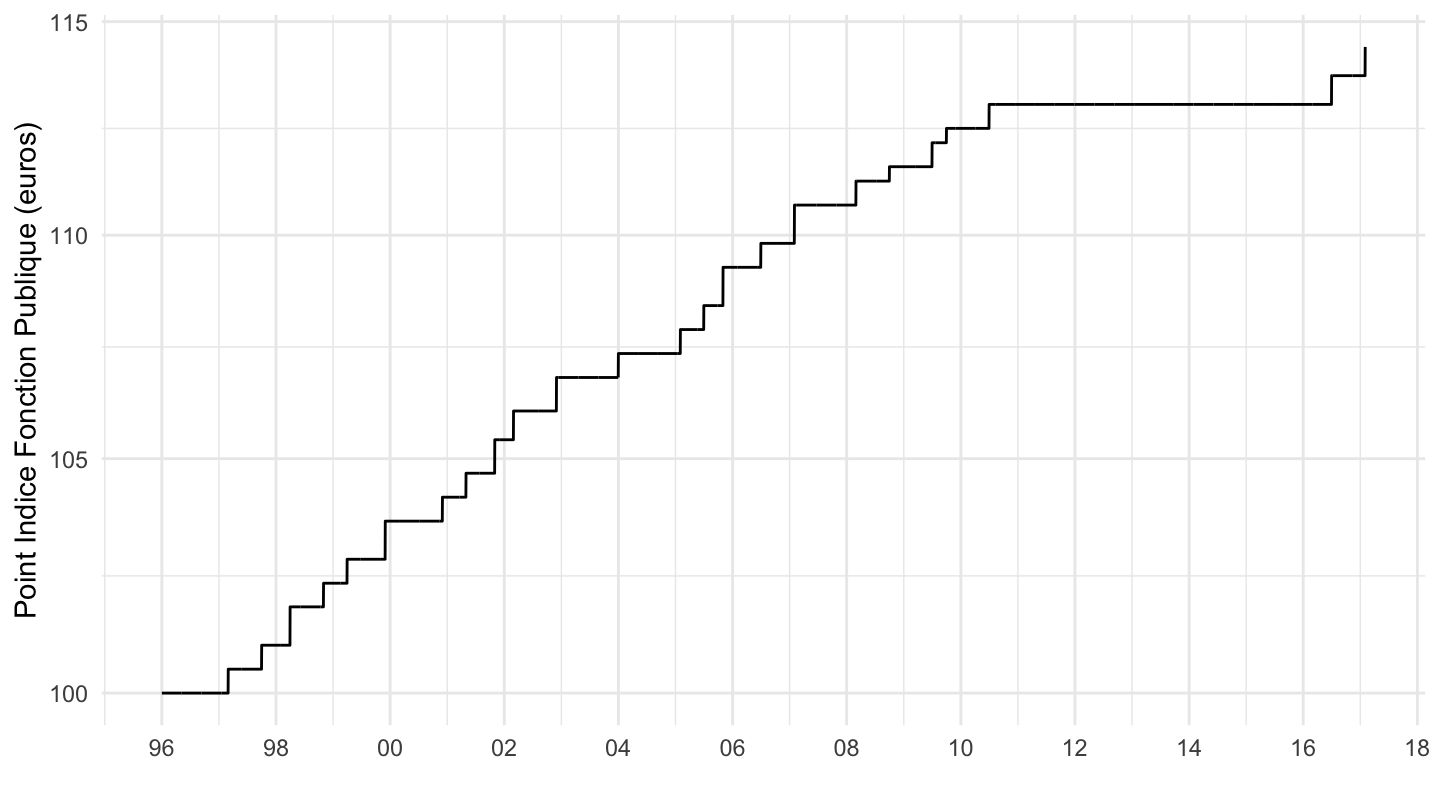
inflation
Graph
All
cpi %>%
  mutate(cpi = 100*cpi/cpi[date == as.Date("1951-01-01")]) %>%
  ggplot + geom_line(aes(x = date, y = cpi)) +
  scale_x_date(breaks = seq(1950, 2020, 5) %>% paste0("-01-01") %>% as.Date,
               labels = date_format("%y")) +
  scale_y_log10(breaks = c(100, 200, 300, 500, 800, 1000, 1200, 1500, 2000)) +
  theme_minimal() + xlab("") + ylab("")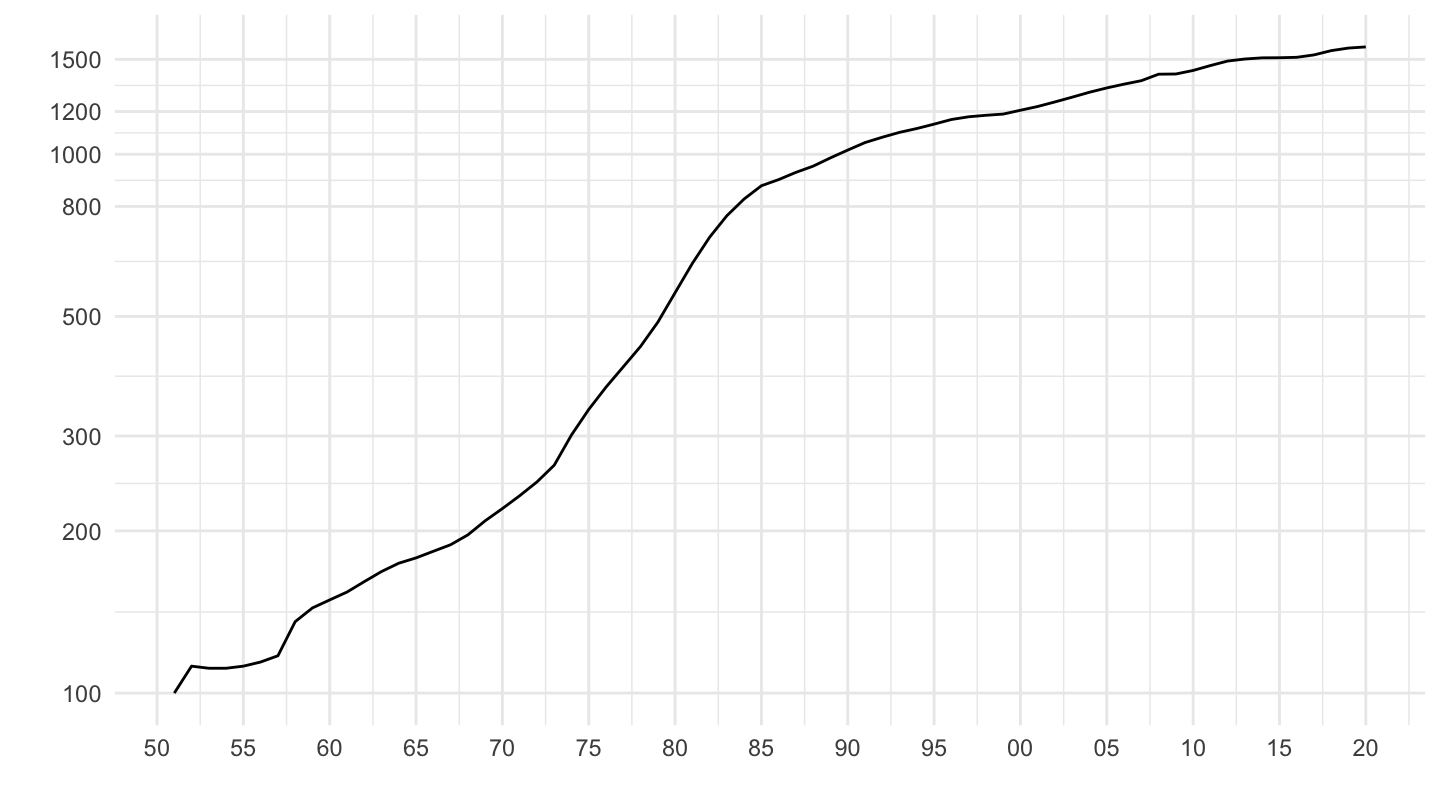
1990-
cpi %>%
  filter(date >= as.Date("1990-01-01")) %>%
  mutate(cpi = 100*cpi/cpi[date == as.Date("1990-01-01")]) %>%
  ggplot + geom_line(aes(x = date, y = cpi)) +
  scale_x_date(breaks = seq(1950, 2024, 5) %>% paste0("-01-01") %>% as.Date,
               labels = date_format("%y")) +
  scale_y_log10(breaks = seq(100, 200, 5)) +
  theme_minimal() + xlab("") + ylab("Inflation (100 = 1990)")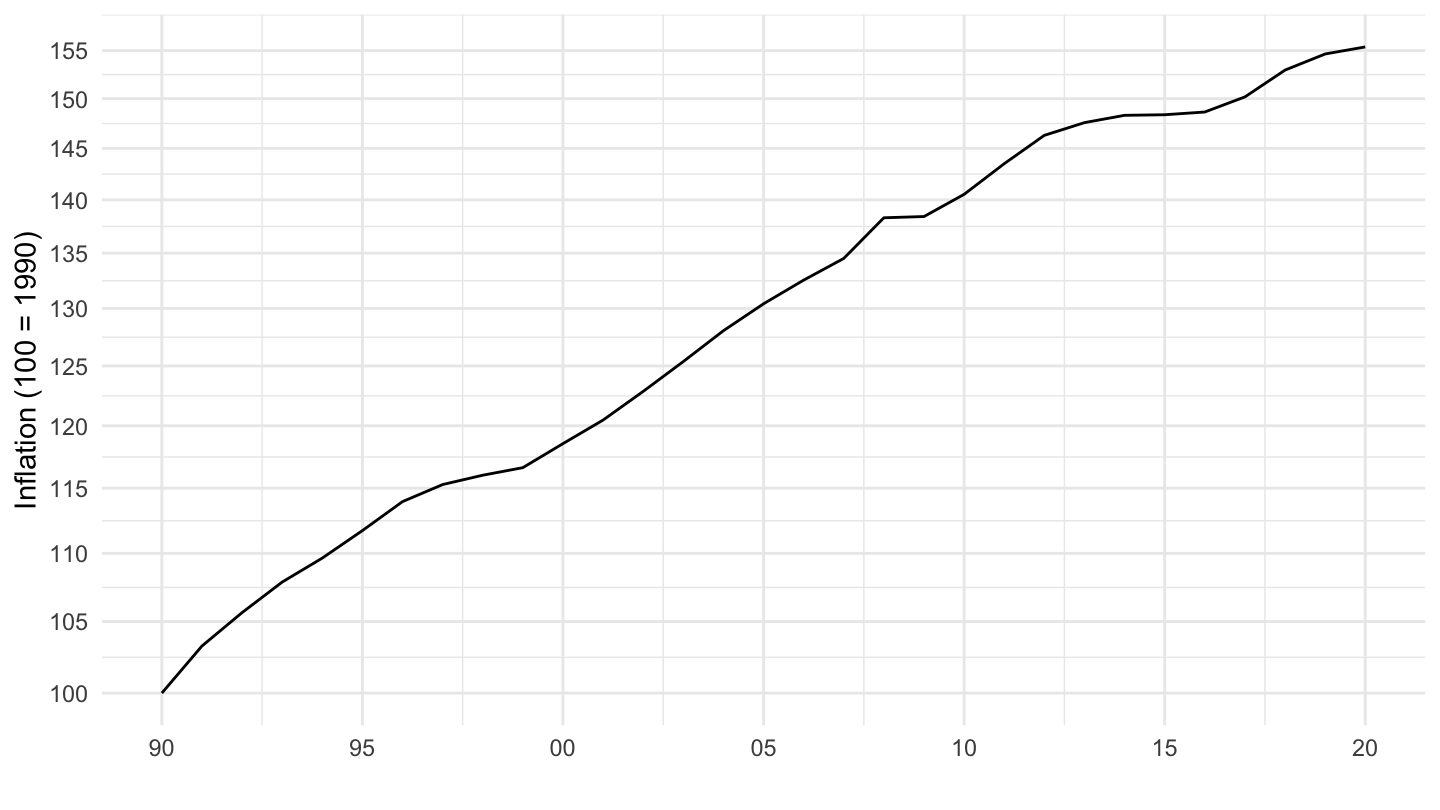
1995-
cpi %>%
  filter(date >= as.Date("1995-01-01")) %>%
  mutate(cpi = 100*cpi/cpi[date == as.Date("1995-01-01")]) %>%
  ggplot + geom_line(aes(x = date, y = cpi)) +
  scale_x_date(breaks = seq(1950, 2024, 5) %>% paste0("-01-01") %>% as.Date,
               labels = date_format("%y")) +
  scale_y_log10(breaks = seq(100, 200, 5)) +
  theme_minimal() + xlab("") + ylab("Inflation (100 = 1995)")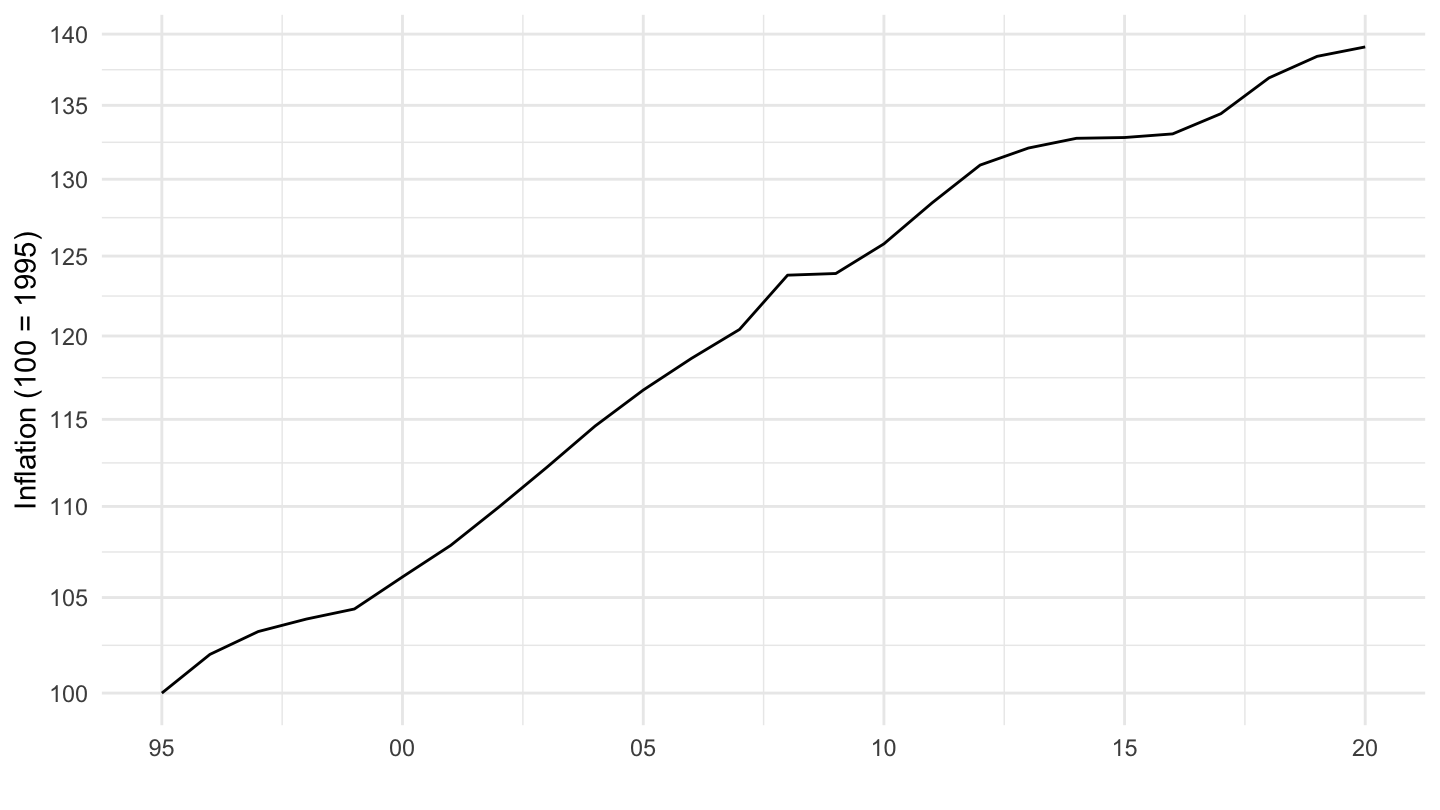
1996-
cpi %>%
  filter(date >= as.Date("1996-01-01")) %>%
  mutate(cpi = 100*cpi/cpi[date == as.Date("1996-01-01")]) %>%
  ggplot + geom_line(aes(x = date, y = cpi)) +
  scale_x_date(breaks = seq(1950, 2024, 2) %>% paste0("-01-01") %>% as.Date,
               labels = date_format("%y")) +
  scale_y_log10(breaks = seq(100, 200, 5)) +
  theme_minimal() + xlab("") + ylab("Inflation (100 = 1996)")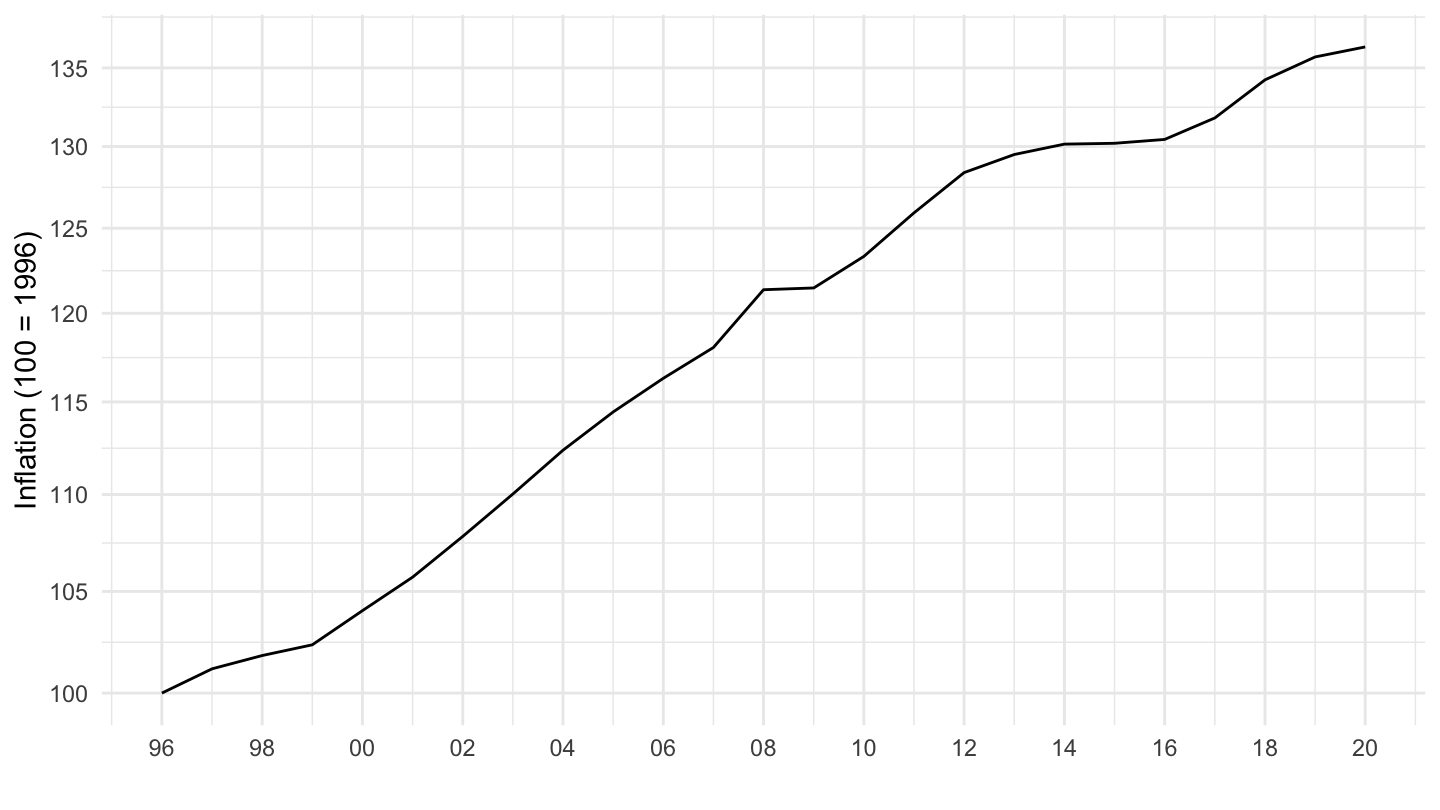
2000-
cpi %>%
  filter(date >= as.Date("2000-01-01")) %>%
  mutate(cpi = 100*cpi/cpi[date == as.Date("2000-01-01")]) %>%
  ggplot + geom_line(aes(x = date, y = cpi)) +
  scale_x_date(breaks = seq(1950, 2020, 2) %>% paste0("-01-01") %>% as.Date,
               labels = date_format("%y")) +
  scale_y_log10(breaks = seq(100, 200, 5)) +
  theme_minimal() + xlab("") + ylab("Inflation (100 = 2000)")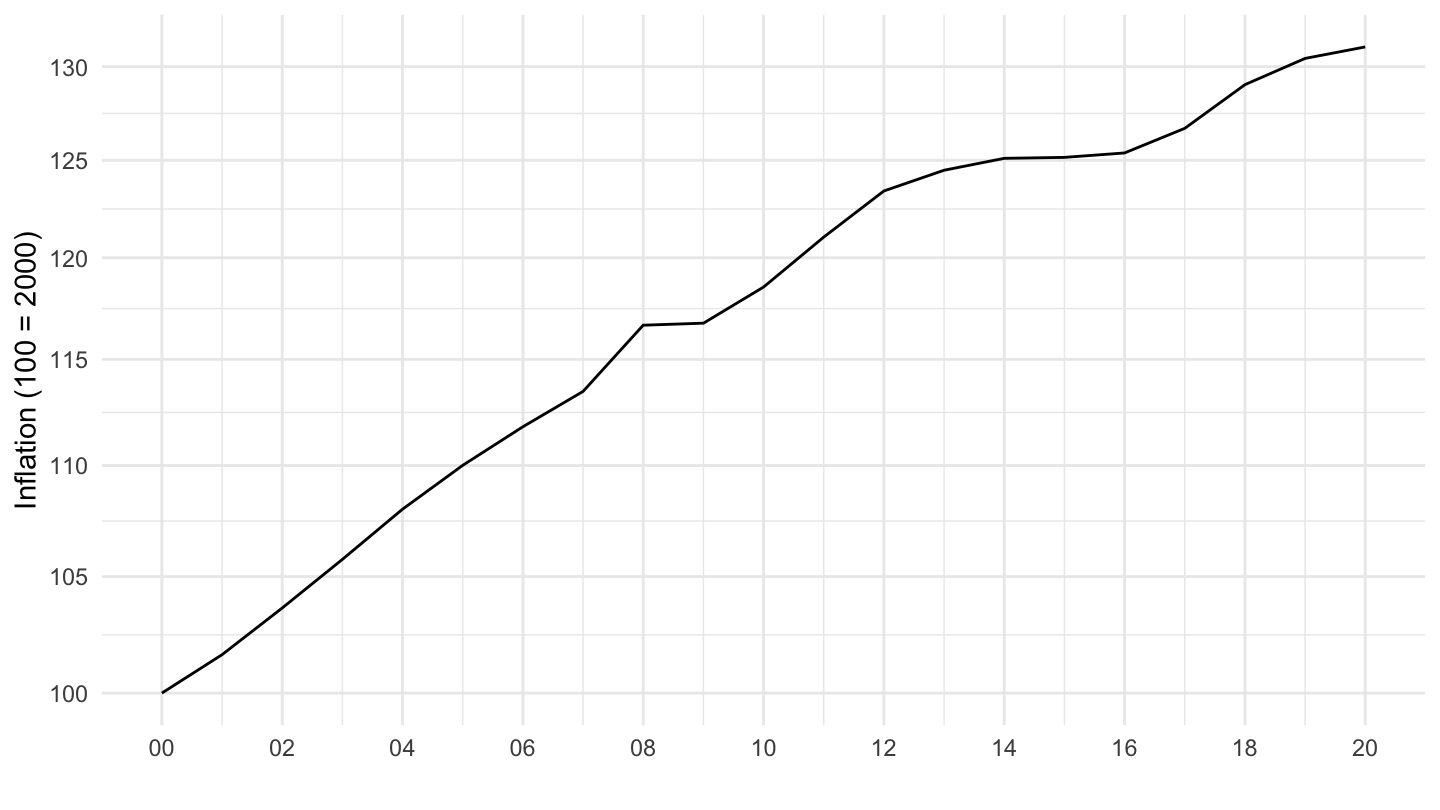
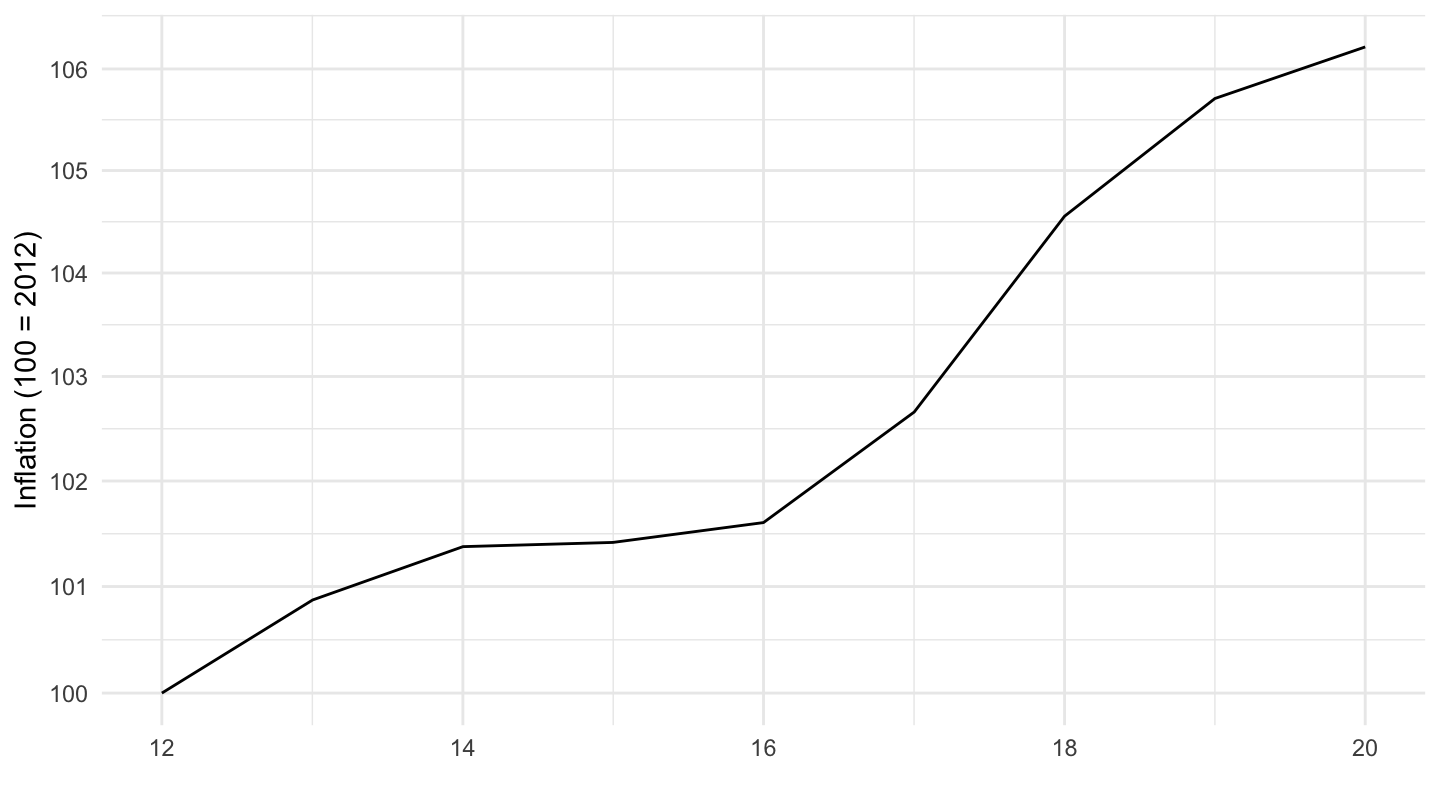
2012-
cpi %>%
  filter(date >= as.Date("2012-01-01")) %>%
  mutate(cpi = 100*cpi/cpi[date == as.Date("2012-01-01")]) %>%
  ggplot + geom_line(aes(x = date, y = cpi)) +
  scale_x_date(breaks = seq(1950, 2024, 2) %>% paste0("-01-01") %>% as.Date,
               labels = date_format("%y")) +
  scale_y_log10(breaks = seq(100, 200, 1)) +
  theme_minimal() + xlab("") + ylab("Inflation (100 = 2012)")