Indices France - indices_FRA
Data - Investing
François Geerolf
Nobs
indices_FRA %>%
  left_join(indices_FRA_var, by = "symbol") %>%
  group_by(symbol, full_name) %>%
  summarise(Nobs = n()) %>%
  {if (is_html_output()) datatable(., filter = 'top', rownames = F) else .}
Cac 40, Total Return
All
indices_FRA %>%
  filter(symbol %in% c("FCHI", "PX1GR")) %>%
  left_join(indices_FRA_var, by = "symbol") %>%
  group_by(symbol) %>%
  mutate(Close = Close / Close[1]) %>%
  ggplot + geom_line(aes(x = Date, y = Close, color = name)) +
  theme_minimal() + xlab("") + ylab("") +
  scale_x_date(breaks = seq(1960, 2022, 2) %>% paste0("-01-01") %>% as.Date,
               labels = date_format("%y")) +
  scale_y_log10(breaks = seq(0, 20, 1)) +
  scale_color_manual(values = viridis(5)[1:4]) +
  theme(legend.position = c(0.2, 0.85),
        legend.title = element_blank())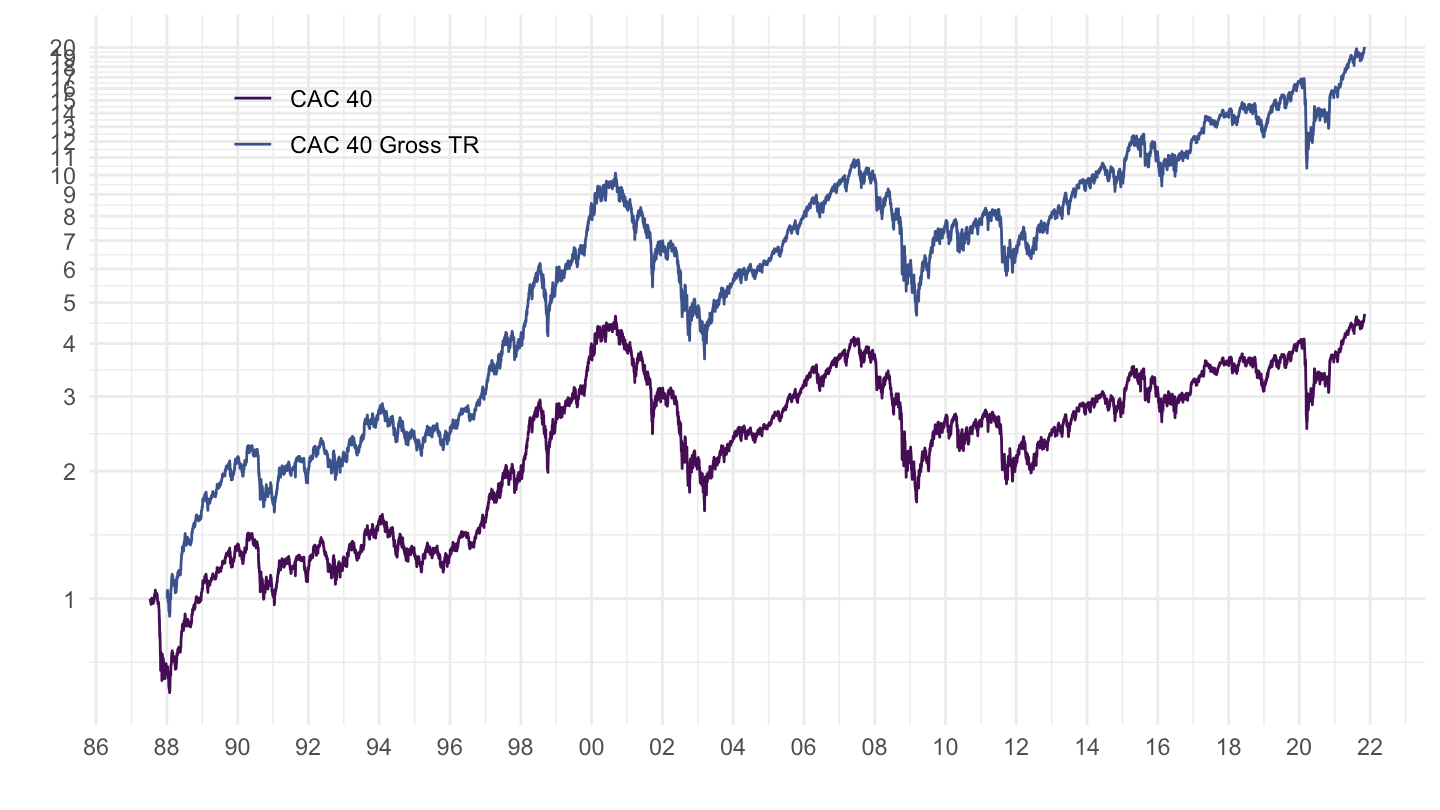
2000-
indices_FRA %>%
  filter(symbol %in% c("FCHI", "PX1GR")) %>%
  left_join(indices_FRA_var, by = "symbol") %>%
  group_by(symbol) %>%
  filter(Date >= as.Date("2000-01-01")) %>%
  mutate(Close = 6944.77*Close / Close[Date == as.Date("2000-09-04")],
         name = gsub("Gross TR", "Total Return", name)) %>%
  arrange(desc(Date)) %>%
  ggplot + geom_line(aes(x = Date, y = Close, color = name)) +
  theme_minimal() + xlab("") + ylab("") +
  scale_x_date(breaks = seq(1960, 2022, 2) %>% paste0("-01-01") %>% as.Date,
               labels = date_format("%y")) +
  scale_y_log10(breaks = seq(1000, 15000, 1000)) +
  scale_color_manual(values = viridis(3)[1:2]) +
  theme(legend.position = c(0.2, 0.85),
        legend.title = element_blank()) +
  geom_hline(yintercept = 6944.77, linetype = "dashed")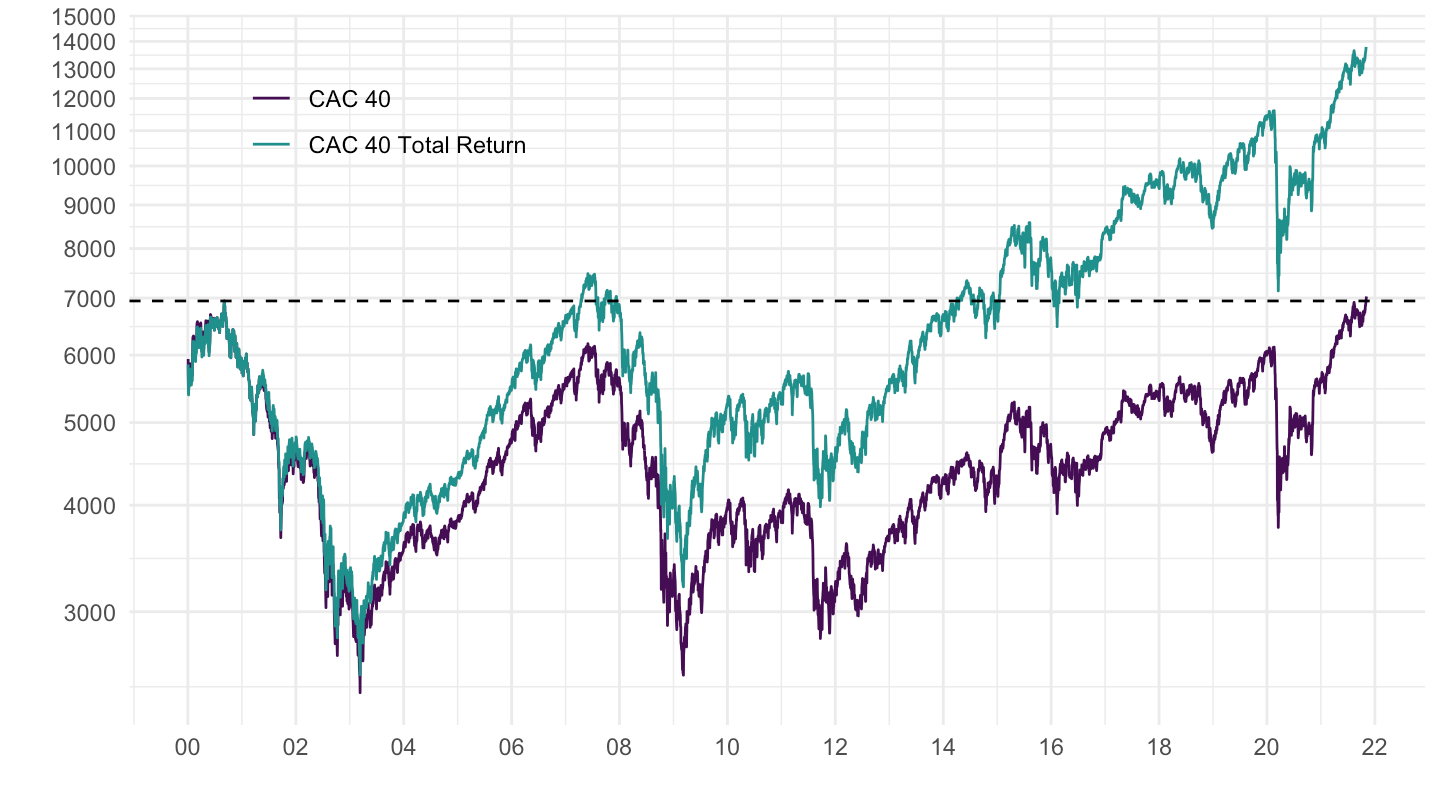
2000- (Base = 100)
indices_FRA %>%
  filter(symbol %in% c("FCHI", "PX1GR")) %>%
  left_join(indices_FRA_var, by = "symbol") %>%
  group_by(symbol) %>%
  filter(Date >= as.Date("1999-12-30")) %>%
  transmute(date = Date,
            variable = symbol,
            value = 100*Close / Close[Date == as.Date("1999-12-30")],
            Variable = gsub("Gross TR", "incluant les dividendes", name)) %>%
  ggplot + geom_line(aes(x = date, y = value, color = Variable)) +
  theme_minimal() + xlab("") + ylab("") +
  scale_x_date(breaks = seq(1960, 2022, 2) %>% paste0("-01-01") %>% as.Date,
               labels = date_format("%y")) +
  scale_y_log10(breaks = seq(10, 15000, 10)) +
  scale_color_manual(values = viridis(3)[1:2]) +
  theme(legend.position = c(0.2, 0.85),
        legend.title = element_blank())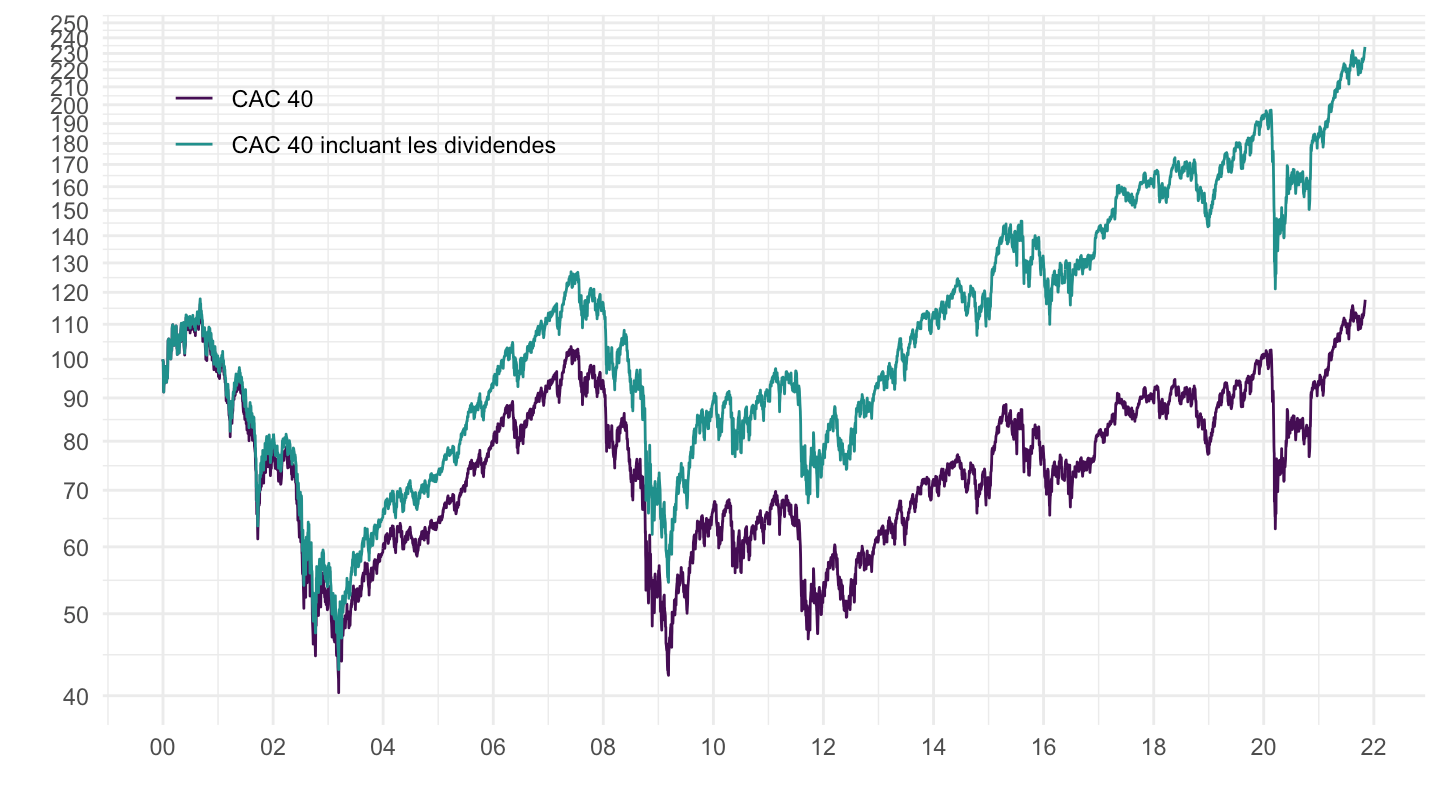
1995- (Base = 100)
indices_FRA %>%
  filter(symbol %in% c("FCHI", "PX1GR")) %>%
  left_join(indices_FRA_var, by = "symbol") %>%
  group_by(symbol) %>%
  filter(Date >= as.Date("1994-12-30")) %>%
  mutate(Close = 100*Close / Close[Date == as.Date("1994-12-30")],
         name = gsub("Gross TR", "Total Return", name)) %>%
  arrange(desc(Date)) %>%
  ggplot + geom_line(aes(x = Date, y = Close, color = name)) +
  theme_minimal() + xlab("") + ylab("") +
  scale_x_date(breaks = seq(1960, 2022, 2) %>% paste0("-01-01") %>% as.Date,
               labels = date_format("%y")) +
  scale_y_log10(breaks = seq(50, 15000, 50)) +
  scale_color_manual(values = viridis(3)[1:2]) +
  theme(legend.position = c(0.2, 0.85),
        legend.title = element_blank())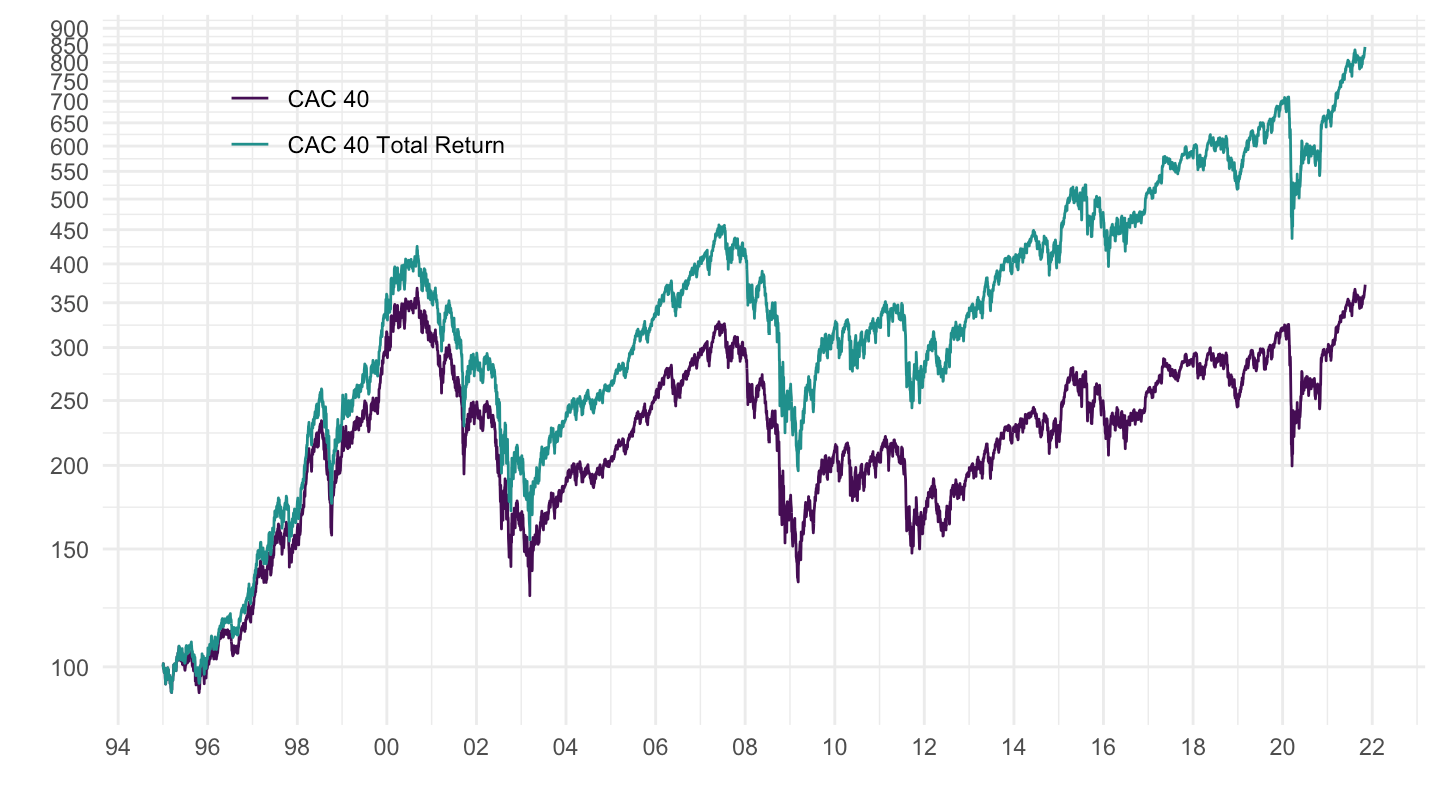
Base = 100
RPP %>%
  right_join(tibble(variable = c("RPP.Q.FR.N.ED.00.1.00",
                          "RPP.Q.FR.N.EF.CC.1.00"),
             Variable = c("Immobilier, France sans les loyers",
                          "Immobilier, Paris sans les loyers")), by = "variable") %>%
  filter(date >= as.Date("1999-12-31")) %>%
  group_by(Variable) %>%
  mutate(value = 100*value/value[date == as.Date("1999-12-31")]) %>%
  bind_rows(indices_FRA %>%
  filter(symbol %in% c("FCHI", "PX1GR")) %>%
  left_join(indices_FRA_var, by = "symbol") %>%
  group_by(symbol) %>%
  filter(Date >= as.Date("1999-12-30")) %>%
  transmute(date = Date,
            variable = symbol,
            value = 100*Close / Close[Date == as.Date("1999-12-30")],
            Variable = gsub("Gross TR", "incluant les dividendes", name))) %>%
  ggplot + geom_line(aes(x = date, y = value, color = Variable)) +
  scale_color_manual(values = viridis(5)[1:4]) +
  theme_minimal() + xlab("") + ylab("Valeur de l'actif (2000 = 100)") +
  scale_x_date(breaks = seq(1960, 2022, 2) %>% paste0(., "-01-01") %>% as.Date(),
               labels = date_format("%y")) +
  theme(legend.position = c(0.18, 0.87),
        legend.title = element_blank()) +
  scale_y_log10(breaks = c(seq(0, 7000, 50), 80, 60, 30, 120))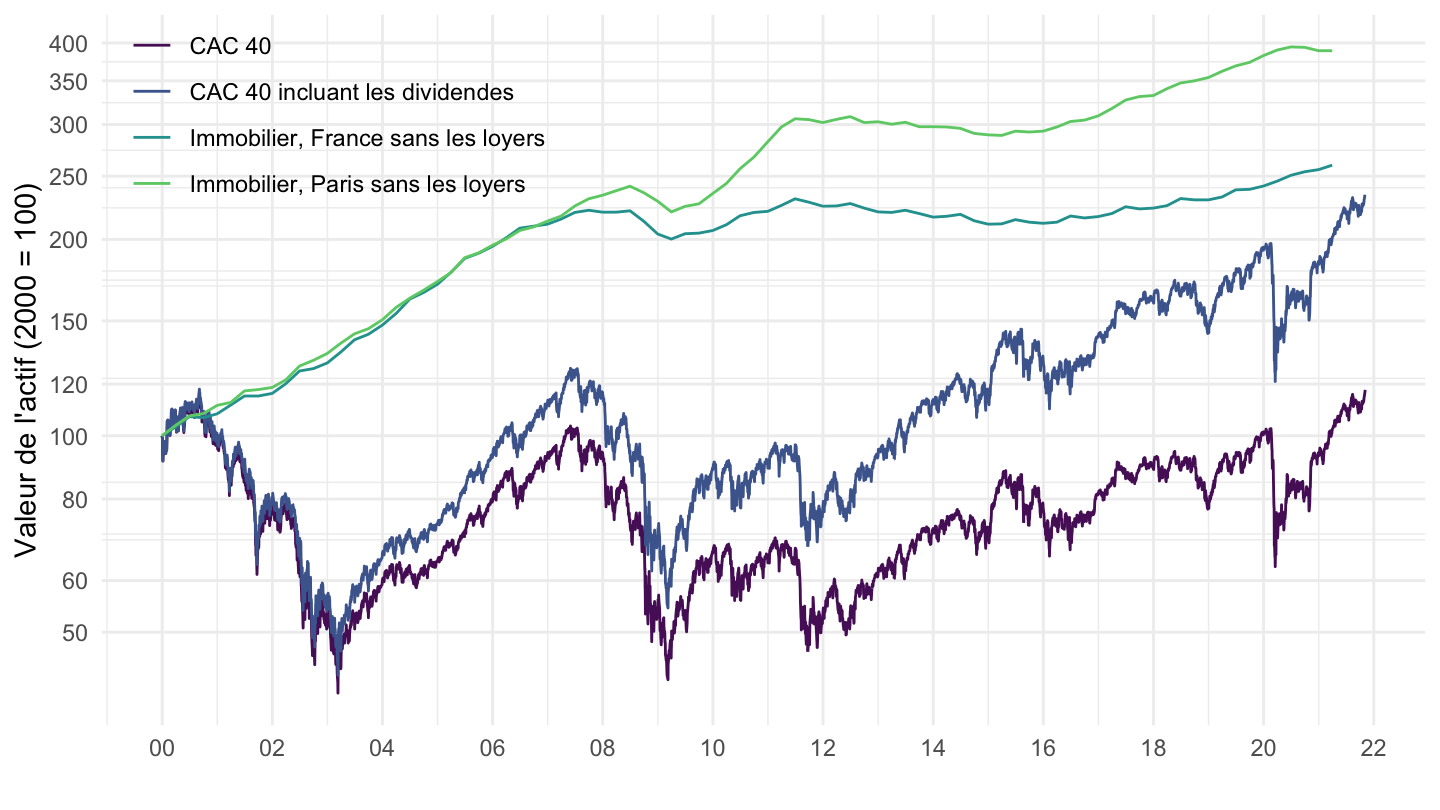
Sector
Consumer Service, Financials, Health Care, Industrials
indices_FRA %>%
  filter(symbol %in% c("FRCS", "FRIN", "FRHC", "FRFIN")) %>%
  left_join(indices_FRA_var, by = "symbol") %>%
  ggplot + geom_line(aes(x = Date, y = Close, color = full_name)) +
  theme_minimal() + xlab("") + ylab("") +
  scale_x_date(breaks = seq(1960, 2020, 2) %>% paste0("-01-01") %>% as.Date,
               labels = date_format("%y")) +
  scale_y_log10(breaks = seq(0, 3000, 100)) +
  scale_color_manual(values = viridis(5)[1:4]) +
  theme(legend.position = c(0.3, 0.85),
        legend.title = element_blank())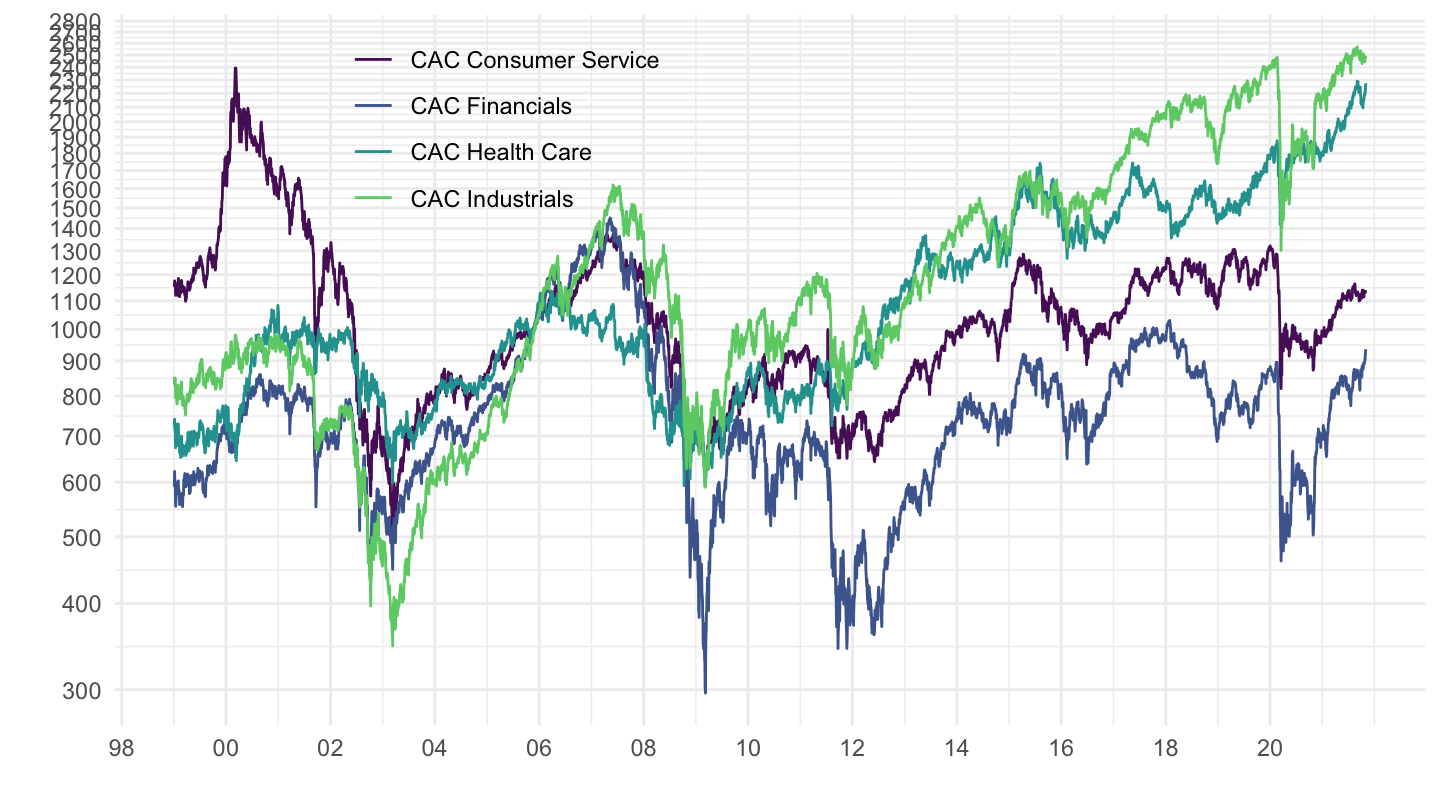
Basic Materials, Consumer Goods, Oil & Gas, Technology
indices_FRA %>%
  filter(symbol %in% c("FRCG", "FROG", "FRBM", "FRTEC")) %>%
  left_join(indices_FRA_var, by = "symbol") %>%
  ggplot + geom_line(aes(x = Date, y = Close, color = full_name)) +
  theme_minimal() + xlab("") + ylab("") +
  scale_x_date(breaks = seq(1960, 2020, 2) %>% paste0("-01-01") %>% as.Date,
               labels = date_format("%y")) +
  scale_y_log10(breaks = seq(0, 6000, 200)) +
  scale_color_manual(values = viridis(5)[1:4]) +
  theme(legend.position = c(0.29, 0.85),
        legend.title = element_blank())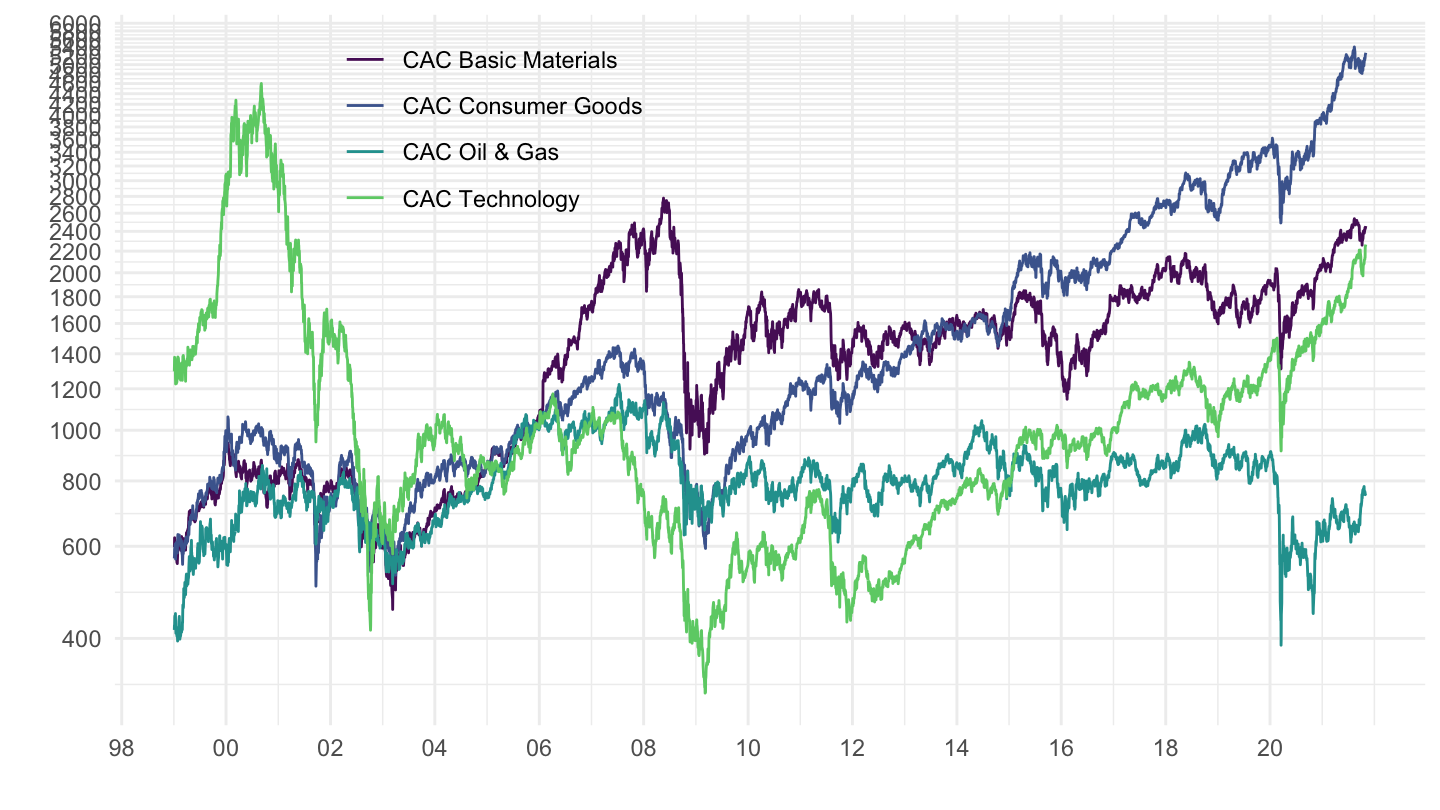
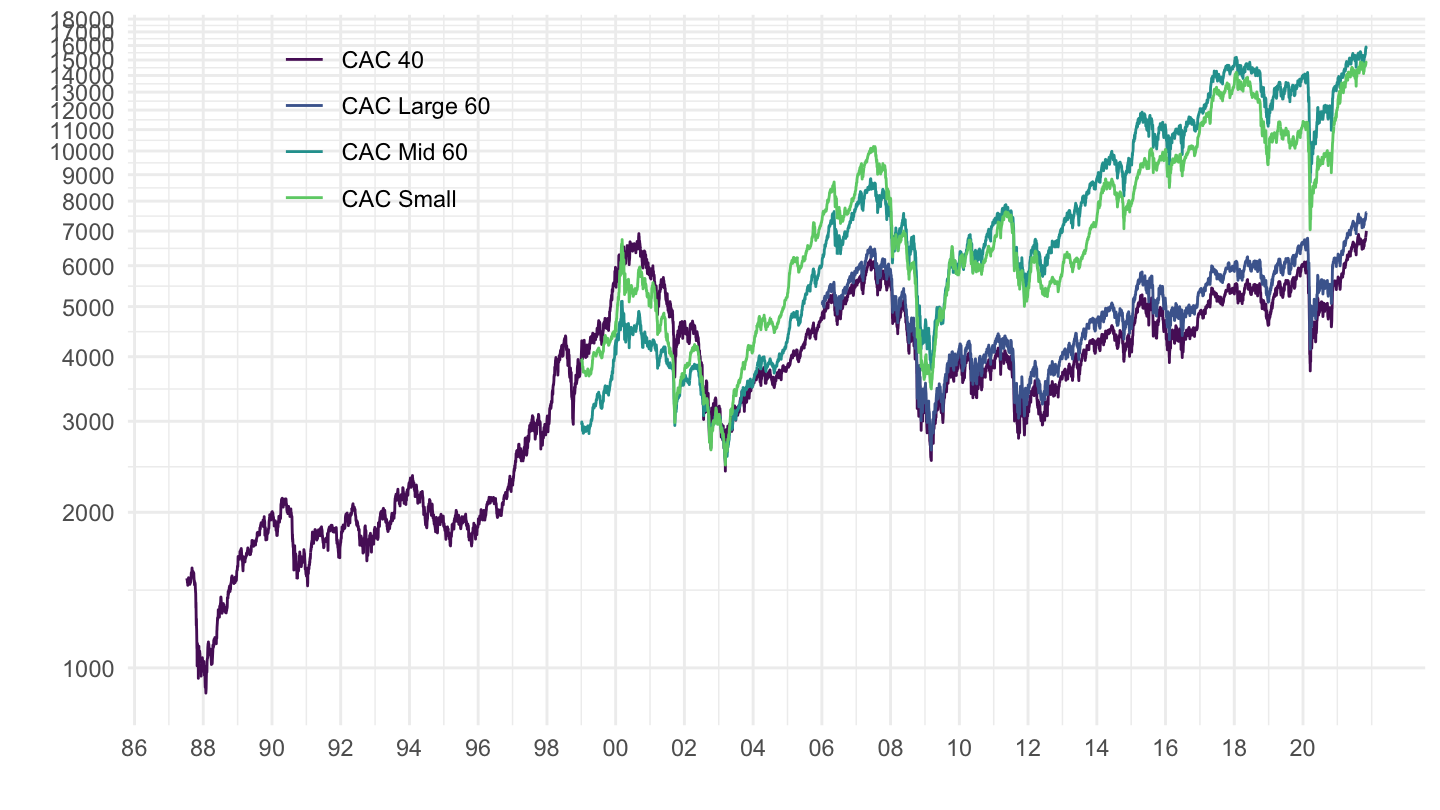
Large, Mid, Small
indices_FRA %>%
  filter(symbol %in% c("FCHI", "CACLG", "CACMD", "CACS")) %>%
  left_join(indices_FRA_var, by = "symbol") %>%
  ggplot + geom_line(aes(x = Date, y = Close, color = full_name)) +
  theme_minimal() + xlab("") + ylab("") +
  scale_x_date(breaks = seq(1960, 2020, 2) %>% paste0("-01-01") %>% as.Date,
               labels = date_format("%y")) +
  scale_y_log10(breaks = seq(0, 20000, 1000)) +
  scale_color_manual(values = viridis(5)[1:4]) +
  theme(legend.position = c(0.2, 0.85),
        legend.title = element_blank())