Currency Crosses
Data - Finance
François Geerolf
currency_crosses_var
Currencies
Pound, Euro, Swiss Franc
All
currency_crosses_USA %>%
  filter(symbol %in% c("EUR", "CHF", "GBP")) %>%
  left_join(currency_crosses_USA_var %>%
              rename(symbol = base), by = "symbol") %>%
  ggplot + geom_line(aes(x = Date, y = Close, color = base_name)) +
  theme_minimal() + xlab("") + ylab("Currency in $") +
  scale_x_date(breaks = seq(1960, 2020, 2) %>% paste0("-01-01") %>% as.Date,
               labels = date_format("%y")) +
  scale_y_log10(breaks = seq(0, 3, 0.2),
                     labels = dollar_format(accuracy = 0.1)) +
  scale_color_manual(values = viridis(5)[1:4]) +
  theme(legend.position = c(0.85, 0.9),
        legend.title = element_blank())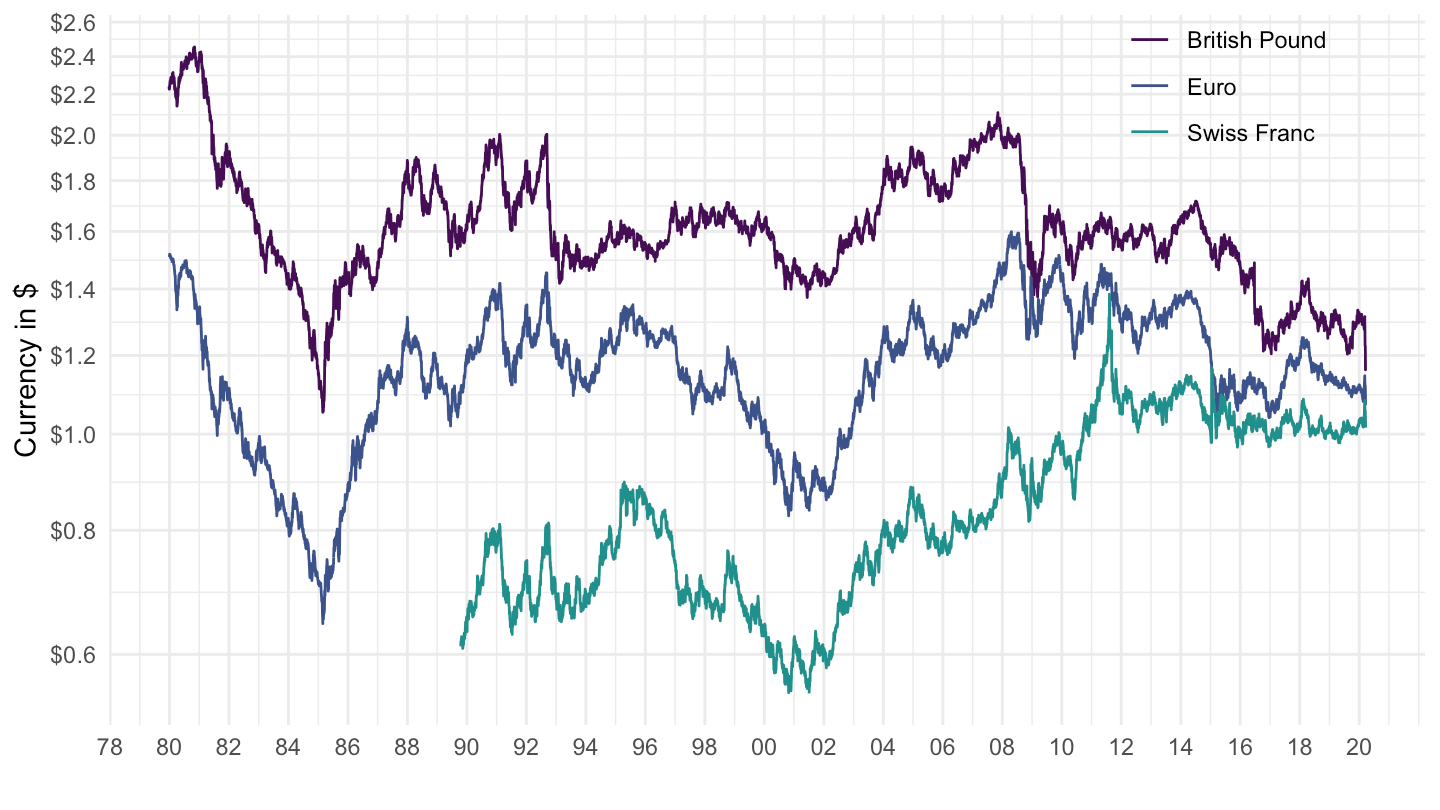
2010-
currency_crosses_USA %>%
  filter(symbol %in% c("EUR", "CHF", "GBP"),
         Date >= as.Date("2010-01-01")) %>%
  left_join(currency_crosses_USA_var %>%
              rename(symbol = base), by = "symbol") %>%
  ggplot + geom_line(aes(x = Date, y = Close, color = base_name)) +
  theme_minimal() + xlab("") + ylab("Currency in $") +
  scale_x_date(breaks = seq(1960, 2020, 2) %>% paste0("-01-01") %>% as.Date,
               labels = date_format("%y")) +
  scale_y_log10(breaks = seq(0, 3, 0.2),
                     labels = dollar_format(accuracy = 0.1)) +
  scale_color_manual(values = viridis(5)[1:4]) +
  theme(legend.position = c(0.85, 0.9),
        legend.title = element_blank())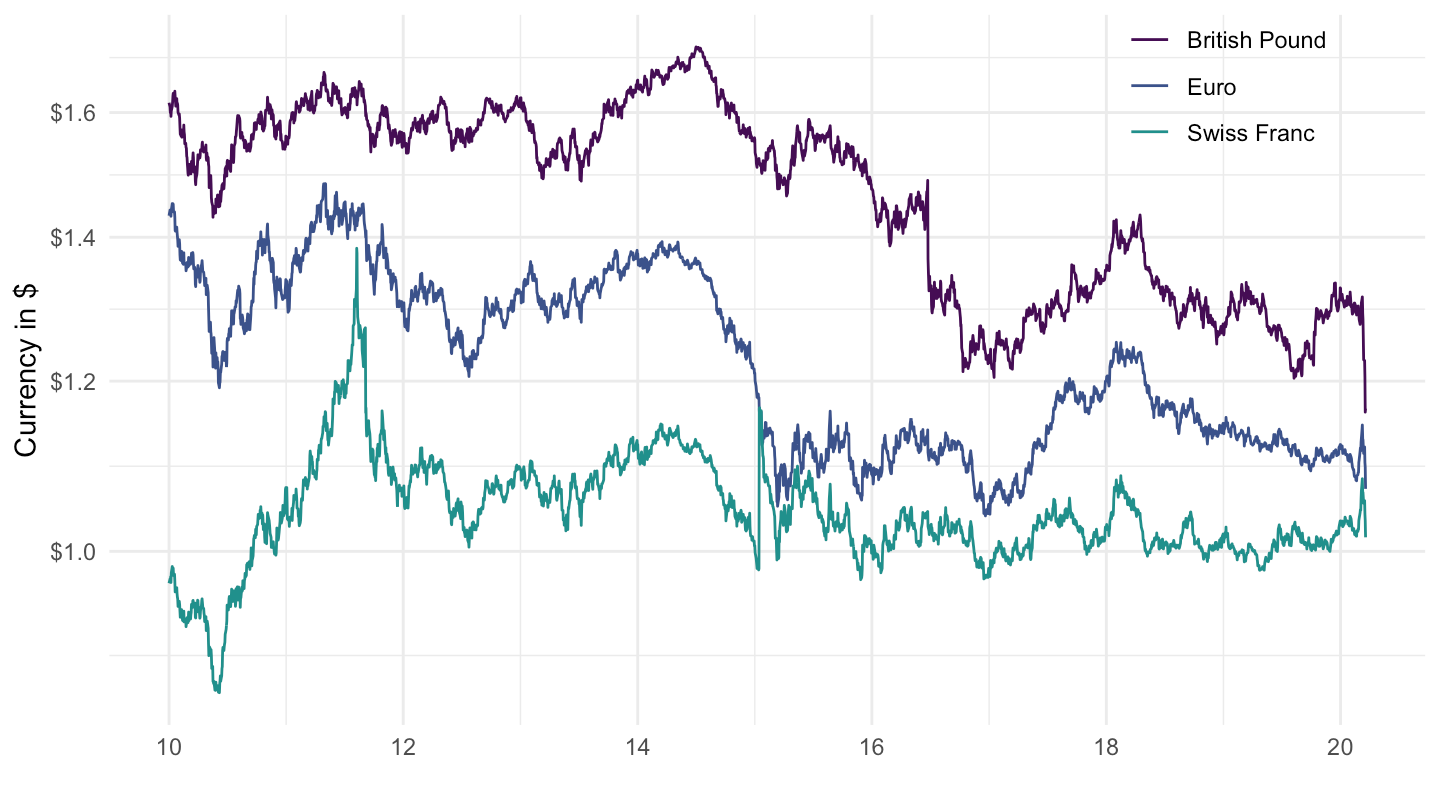
2018-
currency_crosses_USA %>%
  filter(symbol %in% c("EUR", "CHF", "GBP"),
         Date >= as.Date("2018-01-01")) %>%
  left_join(currency_crosses_USA_var %>%
              rename(symbol = base), by = "symbol") %>%
  ggplot + geom_line(aes(x = Date, y = Close, color = base_name)) +
  theme_minimal() + xlab("") + ylab("Currency in $") +
  scale_x_date(breaks = "3 months",
               labels = date_format("%b %y")) +
  scale_y_log10(breaks = seq(0, 3, 0.1),
                labels = dollar_format(accuracy = 0.1)) +
  scale_color_manual(values = viridis(5)[1:4]) +
  theme(legend.position = c(0.85, 0.9),
        legend.title = element_blank())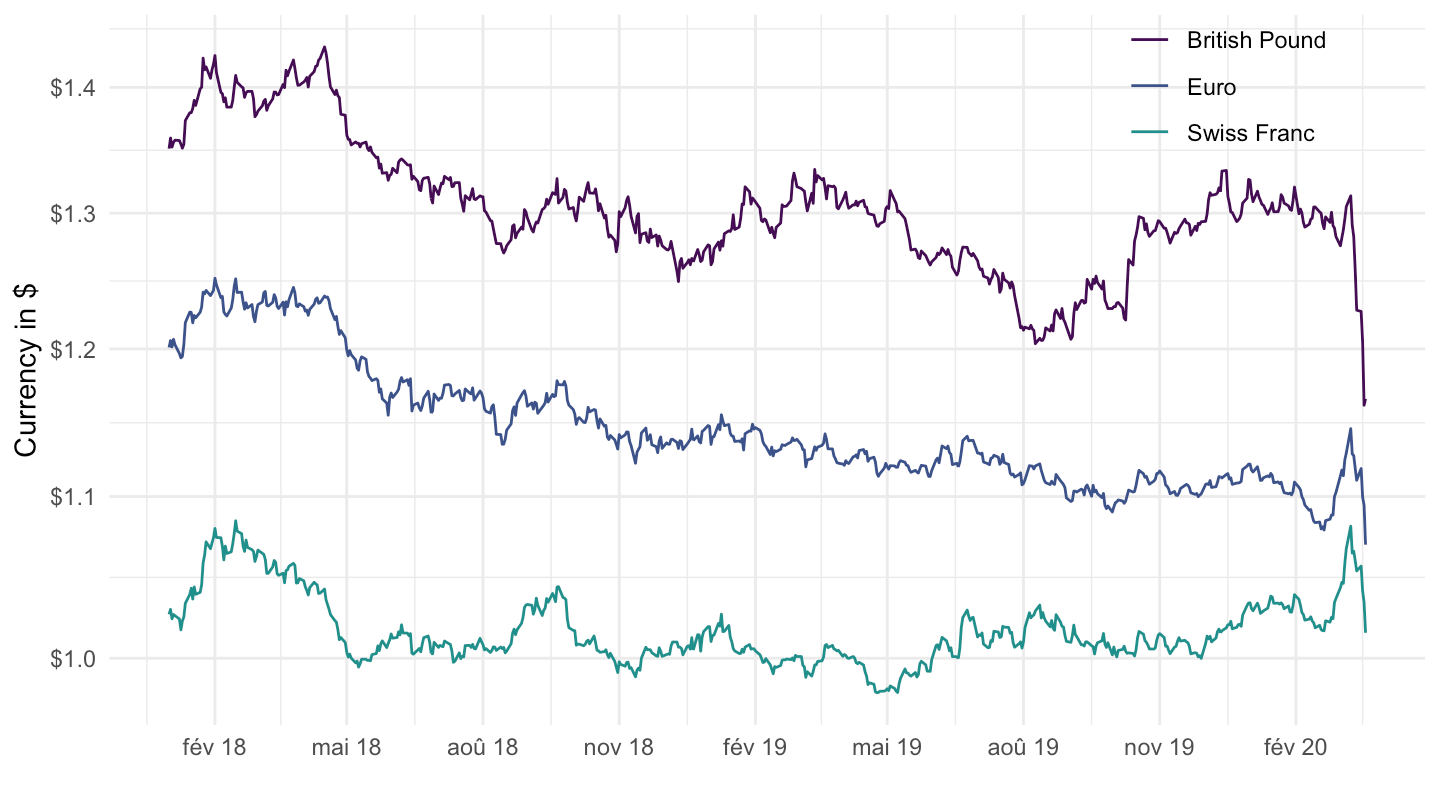
Australian, Canadian, New Zealand Dollars
currency_crosses_USA %>%
  filter(symbol %in% c("AUD", "NZD", "CAD")) %>%
  left_join(currency_crosses_USA_var %>%
              rename(symbol = base), by = "symbol") %>%
  ggplot + geom_line(aes(x = Date, y = Close, color = base_name)) +
  theme_minimal() + xlab("") + ylab("Currency in $") +
  scale_x_date(breaks = seq(1960, 2020, 2) %>% paste0("-01-01") %>% as.Date,
               labels = date_format("%y")) +
  scale_y_log10(breaks = seq(0, 3, 0.2),
                     labels = dollar_format(accuracy = 0.1)) +
  scale_color_manual(values = viridis(5)[1:4]) +
  theme(legend.position = c(0.45, 0.9),
        legend.title = element_blank())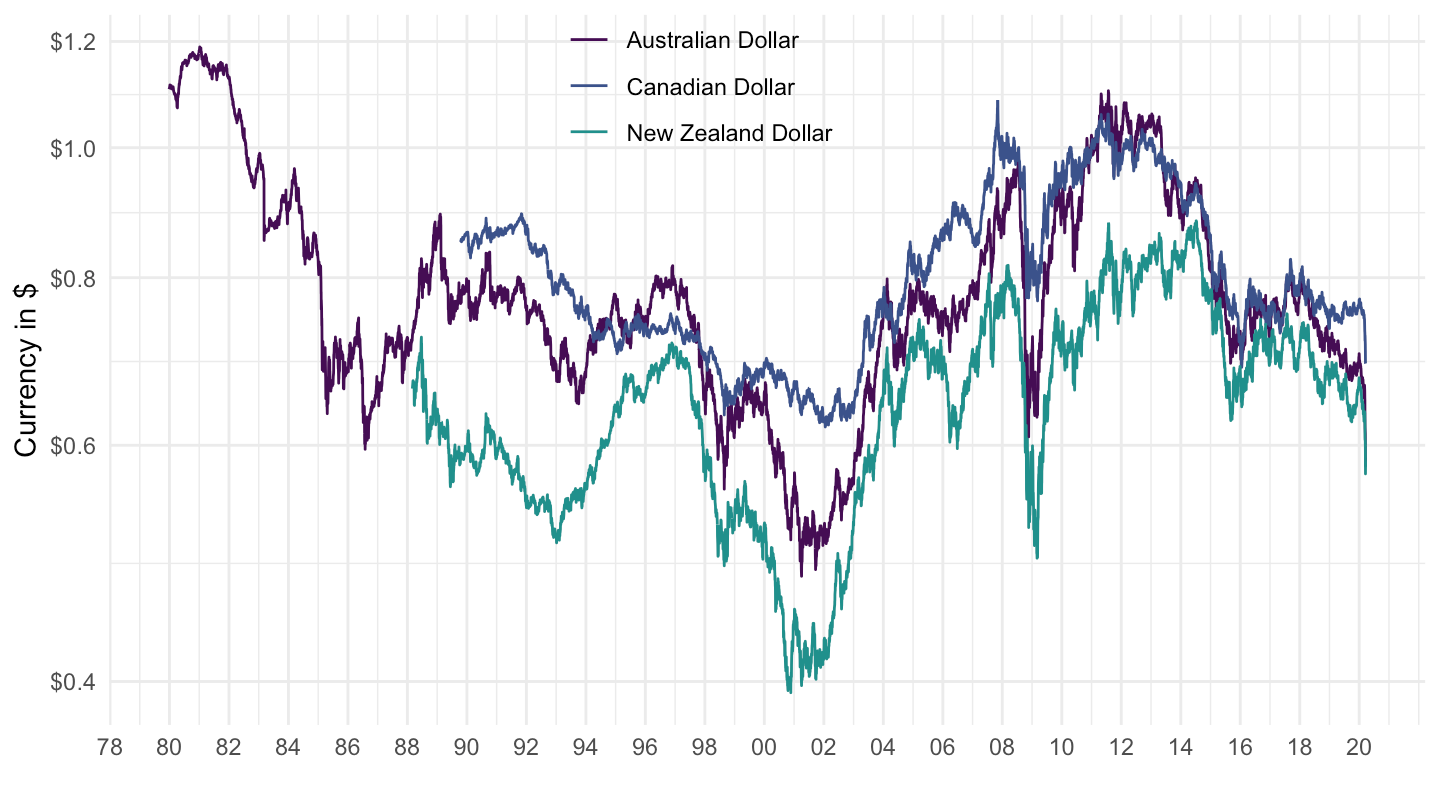
Australian, Canadian, New Zealand Dollars
currency_crosses_USA %>%
  filter(symbol %in% c("ILS", "PLN", "BRL")) %>%
  left_join(currency_crosses_USA_var %>%
              rename(symbol = base), by = "symbol") %>%
  ggplot + geom_line(aes(x = Date, y = Close, color = base_name)) +
  theme_minimal() + xlab("") + ylab("Currency in $") +
  scale_x_date(breaks = seq(1960, 2020, 2) %>% paste0("-01-01") %>% as.Date,
               labels = date_format("%y")) +
  scale_y_log10(breaks = seq(0, 2000, 100),
                     labels = dollar_format(accuracy = 1)) +
  scale_color_manual(values = viridis(5)[1:4]) +
  theme(legend.position = c(0.45, 0.9),
        legend.title = element_blank())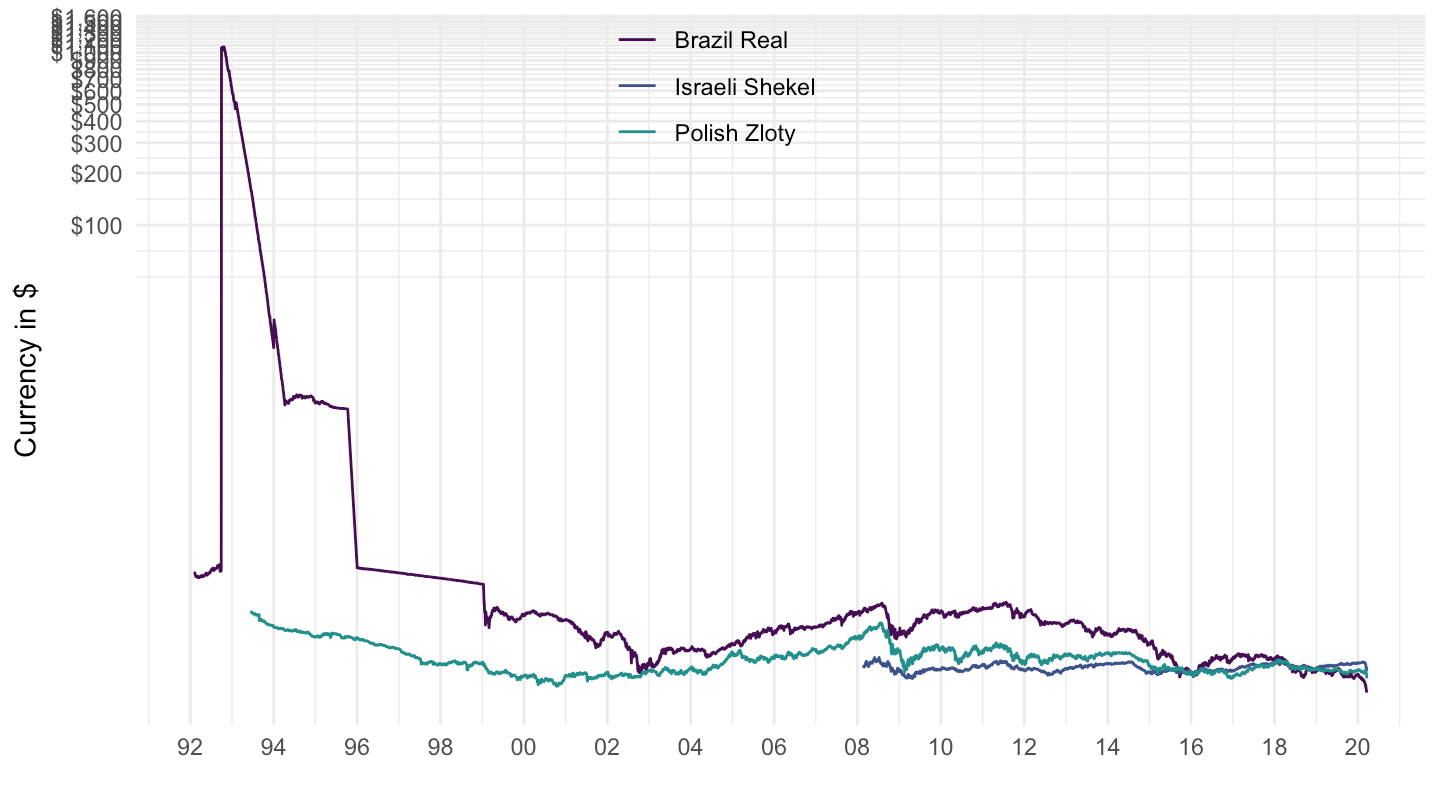
Australian, Canadian, New Zealand Dollars
currency_crosses_USA %>%
  filter(symbol %in% c("ILS", "PLN", "BRL")) %>%
  filter(Date >= as.Date("1996-01-01")) %>%
  left_join(currency_crosses_USA_var %>%
              rename(symbol = base), by = "symbol") %>%
  ggplot + geom_line(aes(x = Date, y = Close, color = base_name)) +
  theme_minimal() + xlab("") + ylab("Currency in $") +
  scale_x_date(breaks = seq(1960, 2020, 2) %>% paste0("-01-01") %>% as.Date,
               labels = date_format("%y")) +
  scale_y_log10(breaks = seq(0, 2, 0.1),
                     labels = dollar_format(accuracy = 0.1)) +
  scale_color_manual(values = viridis(5)[1:4]) +
  theme(legend.position = c(0.45, 0.9),
        legend.title = element_blank())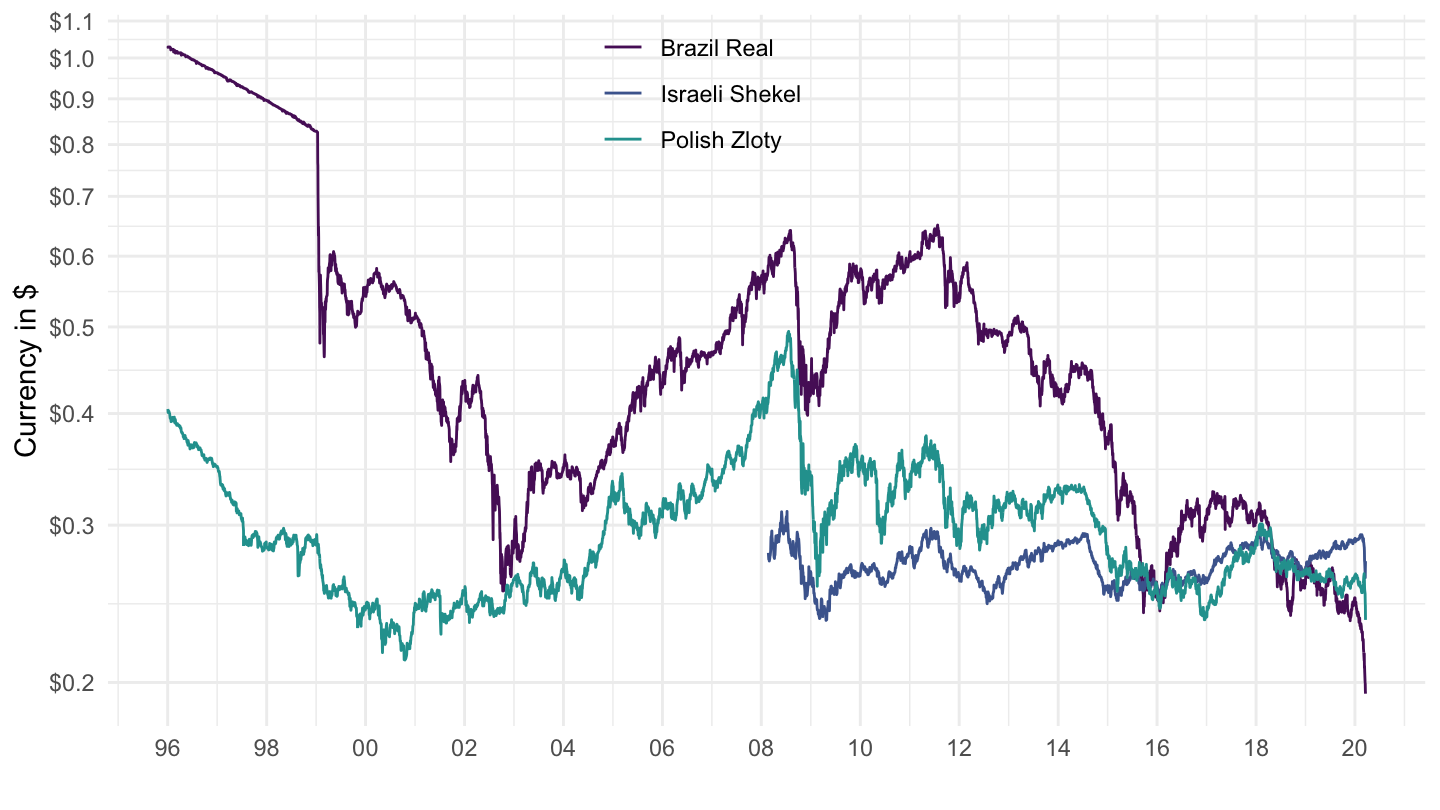
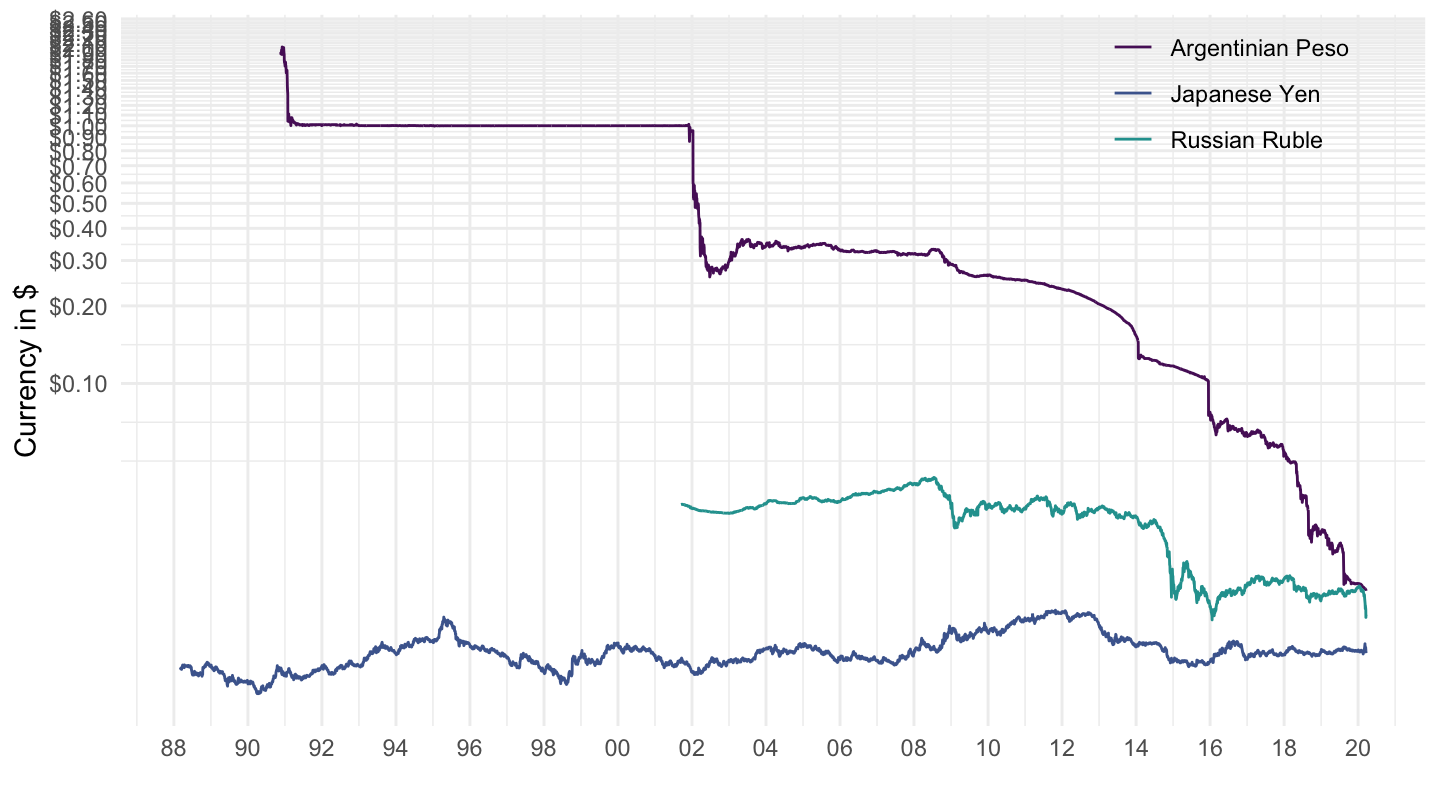
Ruble, Peso, Yen
currency_crosses_USA %>%
  filter(symbol %in% c("ARS", "RUB", "JPY")) %>%
  left_join(currency_crosses_USA_var %>%
              rename(symbol = base), by = "symbol") %>%
  ggplot + geom_line(aes(x = Date, y = Close, color = base_name)) +
  theme_minimal() + xlab("") + ylab("Currency in $") +
  scale_x_date(breaks = seq(1960, 2020, 2) %>% paste0("-01-01") %>% as.Date,
               labels = date_format("%y")) +
  scale_y_log10(breaks = seq(0, 3, 0.01),
                     labels = dollar_format(accuracy = 0.01)) +
  scale_color_manual(values = viridis(5)[1:4]) +
  theme(legend.position = c(0.45, 0.7),
        legend.title = element_blank())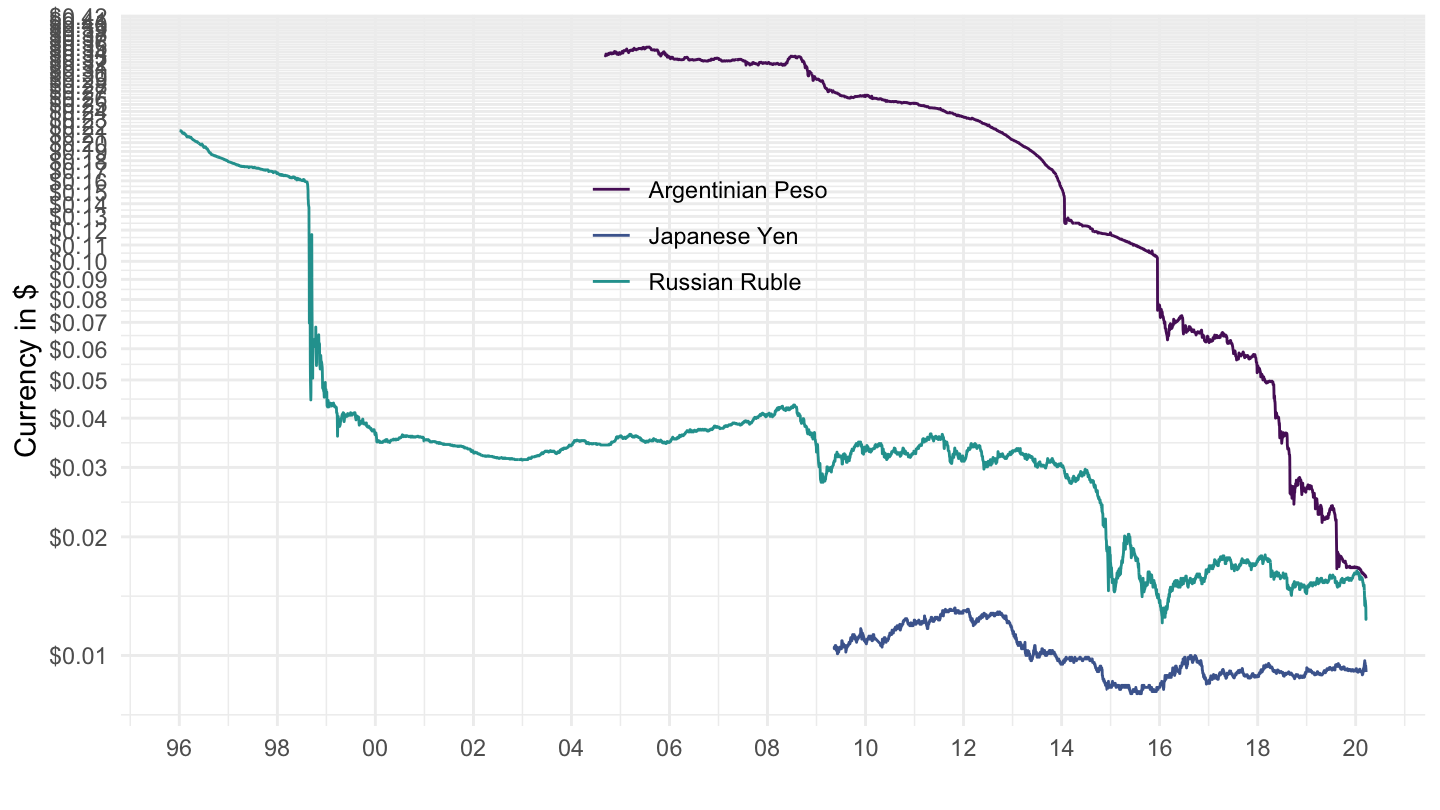
Ruble, Peso, Yen
currency_crosses_base_USA %>%
  filter(partner %in% c("ARS", "RUB", "JPY")) %>%
  left_join(currency_crosses_base_USA_var %>%
              rename(partner = second), by = "partner") %>%
  ggplot + geom_line(aes(x = Date, y = 1/Close, color = second_name)) +
  theme_minimal() + xlab("") + ylab("Currency in $") +
  scale_x_date(breaks = seq(1960, 2020, 2) %>% paste0("-01-01") %>% as.Date,
               labels = date_format("%y")) +
  scale_y_log10(breaks = seq(0, 3, 0.1),
                labels = dollar_format(accuracy = 0.01)) +
  scale_color_manual(values = viridis(5)[1:4]) +
  theme(legend.position = c(0.85, 0.9),
        legend.title = element_blank())