Regional gross domestic product (PPS per inhabitant) by NUTS 2 regions - tgs00005
Data - Eurostat
François Geerolf
Info
LAST_DOWNLOAD
tibble(LAST_DOWNLOAD = as.Date(file.info("~/Dropbox/website/data/eurostat/tgs00005.RData")$mtime)) %>%
print_table_conditional()| LAST_DOWNLOAD |
|---|
| 2024-02-14 |
LAST_COMPILE
| LAST_COMPILE |
|---|
| 2024-02-15 |
Last
tgs00005 %>%
  group_by(time) %>%
  summarise(Nobs = n()) %>%
  arrange(desc(time)) %>%
  head(1) %>%
print_table_conditional()| time | Nobs |
|---|---|
| 2021 | 273 |
unit
tgs00005 %>%
  group_by(unit) %>%
  summarise(Nobs = n()) %>%
  arrange(-Nobs) %>%
{if (is_html_output()) print_table(.) else .}| unit | Nobs |
|---|---|
| PPS_EU27_2020_HAB | 3413 |
time
| time | Nobs |
|---|---|
| 2010 | 279 |
| 2011 | 279 |
| 2012 | 283 |
| 2013 | 283 |
| 2014 | 290 |
| 2015 | 290 |
| 2016 | 290 |
| 2017 | 290 |
| 2018 | 290 |
| 2019 | 283 |
| 2020 | 283 |
| 2021 | 273 |
geo
Map - Cross Section
2014
tgs00005 %>%
  filter(time == 2014,
         nchar(geo) == 4) %>%
  right_join(europe_NUTS2, by = "geo") %>%
  filter(long >= -15, lat >= 33) %>%
  ggplot(., aes(x = long, y = lat, group = group, fill = values/1000)) +
  geom_polygon() + coord_map() +
  scale_fill_viridis_c(na.value = "white",
                       labels = scales::dollar_format(accuracy = 1, prefix = "", suffix = " k€"),
                       breaks = seq(0, 2000, 10),
                       values = c(0, 0.05, 0.1, 0.15, 0.2, 0.25, 1)) +
  theme_void() + theme(legend.position = c(0.25, 0.85)) +
  labs(fill = "PPS GDP / person")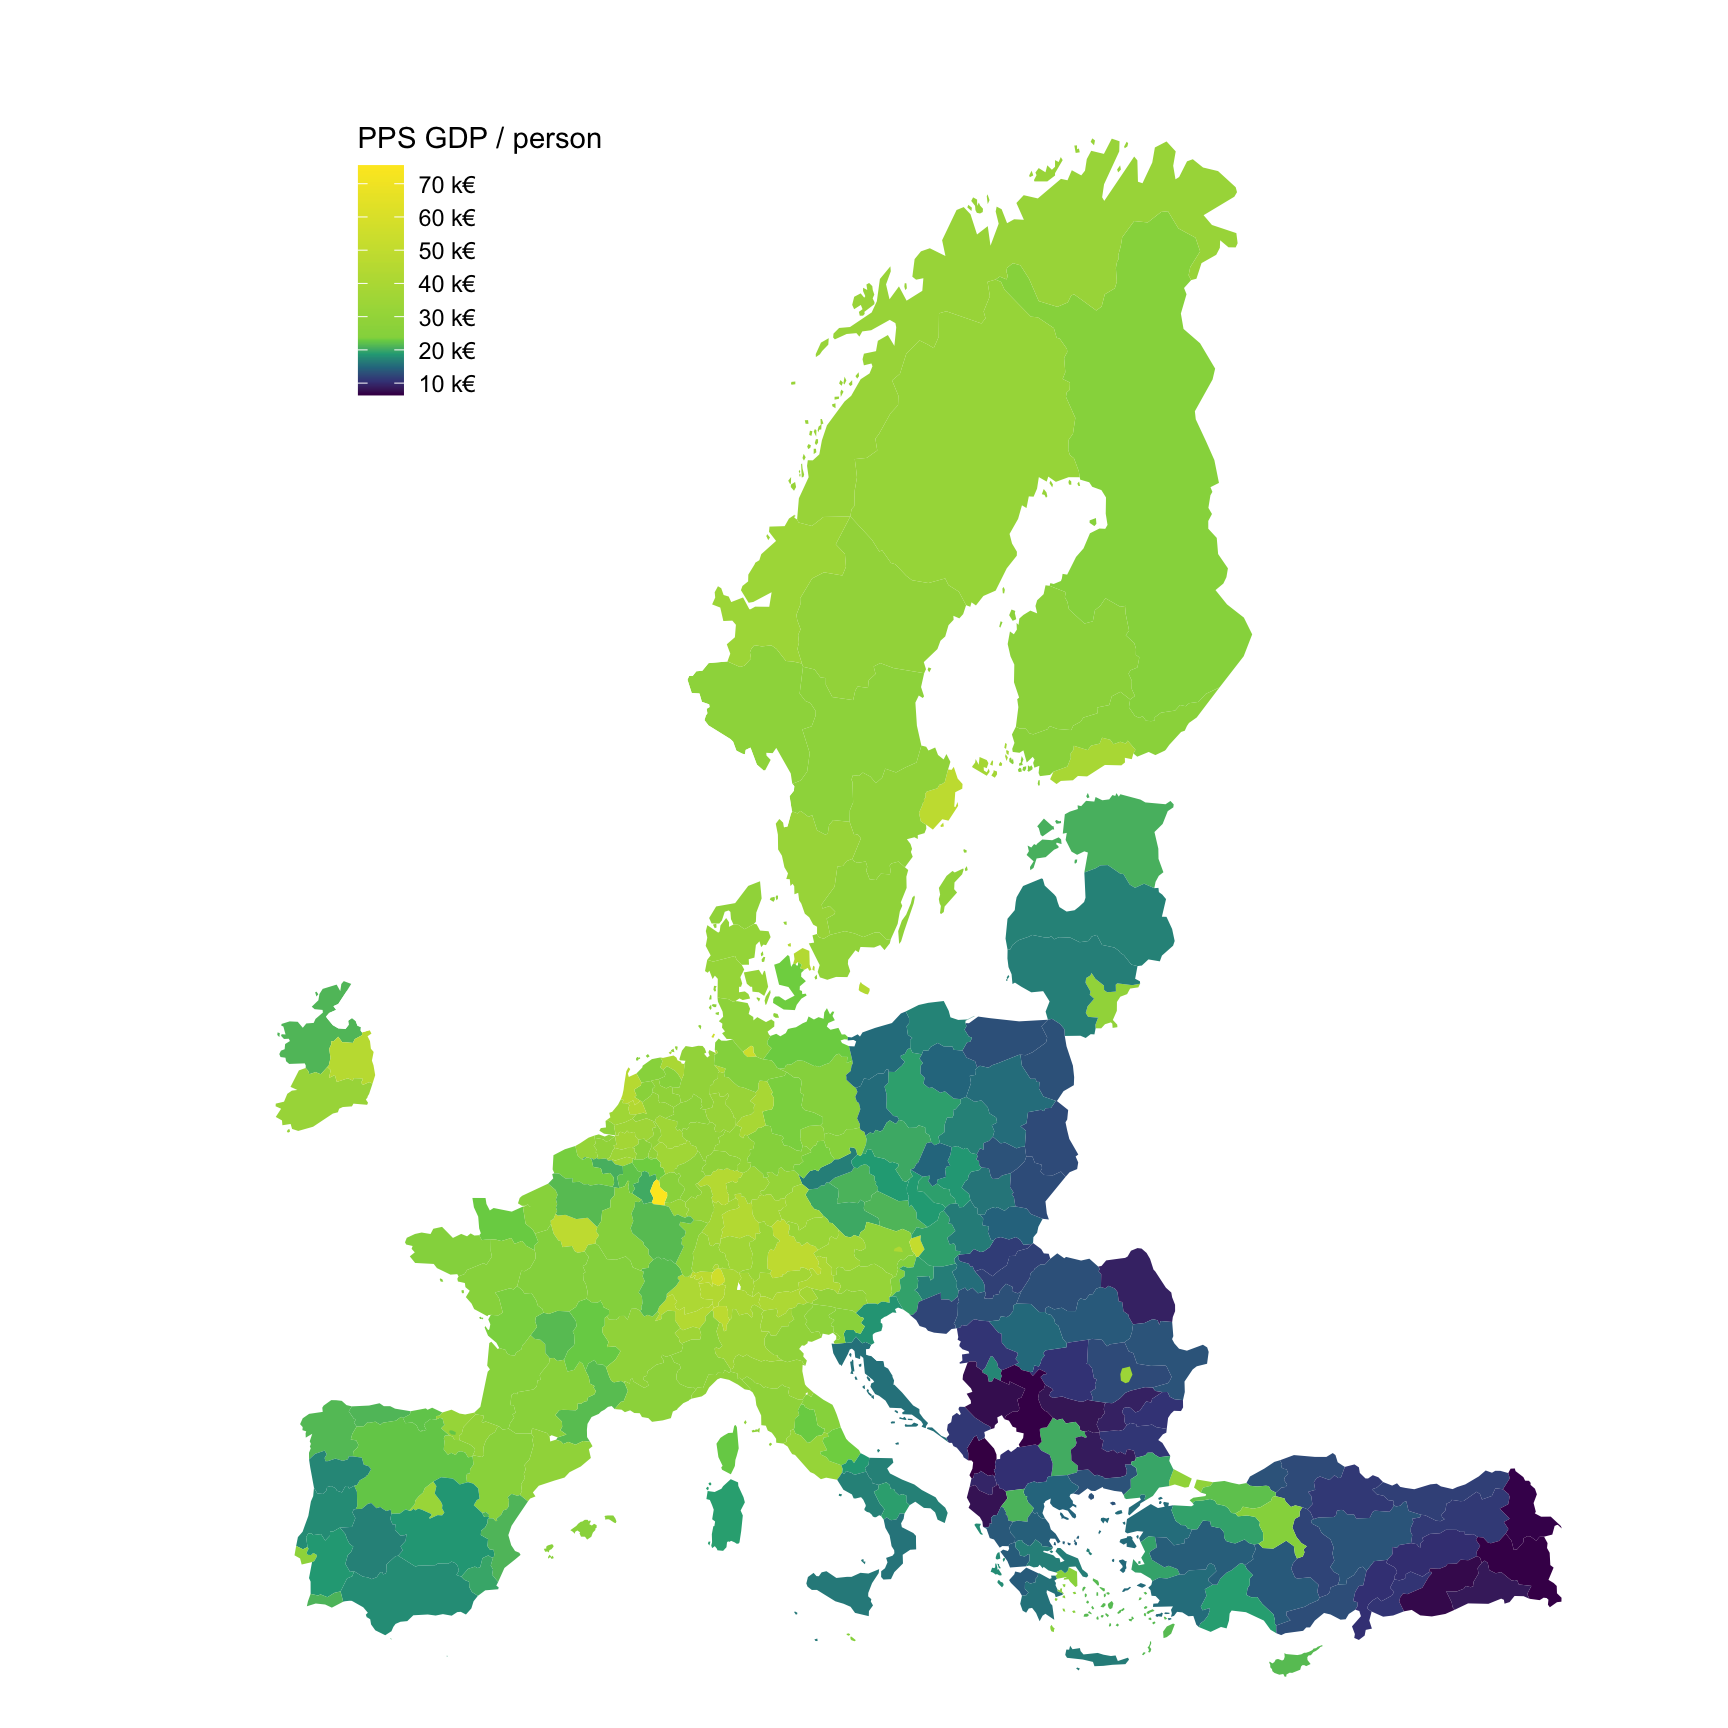
2015
tgs00005 %>%
  filter(time == 2015,
         nchar(geo) == 4) %>%
  right_join(europe_NUTS2, by = "geo") %>%
  filter(long >= -15, lat >= 33) %>%
  ggplot(., aes(x = long, y = lat, group = group, fill = values/1000)) +
  geom_polygon() + coord_map() +
  scale_fill_viridis_c(na.value = "white",
                       labels = scales::dollar_format(accuracy = 1, prefix = "", suffix = " k€"),
                       breaks = seq(0, 2000, 10),
                       values = c(0, 0.05, 0.1, 0.15, 0.2, 0.25, 1)) +
  theme_void() + theme(legend.position = c(0.25, 0.85)) +
  labs(fill = "PPS GDP / person")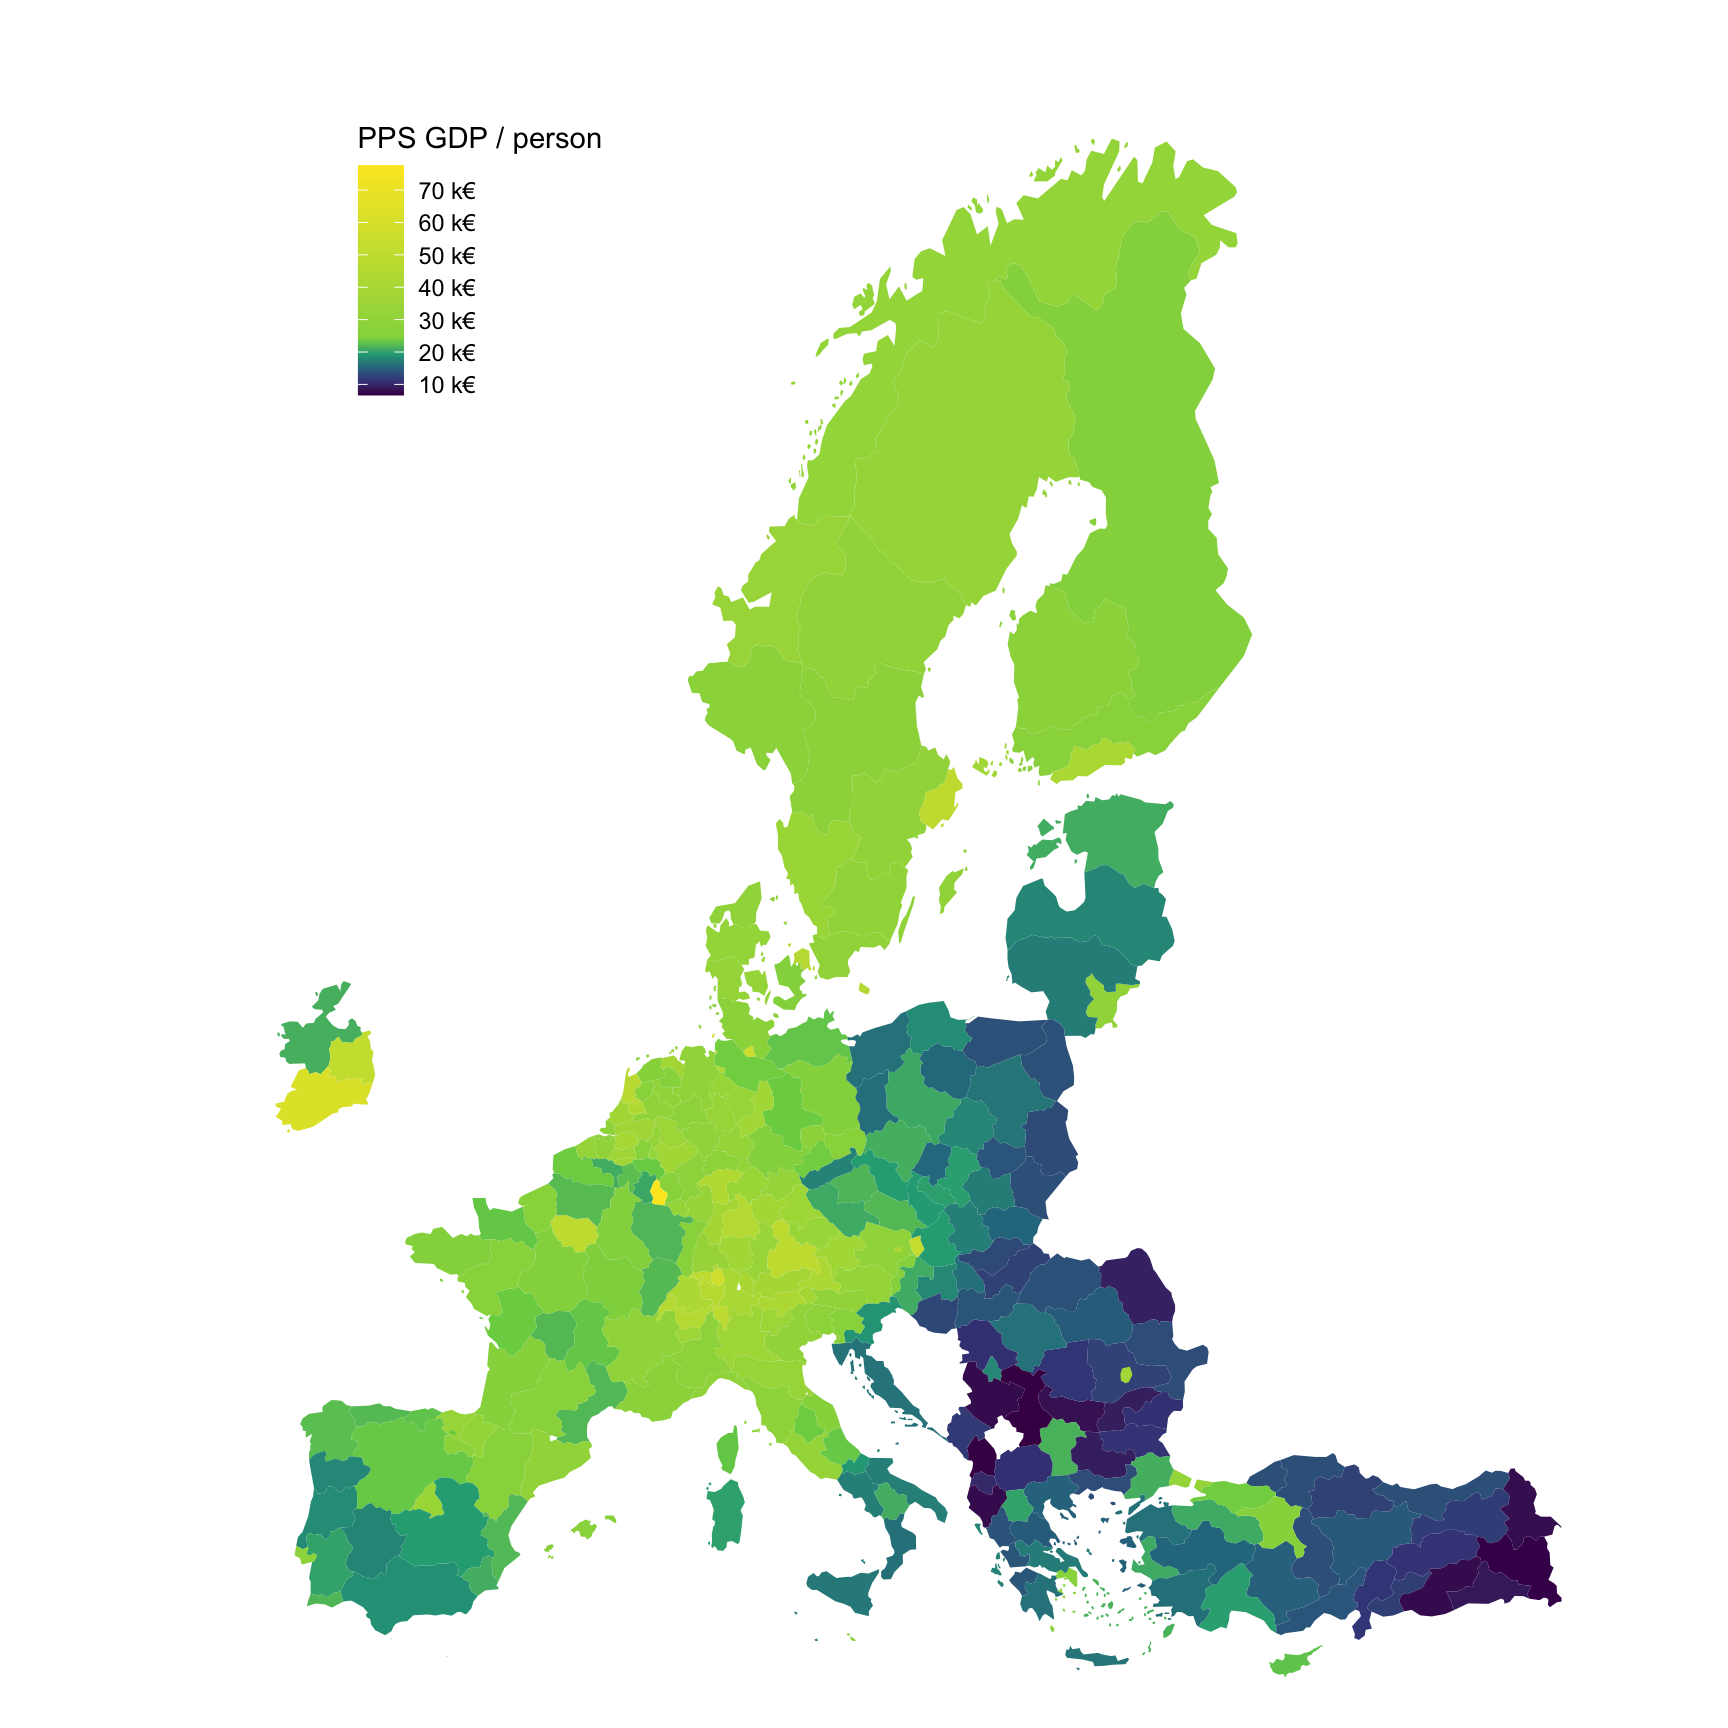
2018
tgs00005 %>%
  filter(time == 2018,
         nchar(geo) == 4) %>%
  right_join(europe_NUTS2, by = "geo") %>%
  filter(long >= -15, lat >= 33) %>%
  ggplot(., aes(x = long, y = lat, group = group, fill = values/1000)) +
  geom_polygon() + coord_map() +
  scale_fill_viridis_c(na.value = "white",
                       labels = scales::dollar_format(accuracy = 1, prefix = "", suffix = " k€"),
                       breaks = seq(0, 2000, 10),
                       values = c(0, 0.05, 0.1, 0.15, 0.2, 0.25, 1)) +
  theme_void() + theme(legend.position = c(0.25, 0.85)) +
  labs(fill = "PPS GDP / person")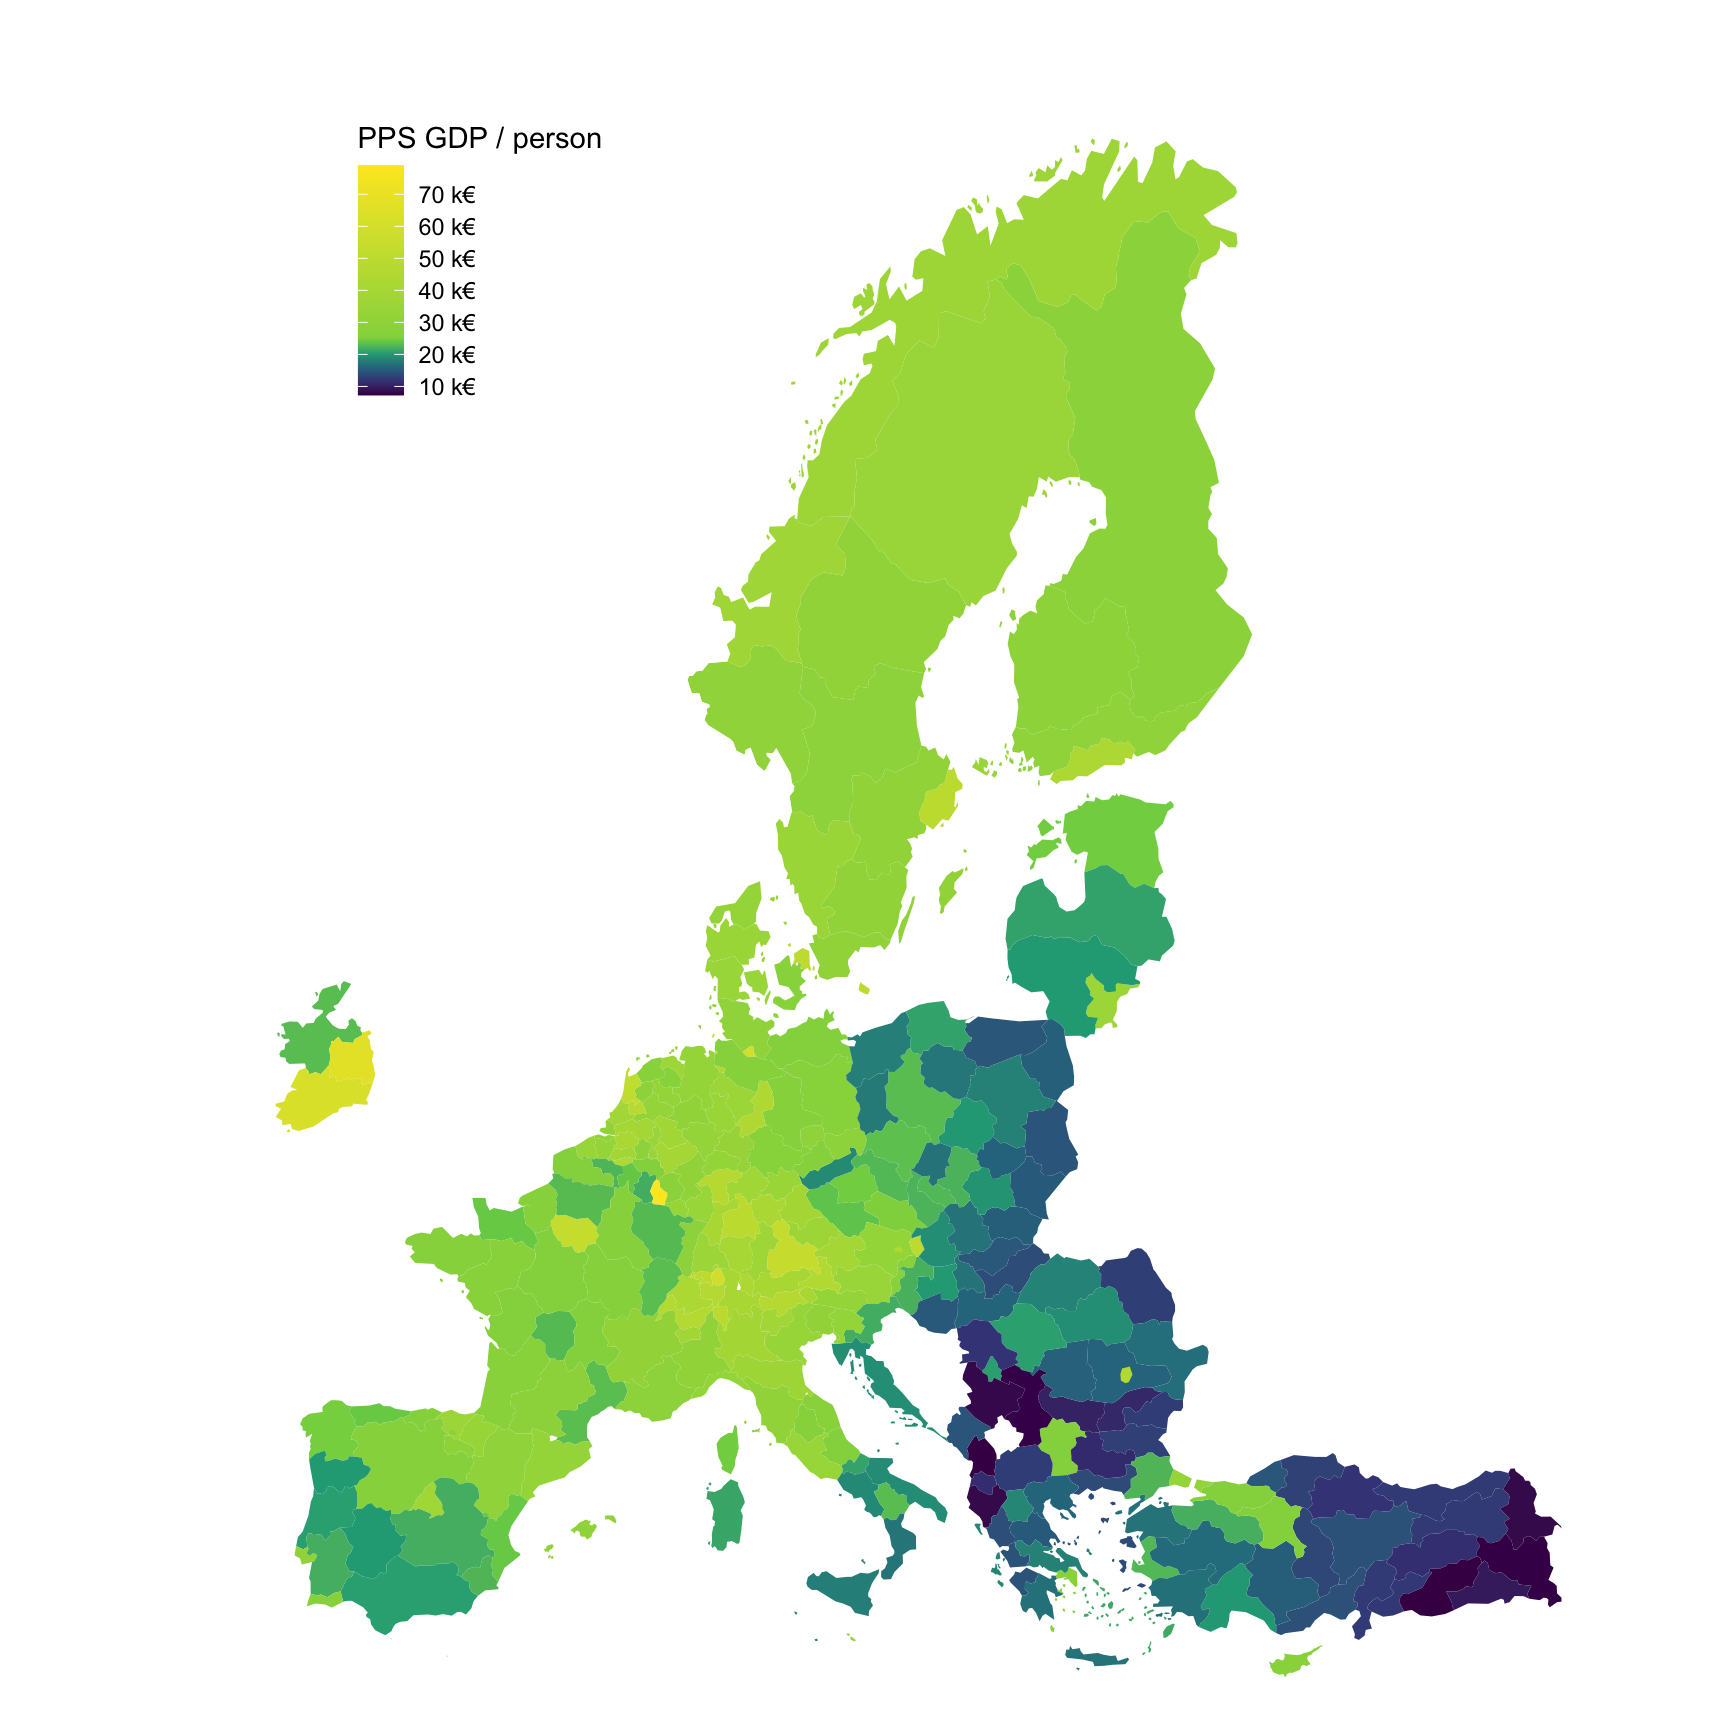
2019
tgs00005 %>%
  filter(time == 2019,
         nchar(geo) == 4) %>%
  right_join(europe_NUTS2, by = "geo") %>%
  filter(long >= -15, lat >= 33) %>%
  ggplot(., aes(x = long, y = lat, group = group, fill = values/1000)) +
  geom_polygon() + coord_map() +
  scale_fill_viridis_c(na.value = "white",
                       labels = scales::dollar_format(accuracy = 1, prefix = "", suffix = " k€"),
                       breaks = seq(0, 2000, 10),
                       values = c(0, 0.05, 0.1, 0.15, 0.2, 0.25, 1)) +
  theme_void() + theme(legend.position = c(0.25, 0.85)) +
  labs(fill = "PPS GDP / person")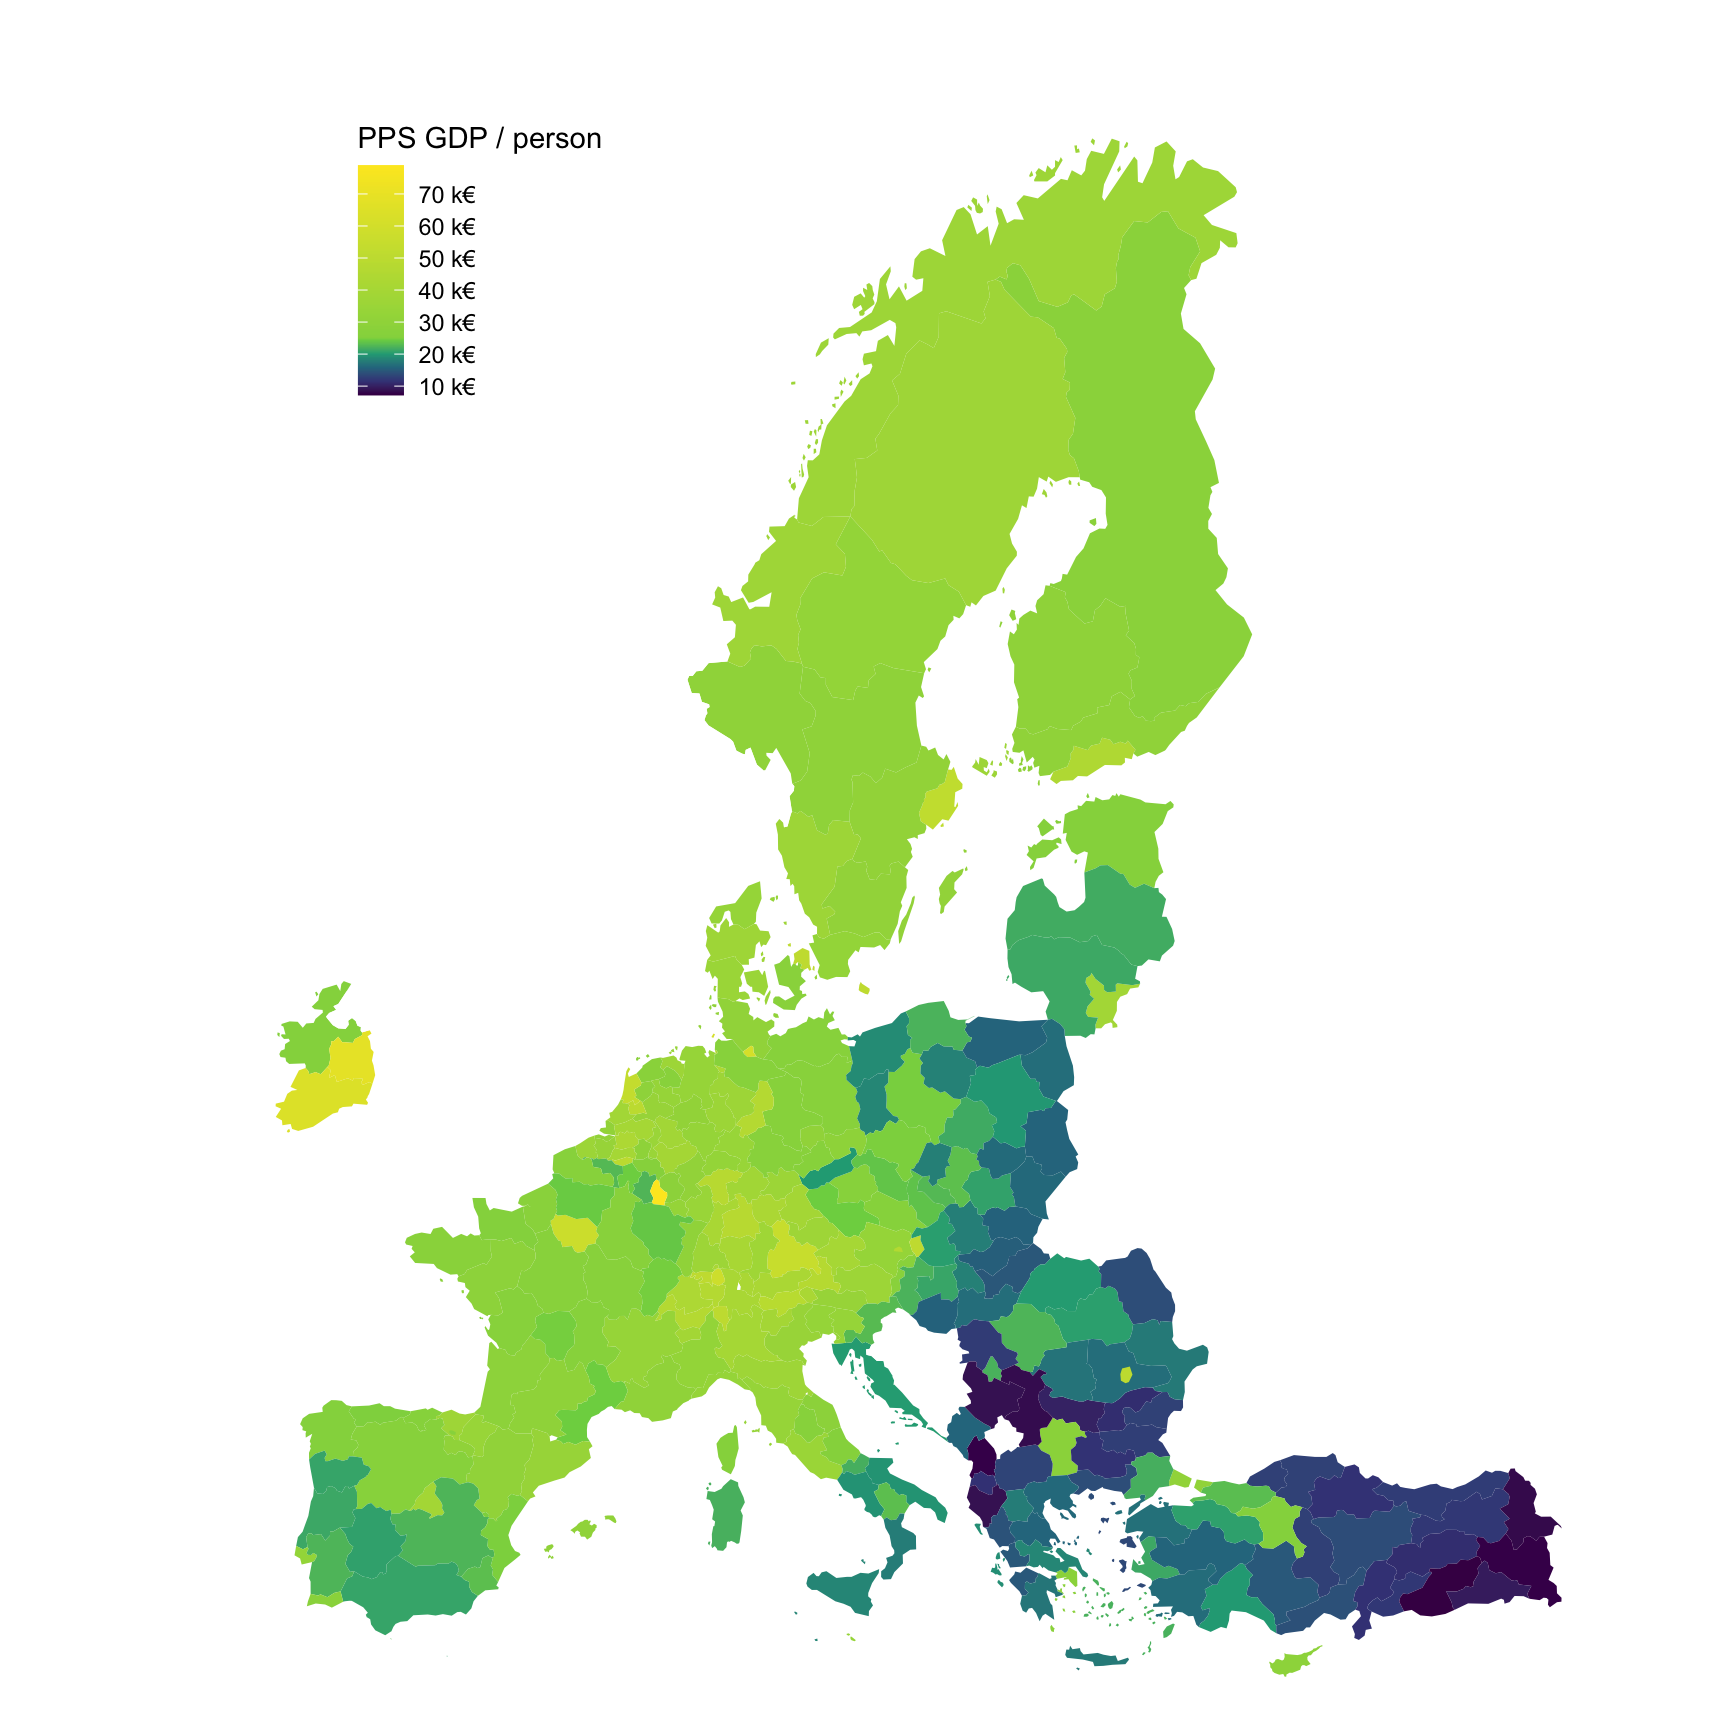
Change 2010-2018
tgs00005 %>%
  filter(time %in% c("2010", "2018"),
         nchar(geo) == 4) %>%
  select(-unit) %>%
  left_join(geo, by = "geo") %>%
  spread(time, values) %>%
  right_join(europe_NUTS2, by = "geo") %>%
  filter(long >= -15, lat >= 33) %>%
  ggplot(., aes(x = long, y = lat, group = group, fill = `2018`/`2010`-1)) +
  geom_polygon() + coord_map() +
  scale_fill_viridis_c(na.value = "white",
                       labels = scales::percent_format(accuracy = 1),
                       breaks = 0.01*seq(-100, 100, 10)) +
  theme_void() + theme(legend.position = c(0.25, 0.85)) +
  labs(fill = "% Growth 2008-18 \n PPS GDP / person")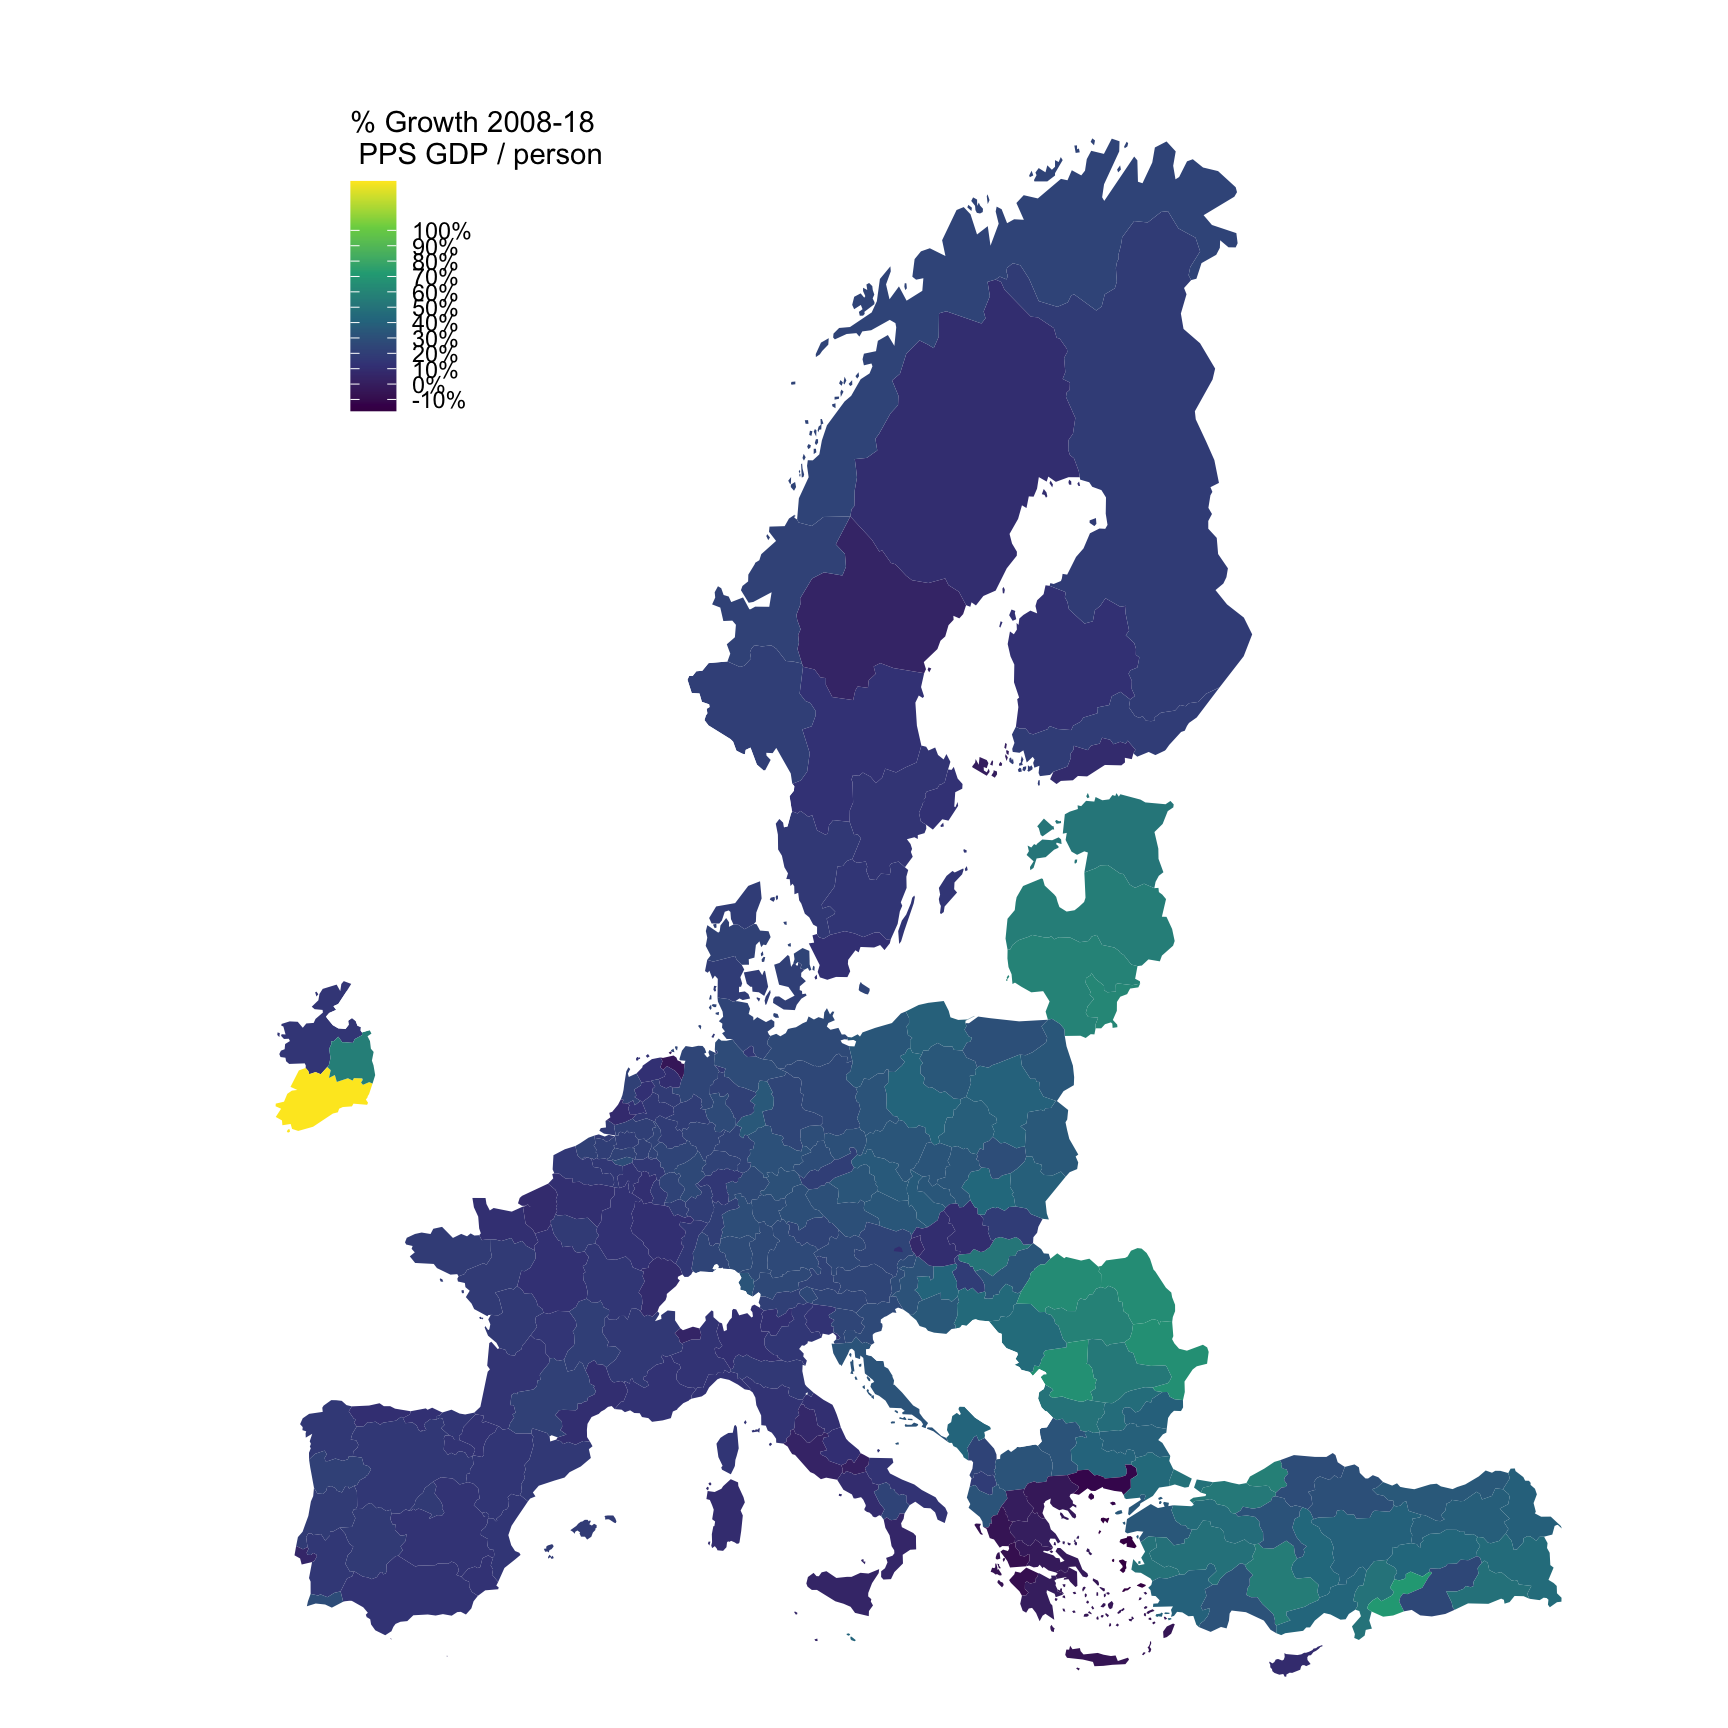
Change 2015-2019
tgs00005 %>%
  filter(time %in% c("2015", "2019"),
         nchar(geo) == 4) %>%
  select(-unit) %>%
  left_join(geo, by = "geo") %>%
  spread(time, values) %>%
  right_join(europe_NUTS2, by = "geo") %>%
  filter(long >= -15, lat >= 33) %>%
  ggplot(., aes(x = long, y = lat, group = group, fill = `2019`/`2015`-1)) +
  geom_polygon() + coord_map() +
  scale_fill_viridis_c(na.value = "white",
                       labels = scales::percent_format(accuracy = 1),
                       breaks = 0.01*seq(-100, 100, 10)) +
  theme_void() + theme(legend.position = c(0.25, 0.85)) +
  labs(fill = "% Growth 2015-19 \n PPS GDP / person")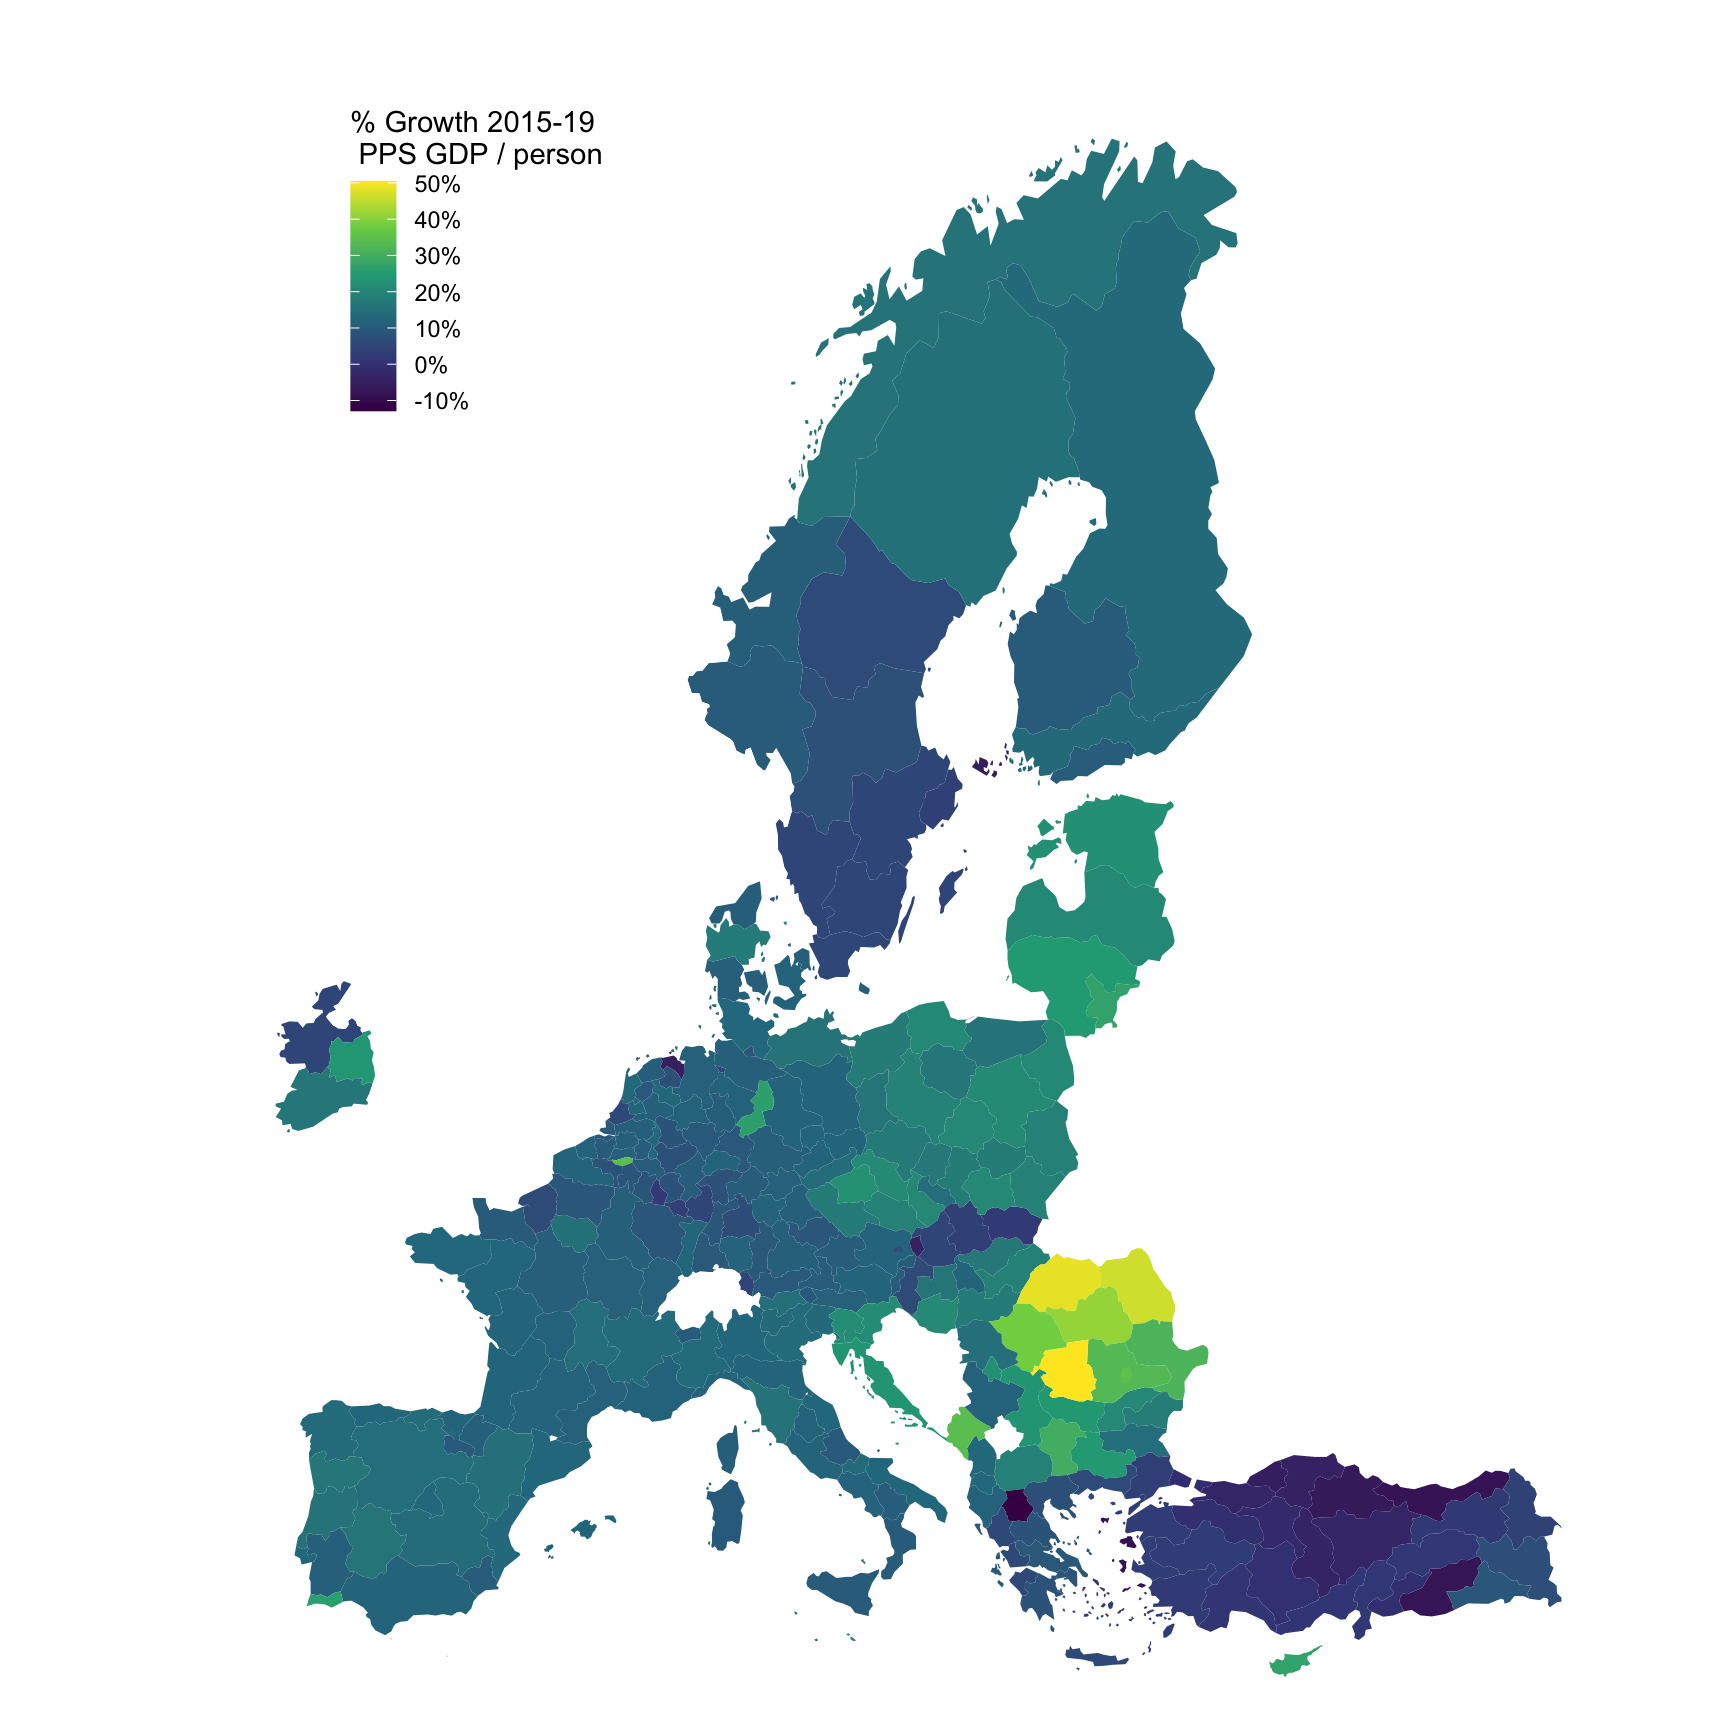
Tables: 2008, 2013, 2018, Growth
tgs00005 %>%
  filter(time %in% c("2010", "2013", "2018")) %>%
  select(-unit) %>%
  left_join(geo, by = "geo") %>%
  spread(time, values) %>%
  mutate(`2008-18` = round(100*(`2018`/`2010`-1), 1)) %>%
  mutate(`2013-18` = round(100*(`2018`/`2013`-1), 1)) %>%
  arrange(-`2008-18`) %>%
  {if (is_html_output()) datatable(., filter = 'top', rownames = F) else .}