
Last observation: juil. 2026 (N = 4848)
First observation: janv. 2000 (N = 198)
Last data update: 07 oct. 2026, 22:16
Last compile: 07 oct. 2026, 23:51
sts_sepr_m |>
  filter(geo %in% c("FR", "DE", "IT", "ES"),
         nace_r2 == "G-N_STS",
         unit == "I15",
         s_adj == "SCA") |>
  month_to_date() |>
  add_flag_color("Geo") |>
  ggplot() + geom_line(aes(x = date, y = values, color = color)) +
  theme_minimal() + scale_color_identity() + add_flags +
  scale_x_date(breaks = as.Date(paste0(seq(2005, 2100, 2), "-01-01")),
               labels = date_format("%Y")) +
  xlab("") + ylab("Production in services, index 2015 = 100")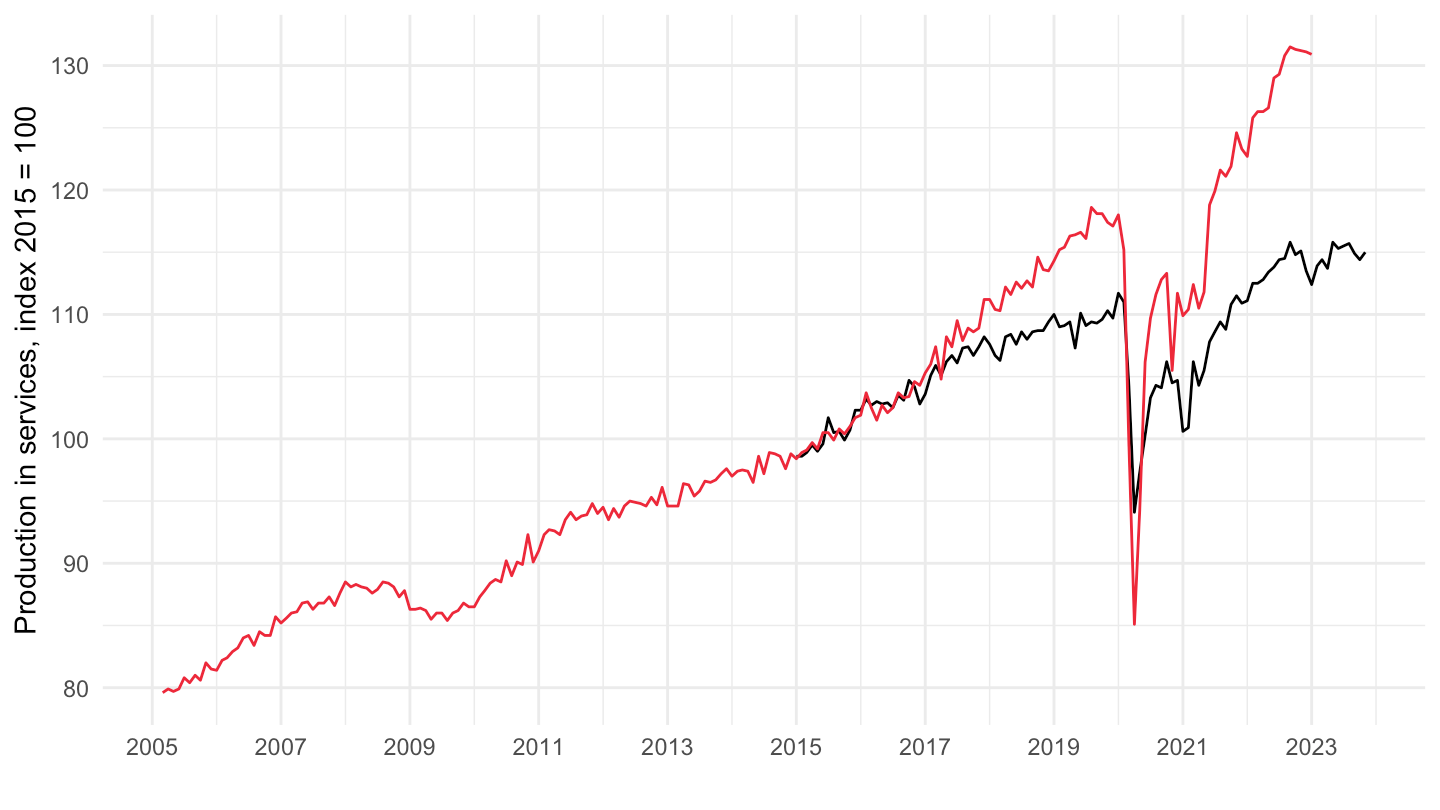
sts_sepr_m |>
  filter(geo == "FR",
         nace_r2 %in% c("H", "I", "J"),
         unit == "I15",
         s_adj == "SCA") |>
  month_to_date() |>
  ggplot() + geom_line(aes(x = date, y = values, color = Nace_r2)) +
  theme_minimal() +
  scale_x_date(breaks = as.Date(paste0(seq(2005, 2100, 2), "-01-01")),
               labels = date_format("%Y")) +
  theme(legend.position = c(0.25, 0.85),
        legend.title = element_blank()) +
  xlab("") + ylab("Production in services, index 2015 = 100")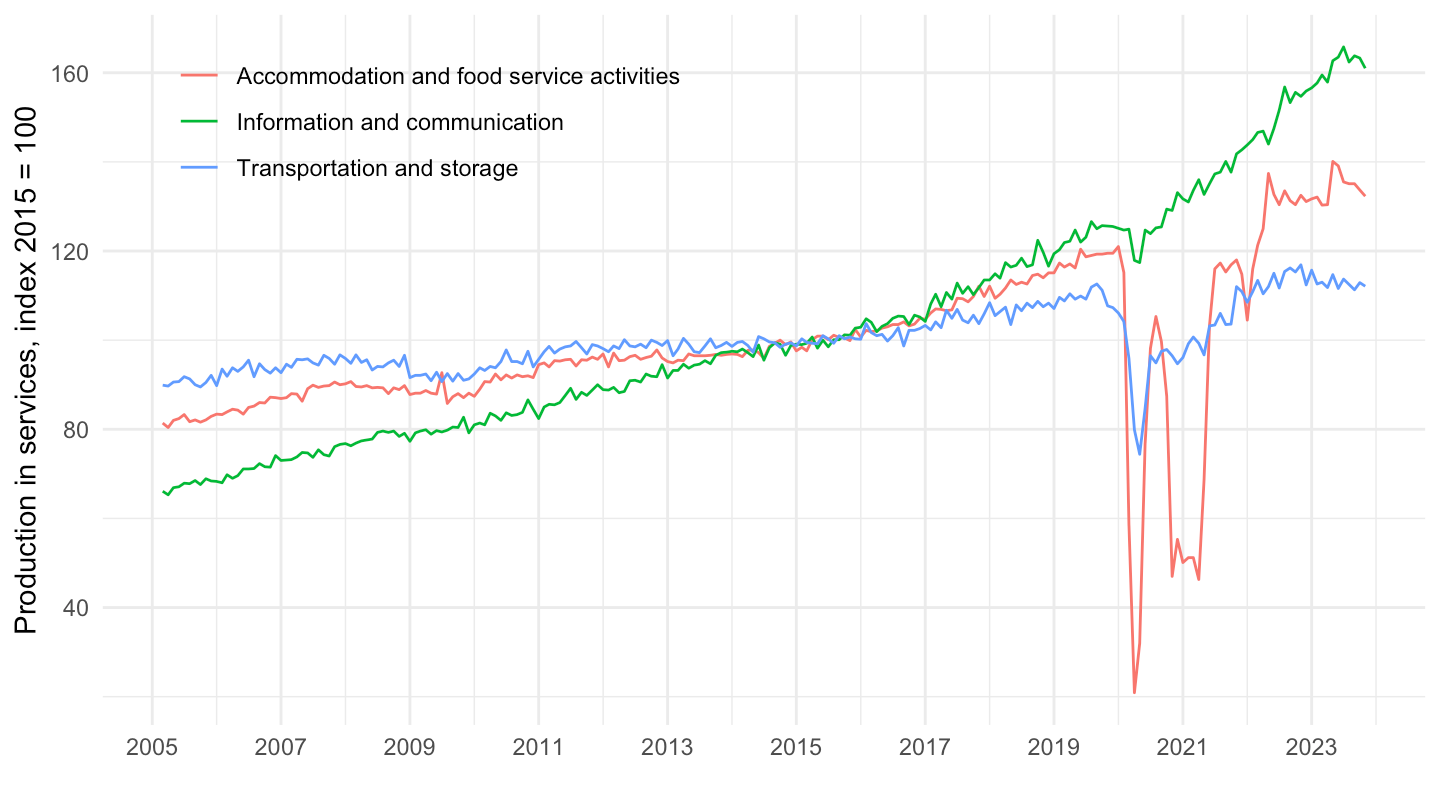
latest_m <- sts_sepr_m |>
  filter(nace_r2 %in% c("H", "I", "J"),
         unit == "PCH_SM",
         s_adj == "CA",
         geo %in% c("FR", "DE", "IT", "ES"),
         !is.na(values)) |>
  summarise(m = max(time)) |>
  pull(m)

sts_sepr_m |>
  filter(nace_r2 %in% c("H", "I", "J"),
         unit == "PCH_SM",
         s_adj == "CA",
         geo %in% c("FR", "DE", "IT", "ES"),
         time == latest_m) |>
  select(Nace_r2, Geo, values) |>
  spread(Geo, values) |>
print_table_conditional()| Nace_r2 | France | Germany | Italy | Spain |
|---|---|---|---|---|
| Accommodation and food service activities | 0.9 | -3.0 | -0.8 | -5.2 |
| Information and communication | 1.4 | -1.5 | 5.4 | 2.7 |
| Transportation and storage | 2.7 | -0.6 | 0.4 | 3.9 |
sts_sepr_m |>
  filter(nace_r2 == "G-N_STS",
         unit == "I15",
         s_adj == "SCA",
         time %in% c("2019M11", "2020M02", "2020M03", "2020M04", "2020M05", "2020M08", "2020M11"),
         !(geo %in% c("IE", "EU28"))) |>
  select(geo, Geo, time, values) |>
  group_by(geo) |>
  filter(any(time == "2019M11" & !is.na(values))) |>
  mutate(values = 100*values/values[time == "2019M11"]) |>

  spread(time, values) |>
  mutate(Geo = ifelse(geo == "DE", "Germany", Geo)) |>
  mutate(Flag = gsub(" ", "-", str_to_lower(Geo)),
         Flag = paste0('<img src="../../bib/flags/vsmall/', Flag, '.png" alt="Flag">')) |>
  select(Flag, everything()) |>
  arrange(`2020M04`) %>%
  {if (is_html_output()) datatable(., filter = 'top', rownames = F, escape = F) else .}