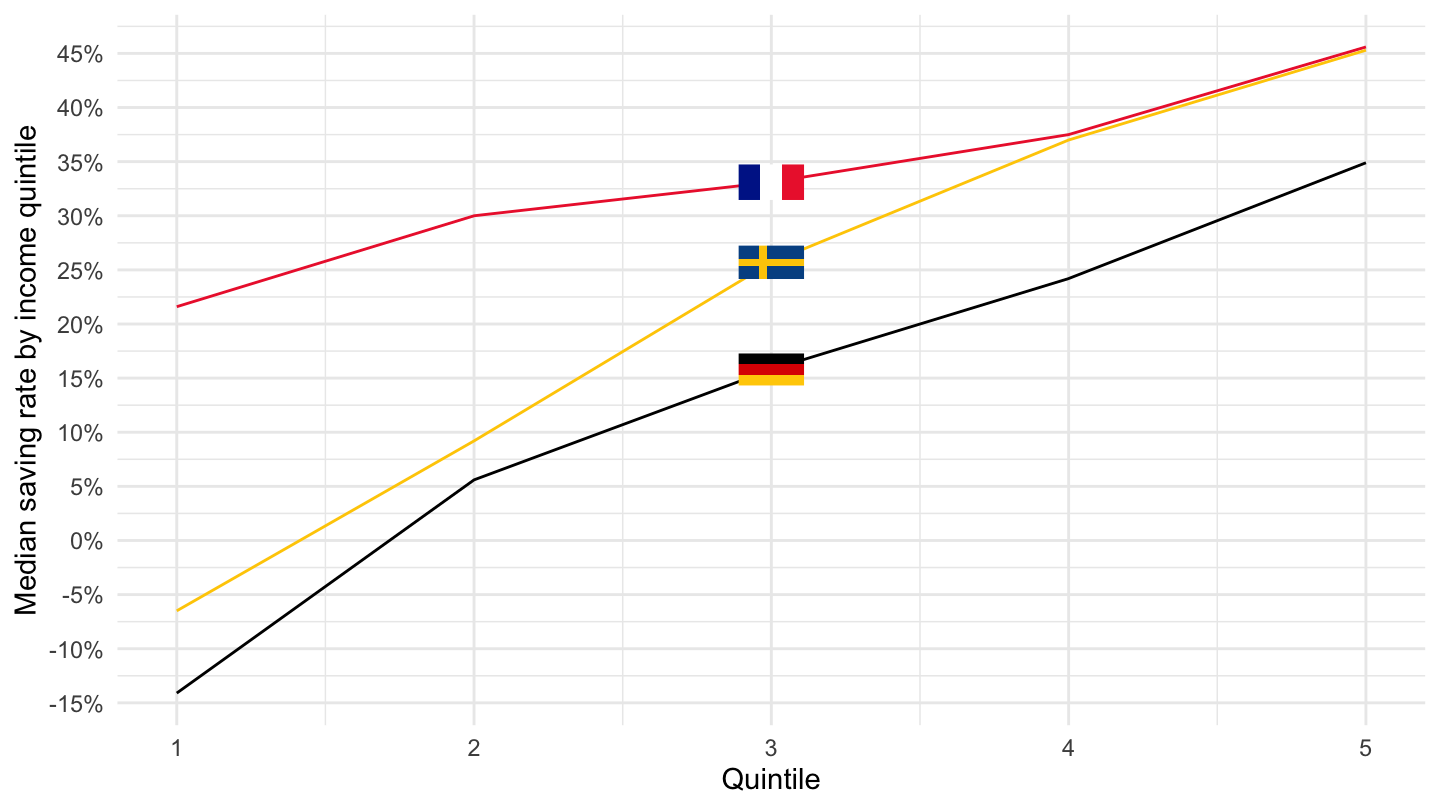
Median saving rate by income quintile - experimental statistics - icw_sr_03
Data - Eurostat
François Geerolf
quantile
icw_sr_03 %>%
  left_join(quantile, by = "quantile") %>%
  group_by(quantile, Quantile) %>%
  summarise(Nobs = n()) %>%
  arrange(-Nobs) %>%
print_table_conditional()| quantile | Quantile | Nobs |
|---|---|---|
| QU1 | First quintile | 58 |
| QU2 | Second quintile | 58 |
| QU3 | Third quintile | 58 |
| QU4 | Fourth quintile | 58 |
| QU5 | Fifth quintile | 58 |
| TOTAL | Total | 58 |
unit
icw_sr_03 %>%
  left_join(unit, by = "unit") %>%
  group_by(unit, Unit) %>%
  summarise(Nobs = n()) %>%
  arrange(-Nobs) %>%
print_table_conditional()| unit | Unit | Nobs |
|---|---|---|
| PC_DI | Percentage of disposable income | 348 |
geo
icw_sr_03 %>%
  left_join(geo, by = "geo") %>%
  group_by(geo, Geo) %>%
  summarise(Nobs = n()) %>%
  arrange(-Nobs) %>%
  mutate(Geo = ifelse(geo == "DE", "Germany", Geo)) %>%
  mutate(Flag = gsub(" ", "-", str_to_lower(Geo)),
         Flag = paste0('<img src="../../bib/flags/vsmall/', Flag, '.png" alt="Flag">')) %>%
  select(Flag, everything()) %>%
  {if (is_html_output()) datatable(., filter = 'top', rownames = F, escape = F) else .}
time
icw_sr_03 %>%
  group_by(time) %>%
  summarise(Nobs = n()) %>%
  arrange(-Nobs) %>%
print_table_conditional()| time | Nobs |
|---|---|
| 2015 | 186 |
| 2010 | 162 |
Tables
2010
icw_sr_03 %>%
  filter(time == "2010") %>%
  select(quantile, geo, values) %>%
  left_join(geo, by = "geo") %>%
  spread(quantile, values) %>%
  select(geo, Geo, TOTAL, everything()) %>%
  mutate(Geo = ifelse(geo == "DE", "Germany", Geo)) %>%
  mutate(Flag = gsub(" ", "-", str_to_lower(Geo)),
         Flag = paste0('<img src="../../bib/flags/vsmall/', Flag, '.png" alt="Flag">')) %>%
  select(Flag, everything()) %>%
  arrange(-`TOTAL`) %>%
  {if (is_html_output()) datatable(., filter = 'top', rownames = F, escape = F) else .}
2015
icw_sr_03 %>%
  filter(time == "2015") %>%
  select(quantile, geo, values) %>%
  left_join(geo, by = "geo") %>%
  spread(quantile, values) %>%
  select(geo, Geo, TOTAL, everything()) %>%
  mutate(Geo = ifelse(geo == "DE", "Germany", Geo)) %>%
  mutate(Flag = gsub(" ", "-", str_to_lower(Geo)),
         Flag = paste0('<img src="../../bib/flags/vsmall/', Flag, '.png" alt="Flag">')) %>%
  select(Flag, everything()) %>%
  arrange(-`TOTAL`) %>%
  {if (is_html_output()) datatable(., filter = 'top', rownames = F, escape = F) else .}
Germany, France, Sweden
icw_sr_03 %>%
  filter(time == "2015",
         geo %in% c("SE", "FR", "DE")) %>%
  mutate(quantile = substr(quantile, 3, 3) %>% as.numeric) %>%
  left_join(geo, by = "geo") %>%
  left_join(colors, by = c("Geo" = "country")) %>%
  ggplot + geom_line(aes(x = quantile, y = values/100, color = color)) +
  scale_color_identity() + theme_minimal() +
  geom_image(data = . %>%
               filter(quantile == 3) %>%
               mutate(image = paste0("../../icon/flag/", str_to_lower(gsub(" ", "-", Geo)), ".png")),
             aes(x = quantile, y = values/100, image = image), asp = 1.5) +
  xlab("Quintile") + ylab("Median saving rate by income quintile") +
  scale_y_continuous(breaks = 0.01*seq(-30, 50, 5),
                     labels = percent_format(accuracy = 1)) +
  scale_x_continuous(breaks = seq(0, 5, 1))
Portugal, Spain, United Kingdom
icw_sr_03 %>%
  filter(time == "2015",
         geo %in% c("UK", "ES", "PT")) %>%
  mutate(quantile = substr(quantile, 3, 3) %>% as.numeric) %>%
  left_join(geo, by = "geo") %>%
  left_join(colors, by = c("Geo" = "country")) %>%
  ggplot + geom_line(aes(x = quantile, y = values/100, color = color)) +
  scale_color_identity() + theme_minimal() +
  geom_image(data = . %>%
               filter(quantile == 5) %>%
               mutate(image = paste0("../../icon/flag/", str_to_lower(gsub(" ", "-", Geo)), ".png")),
             aes(x = quantile, y = values/100, image = image), asp = 1.5) +
  xlab("Quintile") + ylab("Median saving rate by income quintile") +
  scale_y_continuous(breaks = 0.01*seq(-30, 50, 5),
                     labels = percent_format(accuracy = 1)) +
  scale_x_continuous(breaks = seq(0, 5, 1))