Code
tibble(DOWNLOAD_TIME = as.Date(file.info("~/iCloud/website/data/eurostat/gov_10a_exp.RData")$mtime)) %>%
print_table_conditional()| DOWNLOAD_TIME |
|---|
| 2026-03-26 |
Data - Eurostat
tibble(DOWNLOAD_TIME = as.Date(file.info("~/iCloud/website/data/eurostat/gov_10a_exp.RData")$mtime)) %>%
print_table_conditional()| DOWNLOAD_TIME |
|---|
| 2026-03-26 |
gov_10a_exp %>%
  group_by(time) %>%
  summarise(Nobs = n()) %>%
  arrange(desc(time)) %>%
  head(1) %>%
print_table_conditional()| time | Nobs |
|---|---|
| 2024 | 924167 |
gov_10a_exp %>%
  left_join(unit, by = "unit") %>%
  group_by(unit, Unit) %>%
  summarise(Nobs = n()) %>%
  arrange(-Nobs) %>%
print_table_conditional| unit | Unit | Nobs |
|---|---|---|
| MIO_EUR | Million euro | 10203443 |
| PC_GDP | Percentage of gross domestic product (GDP) | 10203443 |
| MIO_NAC | Million units of national currency | 10203410 |
| PC_TOT | Percentage of total | 4945279 |
gov_10a_exp %>%
  left_join(sector, by = "sector") %>%
  group_by(sector, Sector) %>%
  summarise(Nobs = n()) %>%
  arrange(-Nobs) %>%
print_table_conditional| sector | Sector | Nobs |
|---|---|---|
| S13 | General government | 8058050 |
| S1311 | Central government | 7110684 |
| S1313 | Local government | 7014547 |
| S1314 | Social security funds | 6832125 |
| S1312 | State government | 6540169 |
gov_10a_exp %>%
  left_join(cofog99, by = "cofog99") %>%
  group_by(cofog99, Cofog99) %>%
  summarise(Nobs = n()) %>%
print_table_conditionalgov_10a_exp %>%
left_join(cofog99, by = "cofog99") %>%
group_by(cofog99, Cofog99) %>%
summarise(Nobs = n()) %>%
filter(nchar(cofog99) == 4) %>%
print_table_conditional| cofog99 | Cofog99 | Nobs |
|---|---|---|
| GF01 | Services généraux des administrations publiques | 512652 |
| GF02 | Défense | 509908 |
| GF03 | Ordre et sécurité publics | 510558 |
| GF04 | Affaires économiques | 510771 |
| GF05 | Protection de l'environnement | 510506 |
| GF06 | Logements et équipements collectifs | 510670 |
| GF07 | Santé | 513294 |
| GF08 | Loisirs, culture et culte | 512271 |
| GF09 | Enseignement | 511873 |
| GF10 | Protection sociale | 514405 |
gov_10a_exp %>%
  left_join(na_item, by = "na_item") %>%
  group_by(na_item, Na_item) %>%
  summarise(Nobs = n()) %>%
  arrange(-Nobs) %>%
print_table_conditionalgov_10a_exp %>%
left_join(geo, by = "geo") %>%
group_by(geo, Geo) %>%
summarise(Nobs = n()) %>%
arrange(-Nobs) %>%
mutate(Flag = gsub(" ", "-", str_to_lower(Geo)),
Flag = paste0('<img src="../../bib/flags/vsmall/', Flag, '.png" alt="Flag">')) %>%
select(Flag, everything()) %>%
{if (is_html_output()) datatable(., filter = 'top', rownames = F, escape = F) else .}gov_10a_exp %>%
group_by(time) %>%
summarise(Nobs = n()) %>%
{if (is_html_output()) datatable(., filter = 'top', rownames = F) else .}gov_10a_exp %>%
filter(geo %in% c("FR", "DE"),
unit == "MIO_EUR",
sector == "S13",
time == "2022",
na_item == "TE",
substr(cofog99, 1, 4) == "GF09") %>%
select_if(~ n_distinct(.) > 1) %>%
left_join(cofog99, by = "cofog99") %>%
#select(-na_item) %>%
spread(geo, values) %>%
print_table_conditional()| cofog99 | Cofog99 | DE | FR |
|---|---|---|---|
| GF09 | Enseignement | 173693 | 134016.9 |
| GF0901 | Enseignement préélémentaire et primaire | 56966 | 36977.8 |
| GF0902 | Enseignement secondaire | 62588 | 58206.0 |
| GF0903 | Enseignement postsecondaire non supérieur | 2686 | 1041.1 |
| GF0904 | Enseignement supérieur | 30596 | 12430.1 |
| GF0905 | Enseignement non défini par niveau | 3401 | 8636.6 |
| GF0906 | Services annexes à l'enseignement | 15044 | 16124.9 |
| GF0907 | R & D dans le domaine de l'enseignement | 350 | 4.1 |
| GF0908 | Enseignement n.c.a. | 2062 | 596.4 |
gov_10a_exp %>%
  filter(geo %in% c("FR", "DE"),
         unit == "MIO_EUR",
         sector == "S13",
         time == "2021",
         na_item == "TE",
         substr(cofog99, 1, 4) == "GF09") %>%
  select_if(~ n_distinct(.) > 1) %>%
  left_join(cofog99, by = "cofog99") %>%
  #select(-na_item) %>%
  spread(geo, values) %>%
print_table_conditional()| cofog99 | Cofog99 | DE | FR |
|---|---|---|---|
| GF09 | Enseignement | 164474 | 127071.8 |
| GF0901 | Enseignement préélémentaire et primaire | 54587 | 35093.0 |
| GF0902 | Enseignement secondaire | 60148 | 55476.9 |
| GF0903 | Enseignement postsecondaire non supérieur | 2603 | 905.1 |
| GF0904 | Enseignement supérieur | 28114 | 11335.7 |
| GF0905 | Enseignement non défini par niveau | 3156 | 8046.8 |
| GF0906 | Services annexes à l'enseignement | 13511 | 15590.7 |
| GF0907 | R & D dans le domaine de l'enseignement | 381 | 5.2 |
| GF0908 | Enseignement n.c.a. | 1974 | 618.4 |
gov_10a_exp %>%
  filter(geo %in% c("FR", "DE"),
         unit == "PC_GDP",
         sector == "S13",
         cofog99 == "TOTAL",
         na_item == "TE") %>%
  year_to_date %>%
  select(date, geo, na_item, values) %>%
  left_join(geo , by = "geo") %>%
  mutate(values = values / 100) %>%
  left_join(colors, by = c("Geo" = "country")) %>%
  ggplot + geom_line(aes(x = date, y = values, color = color)) +
  theme_minimal()  + add_2flags + xlab("") + ylab("") + scale_color_identity() +
  scale_x_date(breaks = as.Date(paste0(seq(1960,2100,  5), "-01-01")),
               labels = date_format("%Y")) +
  scale_y_continuous(breaks = 0.01*seq(-30, 80, 2),
                labels = percent_format(a = 1))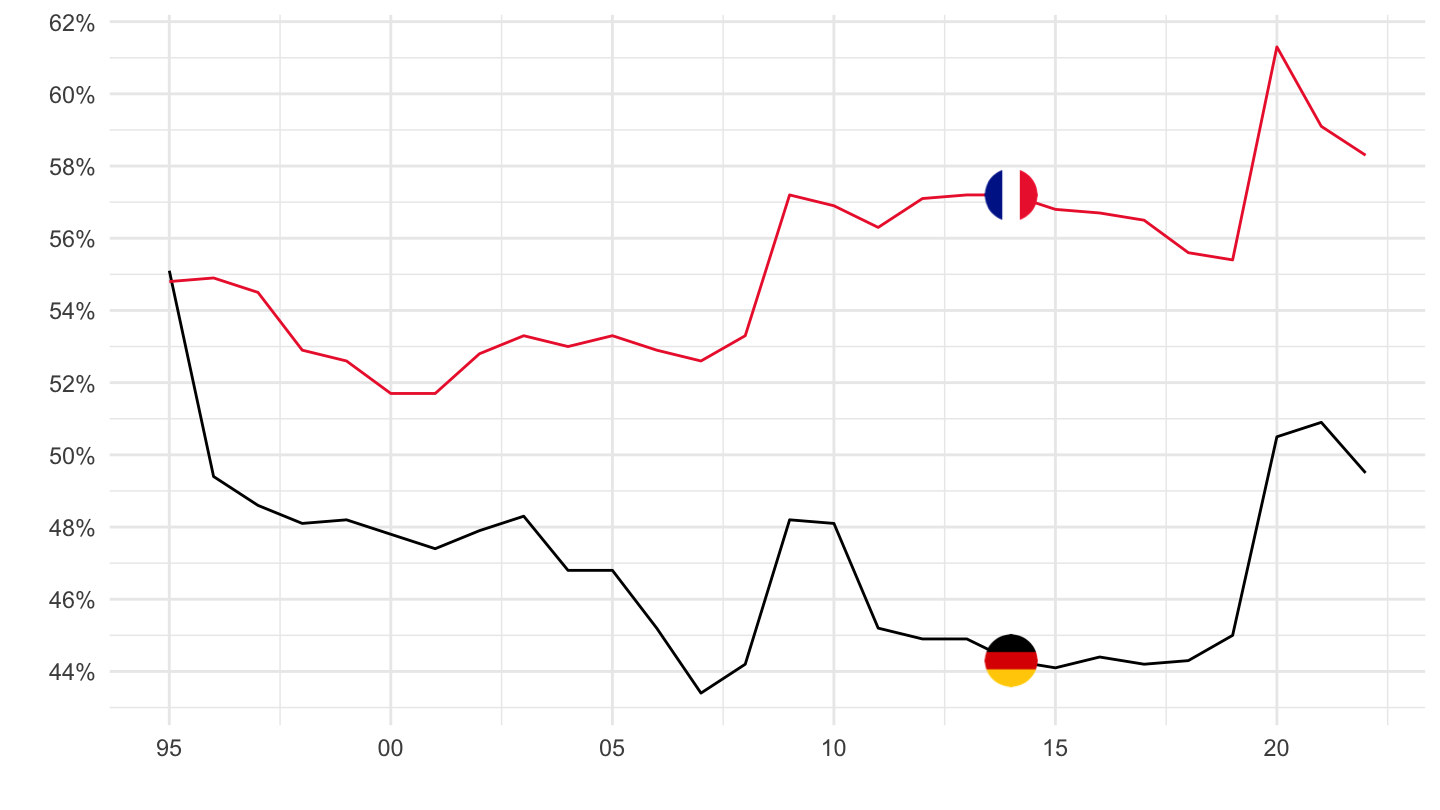
gov_10a_exp %>%
  filter(geo %in% c("FR", "DE"),
         unit == "PC_GDP",
         sector == "S13",
         cofog99 == "GF09",
         na_item == "TE") %>%
  year_to_date %>%
  select(date, geo, na_item, values) %>%
  left_join(geo , by = "geo") %>%
  mutate(values = values / 100) %>%
  left_join(colors, by = c("Geo" = "country")) %>%
  ggplot + geom_line(aes(x = date, y = values, color = color)) +
  theme_minimal()  + add_2flags + xlab("") + ylab("") + scale_color_identity() +
  scale_x_date(breaks = as.Date(paste0(seq(1960,2100,  5), "-01-01")),
               labels = date_format("%Y")) +
  scale_y_continuous(breaks = 0.01*seq(-30, 80, 0.2),
                labels = percent_format(a = .1))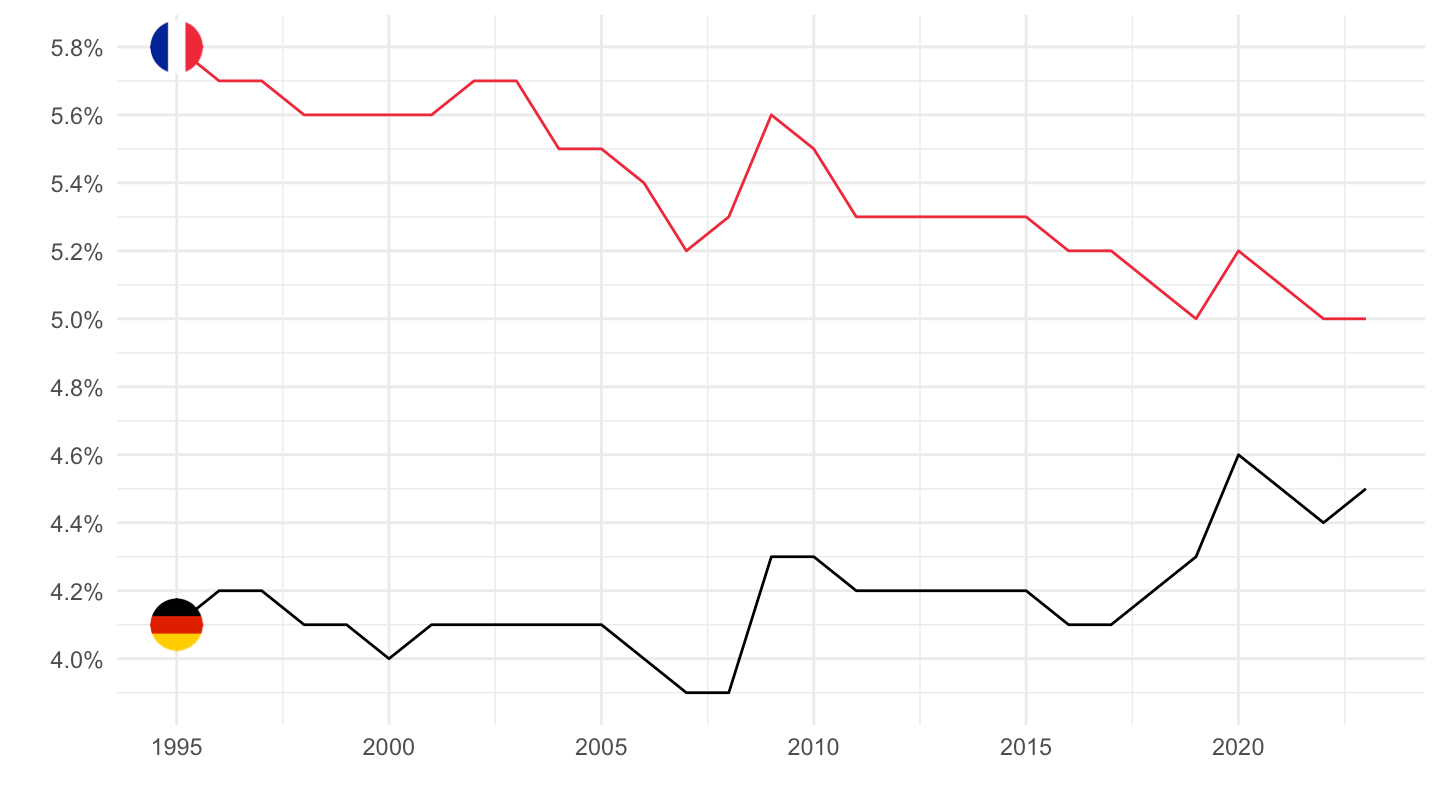
gov_10a_exp %>%
  filter(geo %in% c("FR", "DE"),
         unit == "MIO_EUR",
         sector == "S13",
         cofog99 == "GF09",
         na_item == "TE") %>%
  year_to_date %>%
  select(date, geo, na_item, values) %>%
  left_join(geo , by = "geo") %>%
  mutate(values = values / 1000) %>%
  left_join(colors, by = c("Geo" = "country")) %>%
  ggplot + geom_line(aes(x = date, y = values, color = color)) +
  theme_minimal()  + add_2flags + xlab("") + ylab("") + scale_color_identity() +
  scale_x_date(breaks = as.Date(paste0(seq(1960,2100,  5), "-01-01")),
               labels = date_format("%Y")) +
  scale_y_continuous(breaks = seq(-30, 300, 10))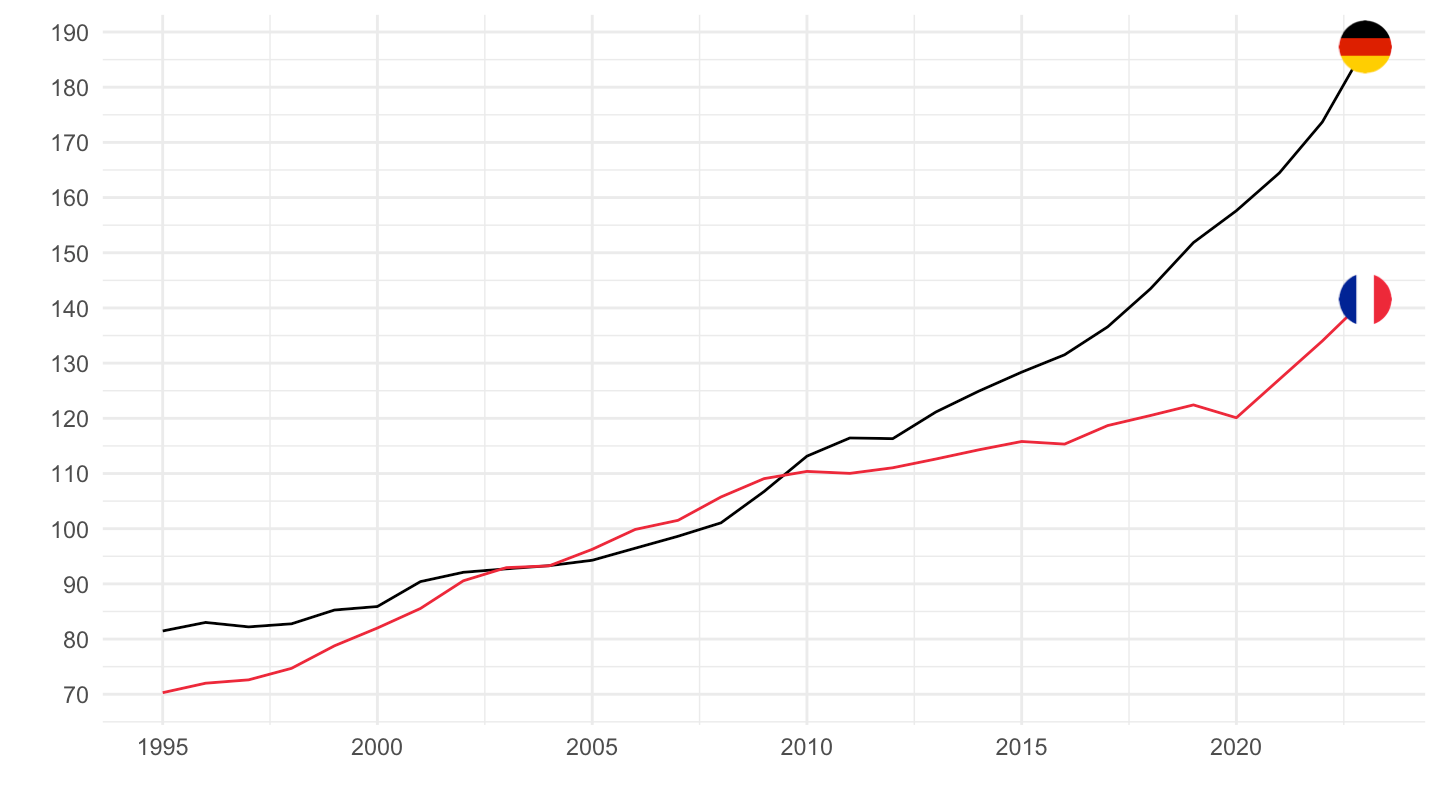
gov_10a_exp %>%
  filter(geo %in% c("FR", "DE"),
         unit == "MIO_EUR",
         sector == "S13",
         cofog99 == "TOTAL",
         na_item %in% c("P5", "TE")) %>%
  year_to_date %>%
  select(date, geo, na_item, values) %>%
  spread(na_item, values) %>%
  left_join(geo , by = "geo") %>%
  mutate(values = P5 / TE) %>%
  ggplot + geom_line(aes(x = date, y = values, color = Geo)) +
  theme_minimal()  +
  scale_x_date(breaks = as.Date(paste0(seq(1960,2100,  5), "-01-01")),
               labels = date_format("%Y")) +
  add_2flags +
  scale_color_manual(values = c("#002395", "#000000")) +
  theme(legend.position = "none") +
  xlab("") + ylab("Eurostat (P5 / TE de gov_10a_exp)") +
  scale_y_continuous(breaks = 0.01*seq(-30, 30, 1),
                labels = percent_format(a = 1))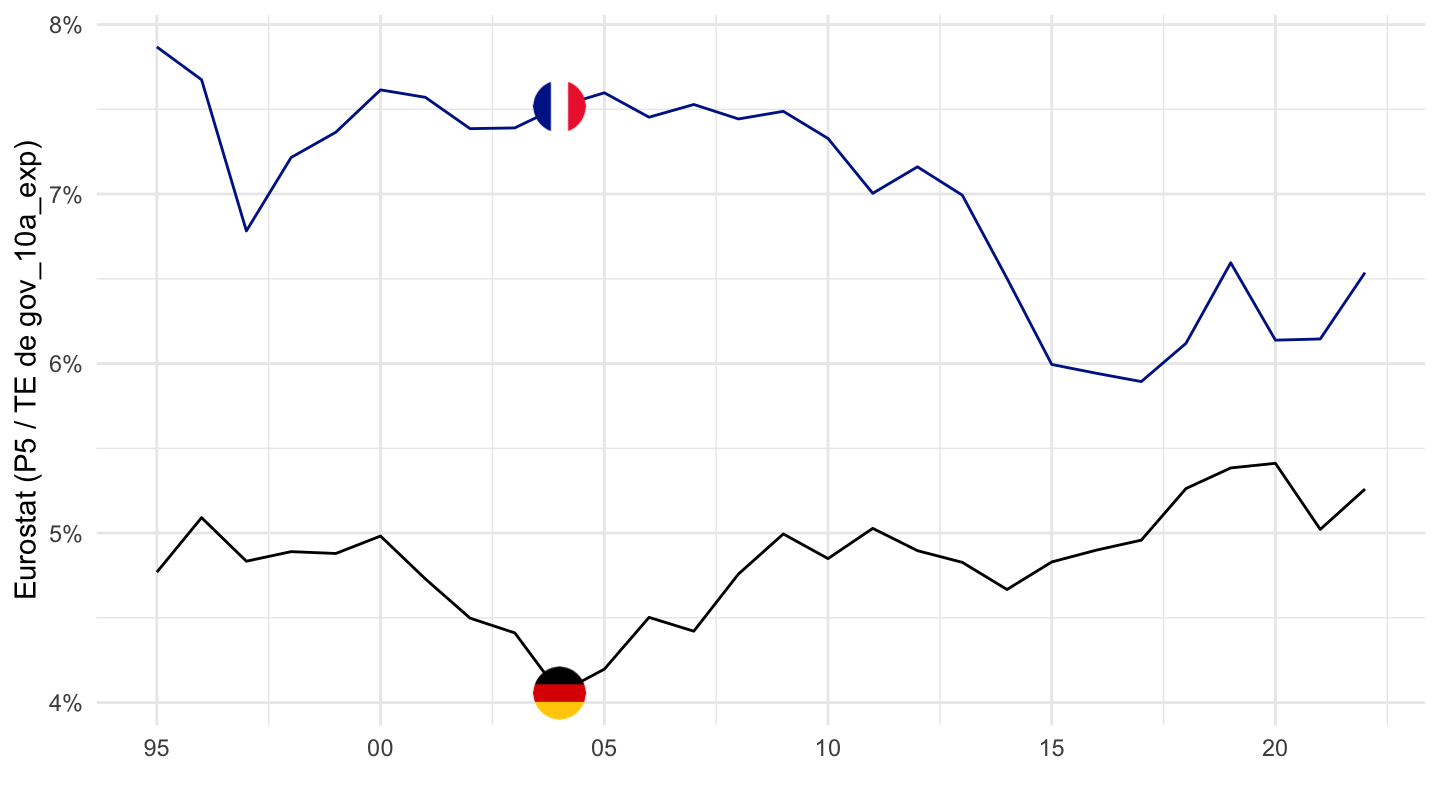
gov_10a_exp %>%
  filter(geo %in% c("FR", "DE"),
         unit == "PC_TOT",
         sector == "S13",
         cofog99 == "GF09",
         na_item == "P5") %>%
  year_to_date %>%
  left_join(geo , by = "geo") %>%
  ggplot + geom_line(aes(x = date, y = values / 100, color = Geo)) +
  theme_minimal()  +
  scale_x_date(breaks = as.Date(paste0(seq(1960,2100,  5), "-01-01")),
               labels = date_format("%Y")) +
  scale_color_manual(values = viridis(3)[1:2]) +
  theme(legend.position = c(0.35, 0.85),
        legend.title = element_blank()) +
  xlab("") + ylab("GF01 - Services généraux des admin pub") +
  scale_y_continuous(breaks = 0.01*seq(-30, 30, 1),
                labels = percent_format(a = 1))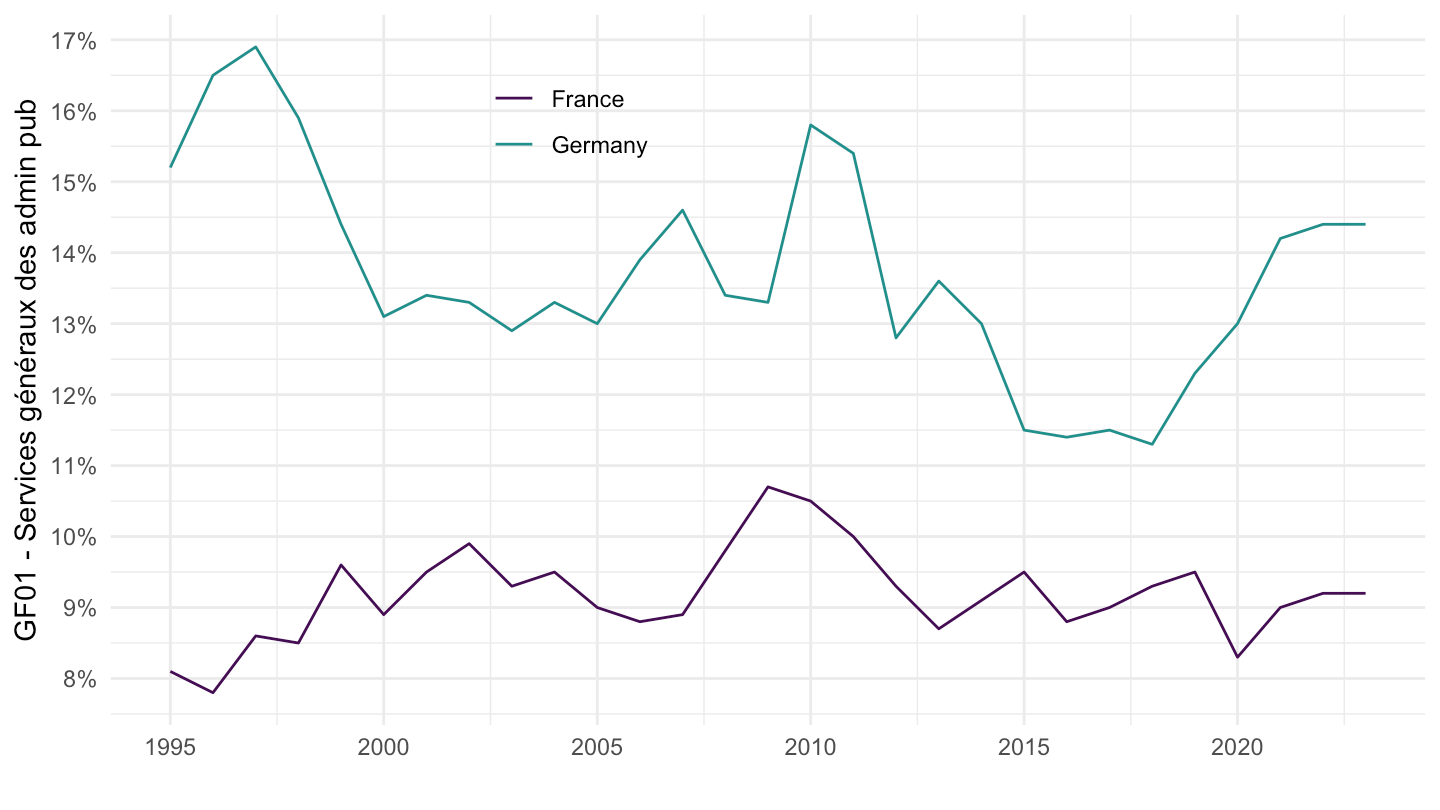
gov_10a_exp %>%
  filter(geo %in% c("FR", "DE"),
         unit == "PC_TOT",
         sector == "S13",
         cofog99 == "GF01",
         na_item == "P5") %>%
  year_to_date %>%
  left_join(geo , by = "geo") %>%
  ggplot + geom_line(aes(x = date, y = values / 100, color = Geo)) +
  theme_minimal()  +
  scale_x_date(breaks = as.Date(paste0(seq(1960,2100,  5), "-01-01")),
               labels = date_format("%Y")) +
  scale_color_manual(values = viridis(3)[1:2]) +
  theme(legend.position = c(0.35, 0.85),
        legend.title = element_blank()) +
  xlab("") + ylab("GF01 - Services généraux des admin pub") +
  scale_y_continuous(breaks = 0.01*seq(-30, 30, 1),
                labels = percent_format(a = 1))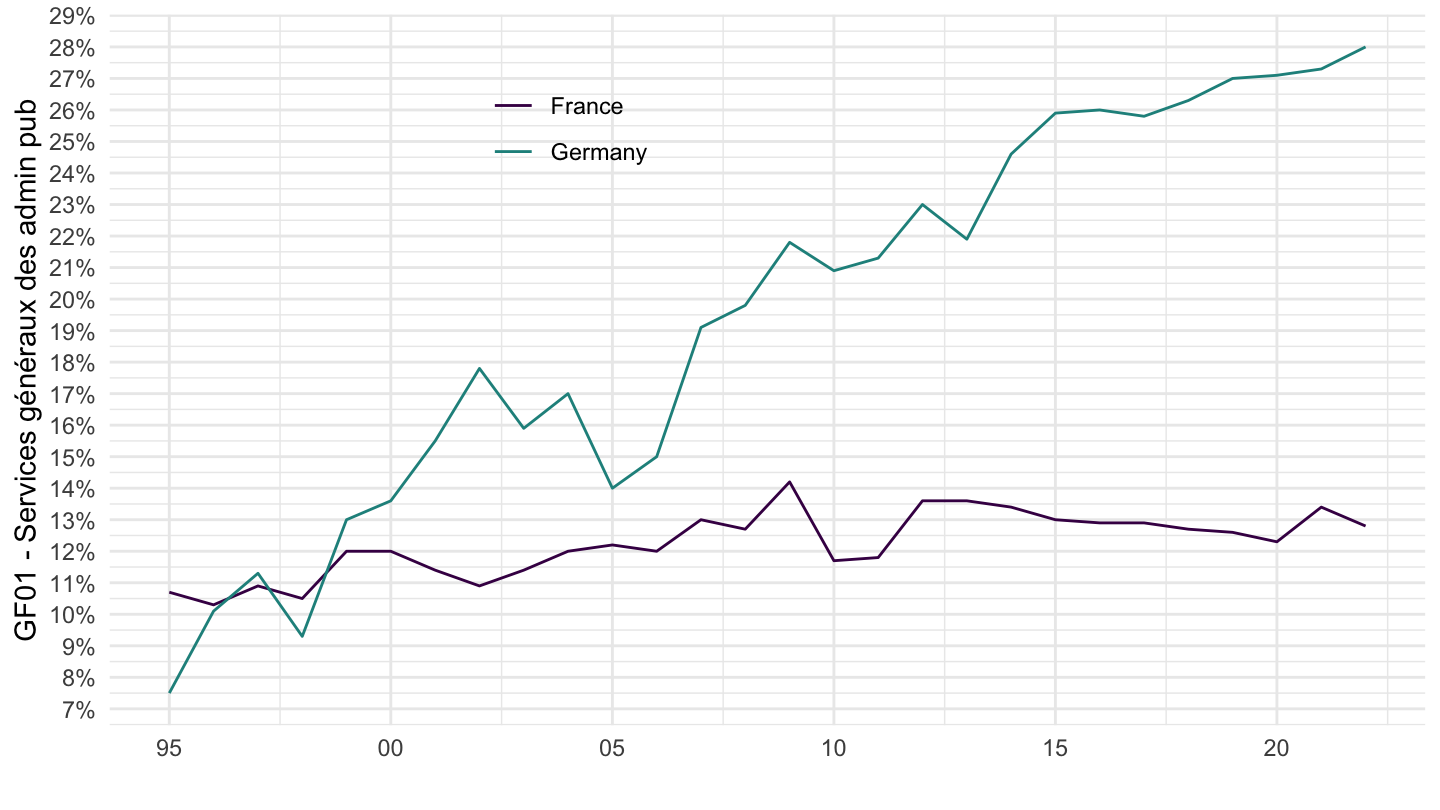
gov_10a_exp %>%
  filter(geo %in% c("FR", "DE"),
         unit == "PC_TOT",
         time == "2019",
         sector == "S13",
         nchar(cofog99) == 4,
         na_item == "P5") %>%
  left_join(geo , by = "geo") %>%
  left_join(cofog99 , by = "cofog99") %>%
  select(Geo, cofog99, Cofog99, values) %>%
  mutate(Geo = gsub(" ", "-", str_to_lower(gsub(" ", "-", Geo))),
         Geo = paste0('<img src="../../icon/flag/vsmall/', Geo, '.png" alt="Flag">')) %>%
  spread(Geo, values) %>%
{if (is_html_output()) datatable(., filter = 'top', rownames = F, escape = F) else .}gov_10a_exp %>%
filter(geo %in% c("FR", "DE"),
unit == "PC_TOT",
time == "2019",
sector == "S13",
na_item == "P5") %>%
left_join(geo , by = "geo") %>%
left_join(cofog99 , by = "cofog99") %>%
select(Geo, cofog99, Cofog99, values) %>%
mutate(Geo = gsub(" ", "-", str_to_lower(gsub(" ", "-", Geo))),
Geo = paste0('<img src="../../icon/flag/vsmall/', Geo, '.png" alt="Flag">')) %>%
spread(Geo, values) %>%
{if (is_html_output()) datatable(., filter = 'top', rownames = F, escape = F) else .}