API
Data - Compustat
François Geerolf
Open a connection
Loading your WRDS username and password into wrds_username and wrds_password:
Create a PqConnection object named wrds.
Compustat Structure
Tables
Example: Research Apple’s finances using Compustat and WRDS
Glance
Glance at cusip, at, act, revt, xsga, ppegt, ebitda for various fyear.
dbSendQuery(wrds,
"select FYEAR, CUSIP, AT, ACT, REVT, XSGA, PPEGT, PPENT, EBITDA
from comp.funda
where tic = 'AAPL' and DATAFMT='STD' and POPSRC='D' and CONSOL='C' and FIC='USA'") %>%
  dbFetch(., n = -1) %>%
  arrange(-fyear) %>%
  head(10) %>%
  as.tibble %>%
  kable(align = "c", booktabs = TRUE, linesep = "") %>%
kable_styling(bootstrap_options = c("striped", "hover", "condensed"))| fyear | cusip | at | act | revt | xsga | ppegt | ppent | ebitda |
|---|---|---|---|---|---|---|---|---|
| 2020 | 037833100 | 323888 | 143713 | 274515 | 38668 | 112096 | 45336 | 77344 |
| 2019 | 037833100 | 338516 | 162819 | 260174 | 34462 | 95957 | 37378 | 76477 |
| 2018 | 037833100 | 365725 | 131339 | 265359 | 30941 | 90403 | 41304 | 81565 |
| 2017 | 037833100 | 375319 | 128645 | 229234 | 26842 | 75076 | 33783 | 70744 |
| 2016 | 037833100 | 321686 | 106869 | 215091 | 24239 | 61245 | 27010 | 69276 |
| 2015 | 037833100 | 290479 | 89378 | 233715 | 22396 | 49257 | 22471 | 81730 |
| 2014 | 037833100 | 231839 | 68531 | 182795 | 18034 | 39015 | 20624 | 60449 |
| 2013 | 037833100 | 207000 | 73286 | 170910 | 15305 | 28519 | 16597 | 55756 |
| 2012 | 037833100 | 176064 | 57653 | 156508 | 13421 | 21887 | 15452 | 58446 |
| 2011 | 037833100 | 116371 | 44988 | 108249 | 10028 | 11768 | 7777 | 35612 |
Graph
You may directly retrieve some data, and graph it in one simple commands, as such.
dbSendQuery(wrds,
"select FYEAR, AT, EBITDA from comp.funda
where tic = 'AAPL' and DATAFMT='STD' and POPSRC='D' and CONSOL='C' and FIC='USA'") %>%
  dbFetch(., n = -1) %>%
  mutate(date = fyear %>% paste0("-01-01") %>% as.Date,
         ebit_share = ebitda / at) %>%
  ggplot(.) + geom_line(aes(x = date, y = ebit_share)) +
  theme_minimal() + xlab("") + ylab("EDITDA (% of Assets)") +
  scale_x_date(breaks = seq(1870, 2020, 5) %>% paste0("-01-01") %>% as.Date,
               labels = date_format("%y")) +
  scale_y_continuous(breaks = seq(-0.4, 0.4, 0.1),
                     labels = scales::percent_format(accuracy = 1))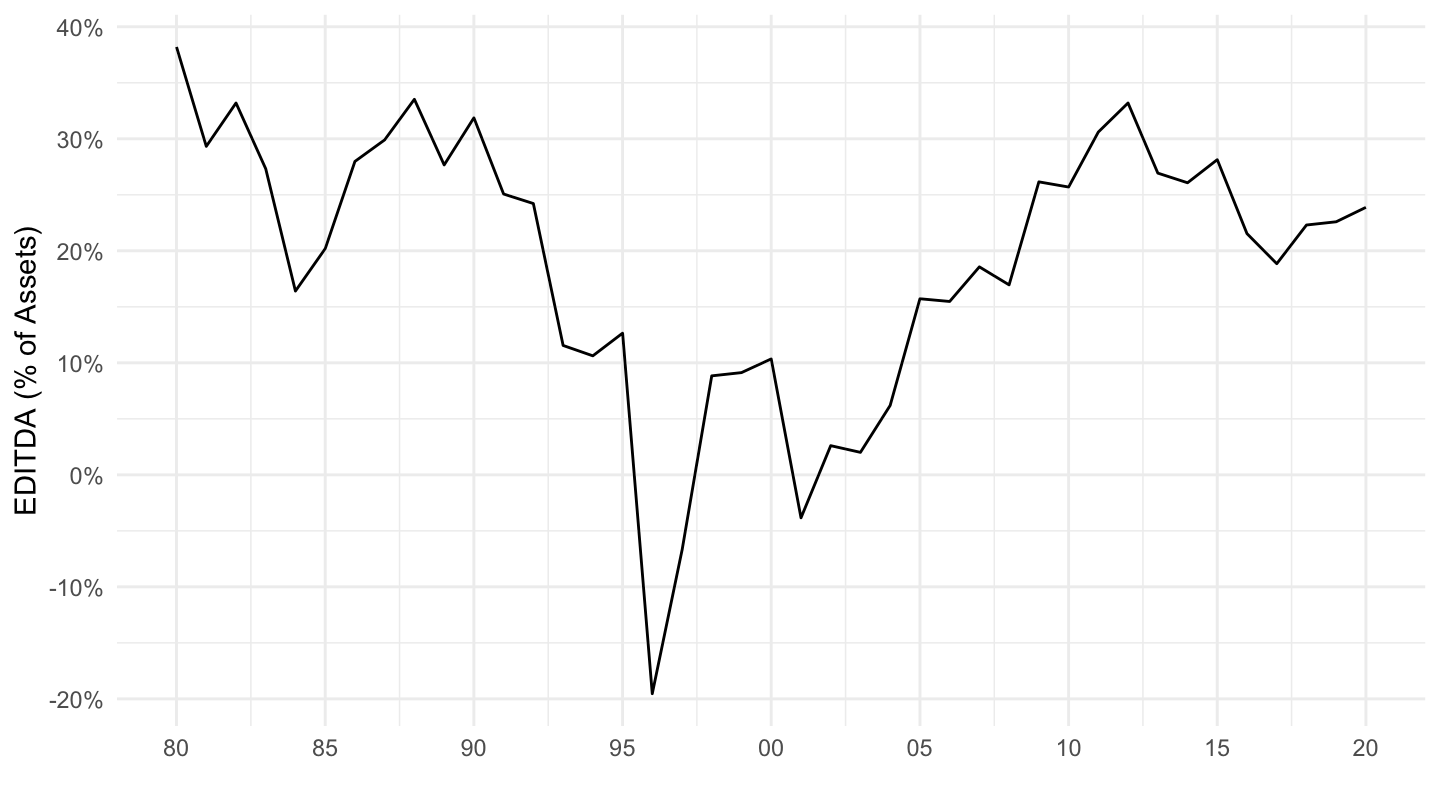
Figure 1: Apple’s EBITDA Share of Assets