Table 1.1.7. Percent Change From Preceding Period in Prices for Gross Domestic Product (A) (Q) - T10107
Data - BEA
François Geerolf
Info
LAST_DOWNLOAD
| file | LAST_DOWNLOAD |
|---|---|
| T10107_Q | 2022-10-09 |
| T10107_A | 2022-10-09 |
LAST_COMPILE
| LAST_COMPILE |
|---|
| 2024-02-11 |
Last
| date | Nobs |
|---|---|
| 2022-06-30 | 27 |
Percent Change From Preceding Period in Prices for Gross Domestic Product
All
T10107_Q %>%
  quarter_to_date() %>%
  filter(LineNumber %in% c(1, 4)) %>%
  ggplot(.) + geom_line(aes(x = date, y = DataValue/100, color = LineDescription)) +
  theme_minimal() +
  scale_color_manual(values = viridis(3)[1:2]) +
  theme(legend.title = element_blank(),
        legend.position = c(0.8, 0.8)) +
  scale_x_date(breaks = nber_recessions$Peak,
               labels = date_format("%y")) +
  scale_y_continuous(breaks = 0.01*seq(0, 40, 2),
                labels = scales::percent_format(accuracy = 1)) +
  geom_rect(data = nber_recessions %>%
              filter(Peak > as.Date("1947-01-01")),
            aes(xmin = Peak, xmax = Trough, ymin = -Inf, ymax = +Inf),
            fill = 'grey', alpha = 0.5) +
  xlab("") + ylab("Prices for Gross Domestic Product, Percent Change")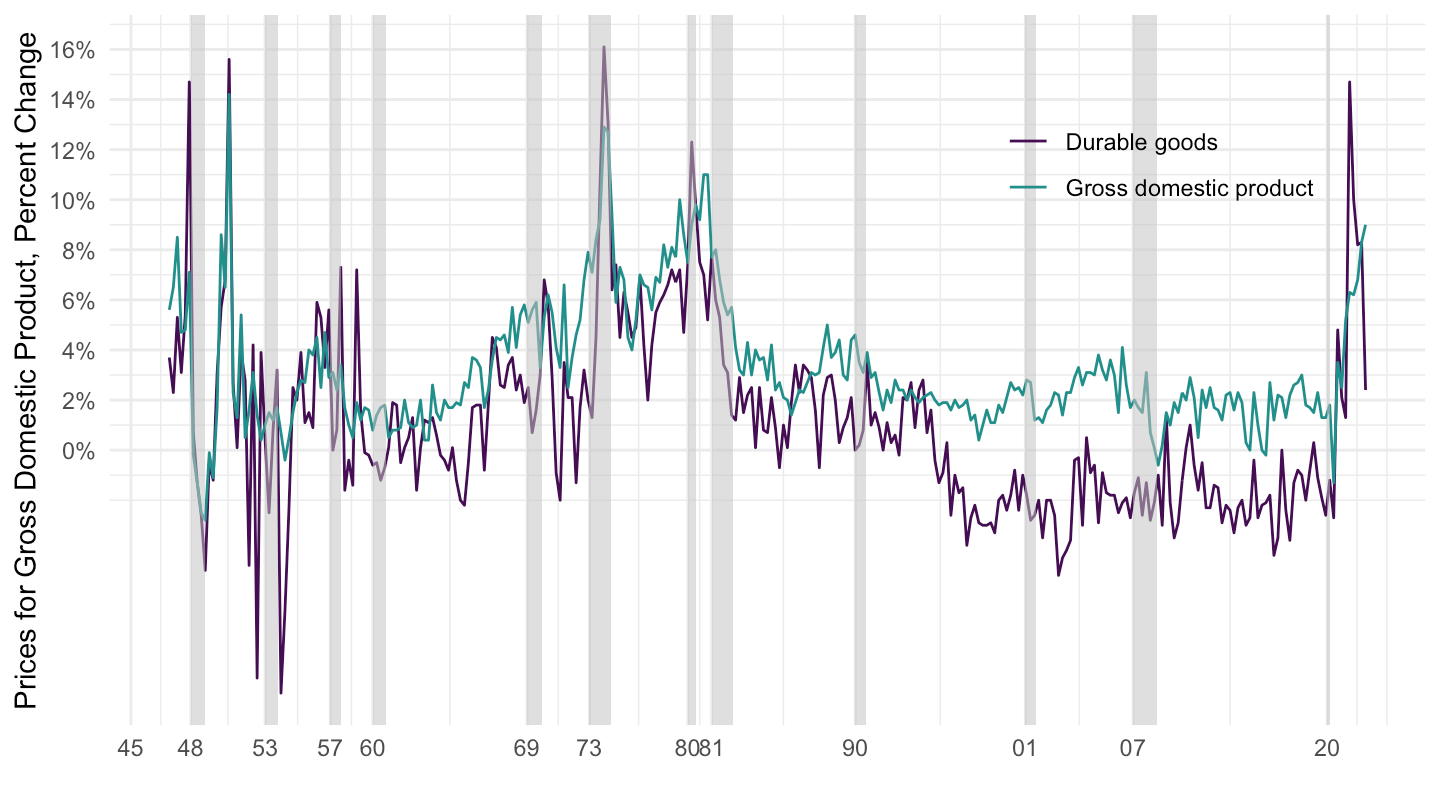
1980-
T10107_Q %>%
  quarter_to_date() %>%
  filter(LineNumber %in% c(1, 4),
         date >= as.Date("1980-01-01")) %>%
  ggplot(.) + geom_line(aes(x = date, y = DataValue/100, color = LineDescription)) +
  theme_minimal() +
  scale_color_manual(values = viridis(3)[1:2]) +
  theme(legend.title = element_blank(),
        legend.position = c(0.8, 0.2)) +
  scale_x_date(breaks = seq(1980, 2040, 5) %>% paste0("-01-01") %>% as.Date,
               labels = date_format("%Y")) +
  scale_y_continuous(breaks = 0.01*seq(0, 40, 1),
                     labels = scales::percent_format(accuracy = 1)) +
  geom_rect(data = nber_recessions %>%
              filter(Peak > as.Date("1980-01-01")),
            aes(xmin = Peak, xmax = Trough, ymin = -Inf, ymax = +Inf),
            fill = 'grey', alpha = 0.5) +
  xlab("") + ylab("Prices for Gross Domestic Product, Percent Change")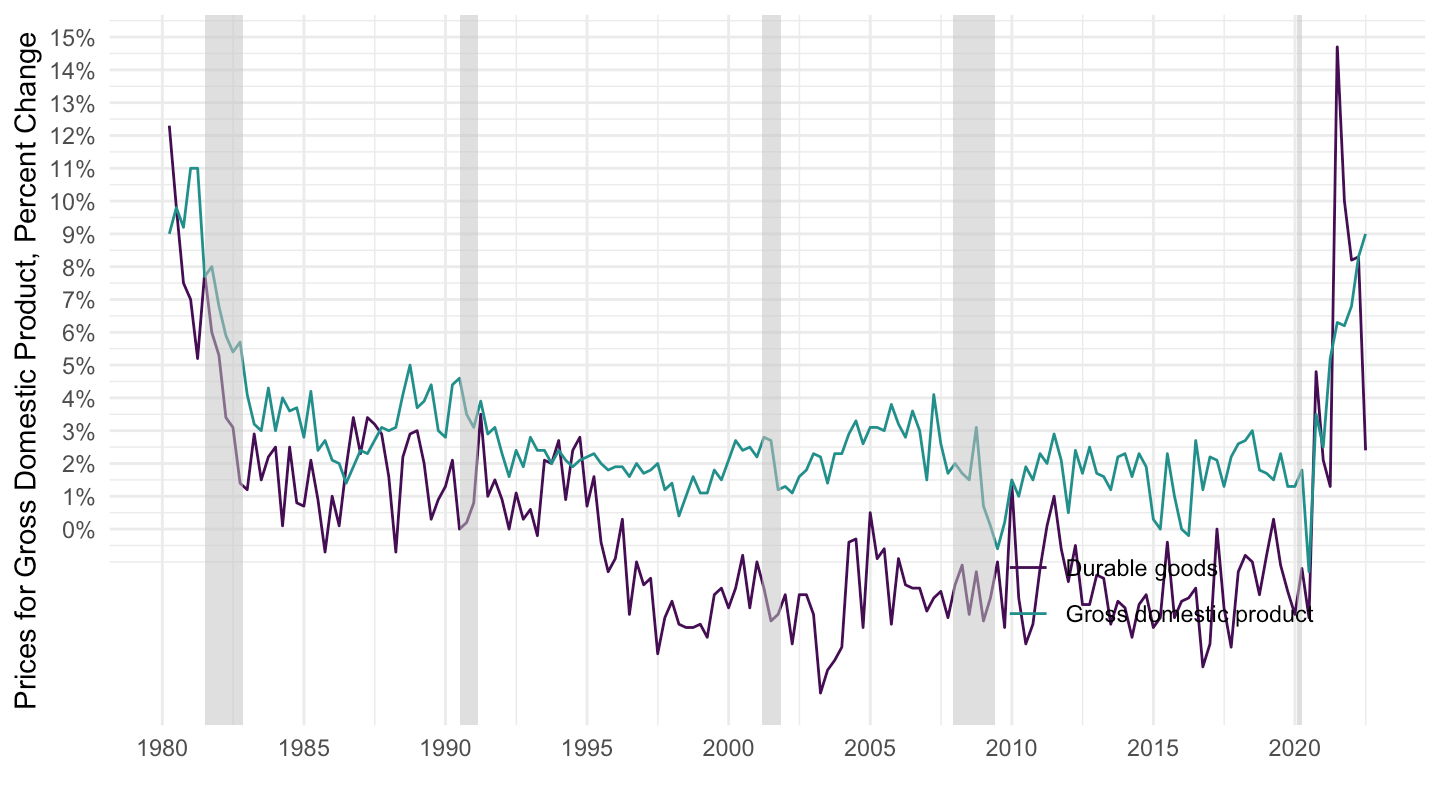
1995-
T10107_Q %>%
  quarter_to_date() %>%
  filter(LineNumber %in% c(1, 4),
         date >= as.Date("2000-01-01")) %>%
  ggplot(.) + geom_line(aes(x = date, y = DataValue/100, color = LineDescription)) +
  theme_minimal() +
  scale_color_manual(values = viridis(3)[1:2]) +
  theme(legend.title = element_blank(),
        legend.position = c(0.2, 0.8)) +
  scale_x_date(breaks = seq(1980, 2040, 5) %>% paste0("-01-01") %>% as.Date,
               labels = date_format("%Y")) +
  scale_y_continuous(breaks = 0.01*seq(-40, 40, 2),
                     labels = scales::percent_format(accuracy = 1)) +
  geom_rect(data = nber_recessions %>%
              filter(Peak > as.Date("1995-01-01")),
            aes(xmin = Peak, xmax = Trough, ymin = -Inf, ymax = +Inf),
            fill = 'grey', alpha = 0.5) +
  xlab("") + ylab("Prices for Gross Domestic Product, Percent Change")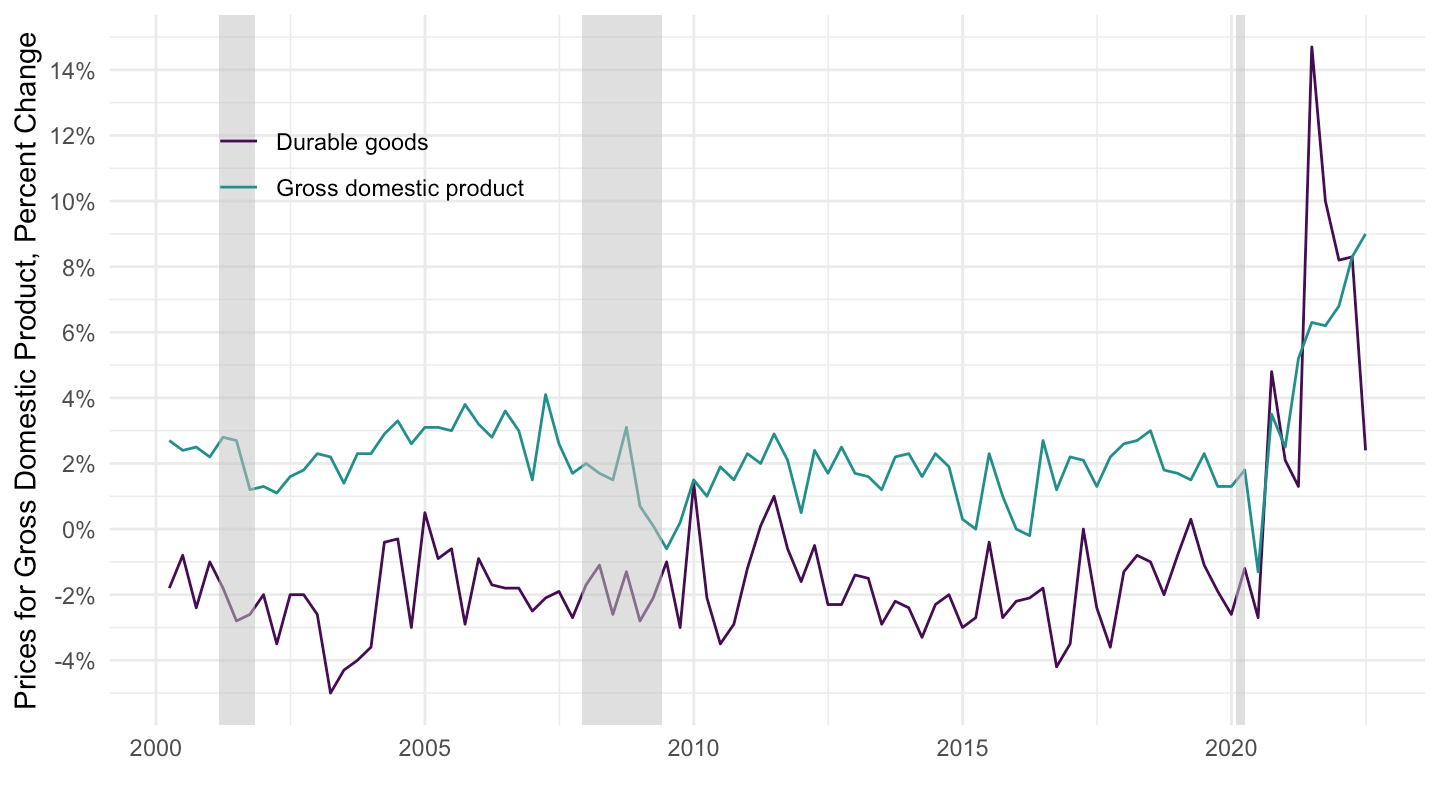
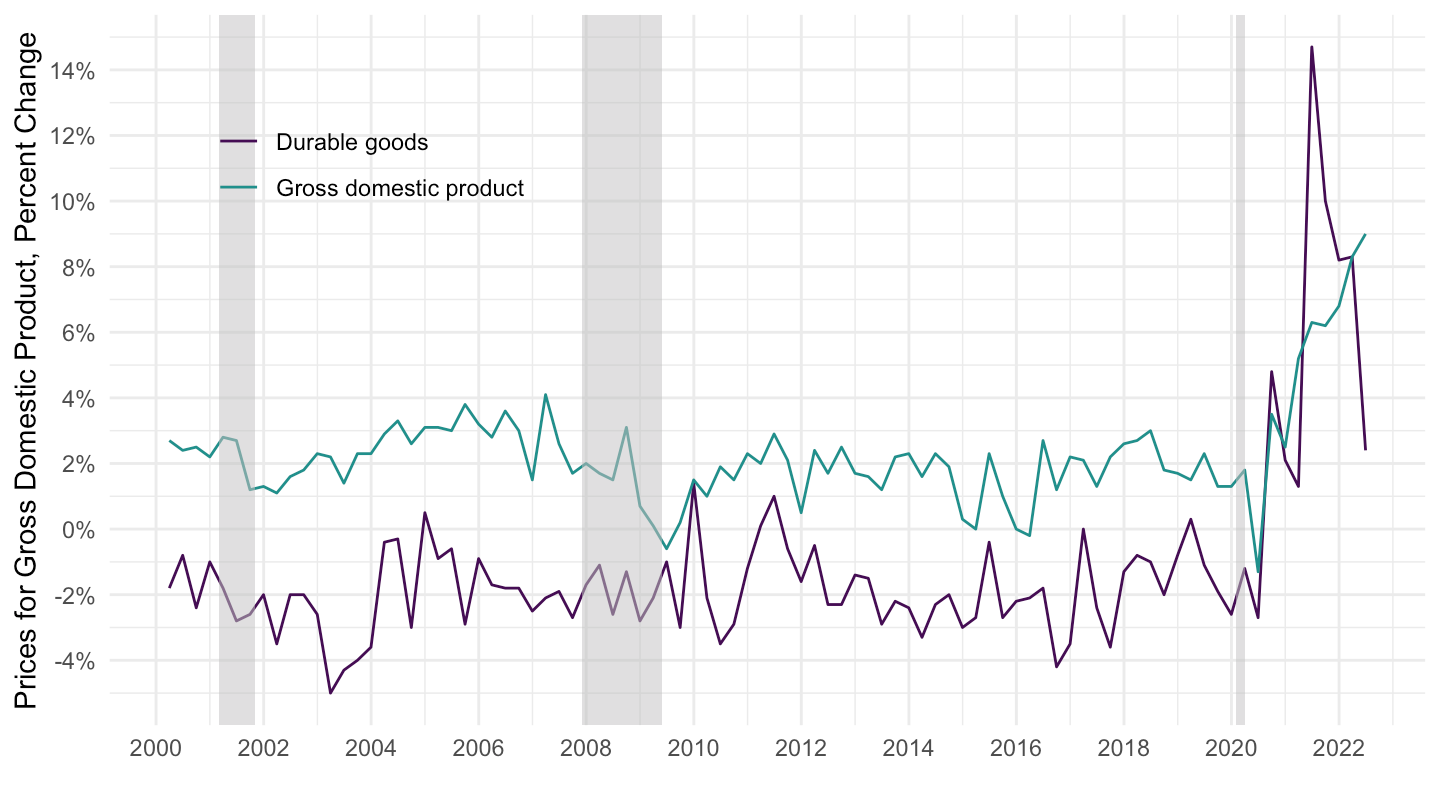
2000-
T10107_Q %>%
  quarter_to_date() %>%
  filter(LineNumber %in% c(1, 4),
         date >= as.Date("2000-01-01")) %>%
  ggplot(.) + geom_line(aes(x = date, y = DataValue/100, color = LineDescription)) +
  theme_minimal() +
  scale_color_manual(values = viridis(3)[1:2]) +
  theme(legend.title = element_blank(),
        legend.position = c(0.2, 0.8)) +
  scale_x_date(breaks = seq(1980, 2040, 2) %>% paste0("-01-01") %>% as.Date,
               labels = date_format("%Y")) +
  scale_y_continuous(breaks = 0.01*seq(-40, 40, 2),
                     labels = scales::percent_format(accuracy = 1)) +
  geom_rect(data = nber_recessions %>%
              filter(Peak > as.Date("2000-01-01")),
            aes(xmin = Peak, xmax = Trough, ymin = -Inf, ymax = +Inf),
            fill = 'grey', alpha = 0.5) +
  xlab("") + ylab("Prices for Gross Domestic Product, Percent Change")