World Maps
Code
François Geerolf
World Map
WDI(country = "all", indicator = "NE.GDI.TOTL.ZS", start = 2016, end = 2016, extra = TRUE) %>%
  select(countryname = country, countrycode = iso3c, value = NE.GDI.TOTL.ZS) %>%
  mutate(value = value/100) %>%
  arrange(countrycode) %>%
  right_join(map_data("world") %>%
               filter(region != "Greenland", region != "Antarctica") %>%
               left_join(iso3166 %>%
                           select(region = mapname, countrycode = a3) %>%
                           mutate(region = case_when(region == "China(?!:Hong Kong|:Macao)" ~ "China",
                                                     region == "Finland(?!:Aland)" ~ "Finland",
                                                     region == "UK(?!r)" ~ "UK",
                                                     region == "Norway(?!:Bouvet|:Svalbard|:Jan Mayen)" ~ "Norway",
                                                     TRUE ~ region)),
                         by = "region"),
             by = "countrycode") %>%
  ggplot(aes(long, lat, group = group)) +
  geom_polygon(aes(fill = value), colour = alpha("black", 1/2), size = 0.1)  +
  scale_fill_viridis_c(labels = scales::percent_format(accuracy = 1),
                       breaks = seq(0, 0.6, 0.1),
                       values = c(0, 0.2, 0.4, 0.6, 1)) +
  theme_void() +
  theme(legend.position = c(0.1, 0.4),
        legend.title = element_blank())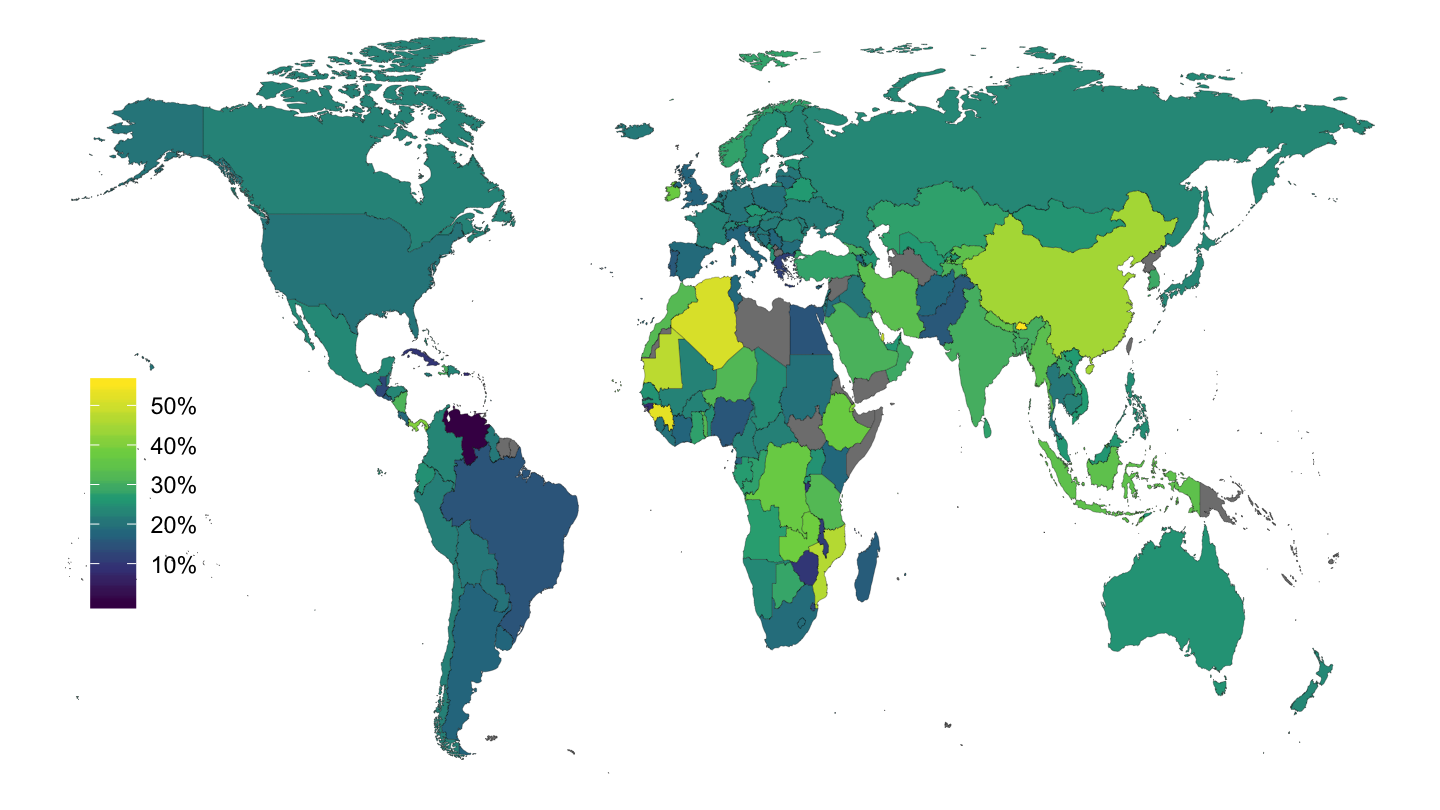
Figure 1: Investment (% of GDP), 2016.
Data from WDI
WDI returns country identifiers as iso2c and iso3c.
World Map
| long | lat | group | order | region | subregion |
|---|---|---|---|---|---|
| -69.89912 | 12.45200 | 1 | 1 | Aruba | NA |
| -69.89571 | 12.42300 | 1 | 2 | Aruba | NA |
| -69.94219 | 12.43853 | 1 | 3 | Aruba | NA |
| -70.00415 | 12.50049 | 1 | 4 | Aruba | NA |
| -70.06612 | 12.54697 | 1 | 5 | Aruba | NA |
| -70.05088 | 12.59707 | 1 | 6 | Aruba | NA |
List of Countries in World Map is below.
Crosswalks: iso3166
Putting Everything together
map_data("world") %>%
  filter(region != "Greenland", region != "Antarctica") %>%
  left_join(iso3166 %>%
              select(region = mapname, countrycode = a3) %>%
              mutate(region = case_when(region == "China(?!:Hong Kong|:Macao)" ~ "China",
                                        region == "Finland(?!:Aland)" ~ "Finland",
                                        region == "UK(?!r)" ~ "UK",
                                        region == "Norway(?!:Bouvet|:Svalbard|:Jan Mayen)" ~ "Norway",
                                        TRUE ~ region)),
            by = "region") %>%
  head %>%
print_table| long | lat | group | order | region | subregion | countrycode |
|---|---|---|---|---|---|---|
| -69.89912 | 12.45200 | 1 | 1 | Aruba | NA | ABW |
| -69.89571 | 12.42300 | 1 | 2 | Aruba | NA | ABW |
| -69.94219 | 12.43853 | 1 | 3 | Aruba | NA | ABW |
| -70.00415 | 12.50049 | 1 | 4 | Aruba | NA | ABW |
| -70.06612 | 12.54697 | 1 | 5 | Aruba | NA | ABW |
| -70.05088 | 12.59707 | 1 | 6 | Aruba | NA | ABW |
Merged
WDI(country = "all", indicator = "NE.GDI.TOTL.ZS", start = 2016, end = 2016, extra = TRUE) %>%
  select(countryname = country, countrycode = iso3c, value = NE.GDI.TOTL.ZS) %>%
  mutate(value = value/100) %>%
  arrange(countrycode) %>%
  right_join(map_data("world") %>%
               filter(region != "Greenland", region != "Antarctica") %>%
               left_join(iso3166 %>%
                           select(region = mapname, countrycode = a3) %>%
                           mutate(region = case_when(region == "China(?!:Hong Kong|:Macao)" ~ "China",
                                                     region == "Finland(?!:Aland)" ~ "Finland",
                                                     region == "UK(?!r)" ~ "UK",
                                                     region == "Norway(?!:Bouvet|:Svalbard|:Jan Mayen)" ~ "Norway",
                                                     TRUE ~ region)),
                         by = "region"),
             by = "countrycode") %>%
  head %>%
print_table| countryname | countrycode | value | long | lat | group | order | region | subregion |
|---|---|---|---|---|---|---|---|---|
| Aruba | ABW | 0.2201351 | -69.89912 | 12.45200 | 1 | 1 | Aruba | NA |
| Aruba | ABW | 0.2201351 | -69.89571 | 12.42300 | 1 | 2 | Aruba | NA |
| Aruba | ABW | 0.2201351 | -69.94219 | 12.43853 | 1 | 3 | Aruba | NA |
| Aruba | ABW | 0.2201351 | -70.00415 | 12.50049 | 1 | 4 | Aruba | NA |
| Aruba | ABW | 0.2201351 | -70.06612 | 12.54697 | 1 | 5 | Aruba | NA |
| Aruba | ABW | 0.2201351 | -70.05088 | 12.59707 | 1 | 6 | Aruba | NA |